
Journal of Geographical Sciences >
Vertical distribution changes in land cover between 1990 and 2015 within the Koshi River Basin, Central Himalayas
|
Wu Xue (1989-), Postdoctoral Researcher, specialized in land use and land cover change and its ecological effect.E-mail: wuxuexxl@163.com |
Received date: 2020-11-27
Accepted date: 2021-08-10
Online published: 2021-12-25
Supported by
The Second Tibetan Plateau Scientific Expedition and Research(2019QZKK0603)
Strategic Priority Research Program of the Chinese Academy of Sciences(XDA20040201)
National Natural Science Foundation of China(41761144081)
The study of mountain vertical natural belts is an important component in the study of regional differentiation. These areas are especially sensitive to climate change and have indicative function, which is the core of three-dimensional zonality research. Thus, based on high precision land cover and digital elevation model (DEM) data, and supported by MATLAB and ArcGIS analyses, this paper aimed to study the present situation and changes of the land cover vertical belts between 1990 and 2015 on the northern and southern slopes of the Koshi River Basin (KRB). Results showed that the vertical belts on both slopes were markedly different from one another. The vertical belts on the southern slope were mainly dominated by cropland, forest, bare land, and glacier and snow cover. In contrast, grassland, bare land, sparse vegetation, glacier and snow cover dominated the northern slope. Study found that the main vertical belts across the KRB within this region have not changed substantially over the past 25 years. In contrast, on the southern slope, the upper limits of cropland and bare land have moved to higher elevation, while the lower limits of forest and glacier and snow cover have moved to higher elevation. The upper limit of alpine grassland on the northern slope retreated and moved to higher elevation, while the lower limits of glacier and snow cover and vegetation moved northward to higher elevations. Changes in the vertical belt were influenced by climate change and human activities over time. Cropland was mainly controlled by human activities and climate warming, and the reduced precipitation also led to the abandonment of cropland, at least to a certain extent. Changes in grassland and forest ecosystems were predominantly influenced by both human activities and climate change. At the same time, glacier and snow cover far away from human activities was also mainly influenced by climate warming.
Key words: vertical belt; land cover; Central Himalayas; Koshi River Basin; climate change
WU Xue , PAUDEL Basanta , ZHANG Yili , LIU Linshan , WANG Zhaofeng , XIE Fangdi , GAO Jungang , SUN Xiaomin . Vertical distribution changes in land cover between 1990 and 2015 within the Koshi River Basin, Central Himalayas[J]. Journal of Geographical Sciences, 2021 , 31(10) : 1419 -1436 . DOI: 10.1007/s11442-021-1904-2
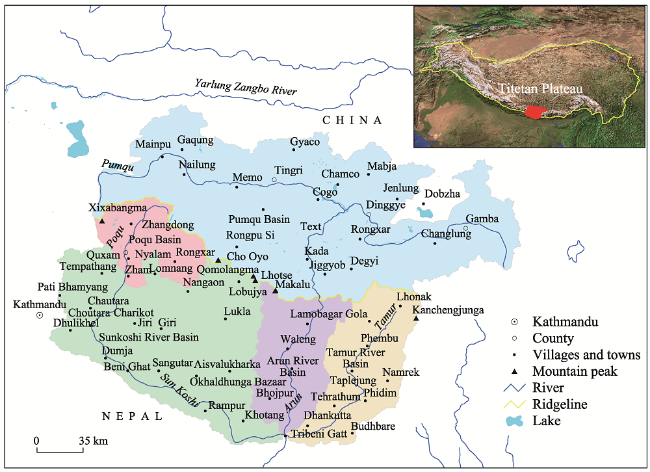
Figure 1 Location and boundary of the Koshi River Basin (Boundary of the Tibetan Plateau quoted from Zhang et al., 2021) |
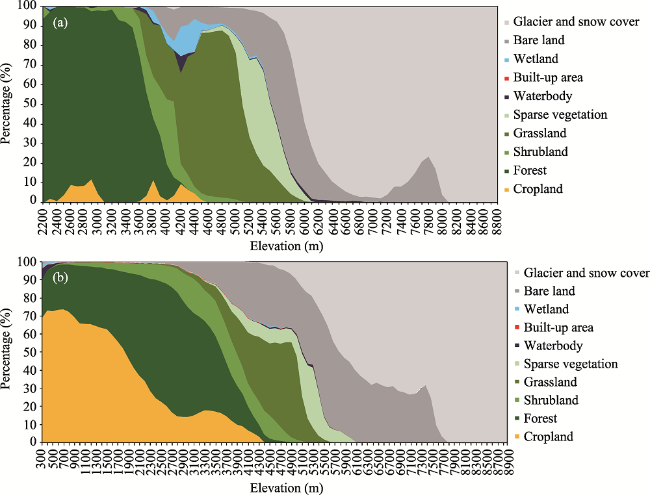
Figure 2 Altitudinal distributions of different land cover types in the Koshi River Basin (a. northern slope; b. southern slope) |
Figure 3 Dominant altitudinal belt structures of land cover types in the Koshi River Basin (a. northern slope; b. southern slope) |
Figure 4 Land cover change and its transfer rate in the Koshi River Basin from 1990 to 2015 (a. land cover change; b. transfer rate on northern slope; c. transfer rate on southern slope) |
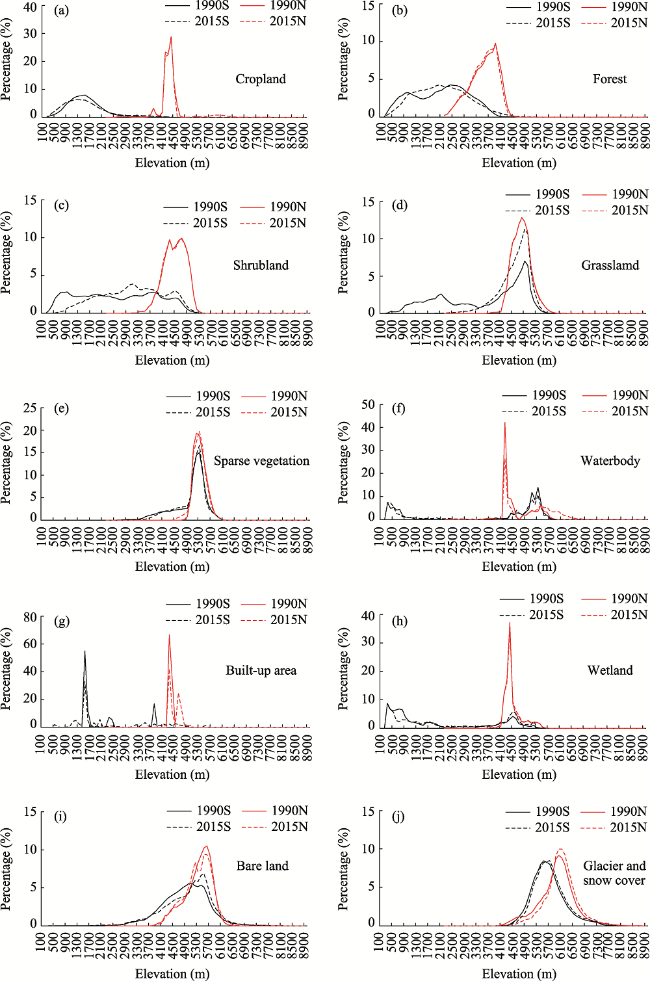
Figure 5 The vertical distribution of land cover changes with elevation in the Koshi River Basin |
Table 1 Altitudinal distributions of different land cover types in the Koshi River Basin on the northern and southern slopes (m) |
| Land cover | Southern slope | Northern slope | ||||||||||
|---|---|---|---|---|---|---|---|---|---|---|---|---|
| 1990 | 2015 | 1990 | 2015 | |||||||||
| Altitude range | Core distribution zone | Dominant belt | Altitude range | Core distribution zone | Dominant belt | Altitude range | Core distribution zone | Dominant belt | Altitude range | Core distribution zone | Dominant belt | |
| Cropland | 96-4300 | 800-1800 | 100-700 | 96-4300 | 600-1800 | 100-1000 | 2300-4600 | 4100-4400 | - | 2200-4600 | 4100-4400 | - |
| Forest | 96-4200 | 800-3000 | 700-2000 | 96-4200 | 900-2700 | 1000-3900 | 2100-4200 | 3200-4100 | 2100-4000 | 2100-4200 | 3200-4100 | 2100-3900 |
| Shrub land | 100-5100 | 600-2200 3400-4500 | 2000-3700 | 100-5100 | 2100-4500 | - | 2300-5000 | 4200-4900 | 4000-4100 | 2400-4800 | 4200-4900 | 3900-4100 |
| Grassland | 200-5300 | 3700-5300 | 3700-4000 | 1400-5300 | 4300-5100 | - | 2500-5300 | 4400-5000 | 4100-5300 | 2600-5300 | 4400-5000 | 4100-5100 |
| Sparse vegetation | 2100-5500 | 4800-5500 | - | 2100-5500 | 4700-5500 | - | 2500-5500 | 5000-5500 | - | 2500-5500 | 5000-5300 | 5100-5300 |
| Waterbody | 100-5600 | 200-800 5000-5300 | - | 100-5600 | 200-1000 4800-5600 | - | 2200-5600 | 4100-4500 | - | 2200-5600 | 4100-4600 | - |
| Built-up area | 400-700 1400-2400 | 1400-1600 2200-2400 | - | 400-4400 | 1000-2000 | - | 4200-4400 | 4200-4400 | - | 3500-4400 | 4200-4400 | - |
| Bare land | Over 200 | 4300-5600 | 4000-5400 | Over 200 | 4400-5700 | 3900-5700 | Over 2200 | 5000-5900 | - | Over 2200 | 4900-5900 | - |
| Wetland | Less than 5400 | 200-1700 | - | Less than 5500 | 200-1800 | - | 3500-5700 | 4100-4400 | 5300-5900 | 3500-5700 | 4200-4500 | 5500-6000 |
| Glacier and snow cover | Over 3700 | 5000-5900 | Over 5400 | Over 4000 | 5000-6000 | Over 5700 | Over 3600 | 5500-6500 | Over 5900 | Over 3600 | 5600-6500 | Over 6000 |
Table 2 Summary of the variables of logistic regression model for land cover change in the Koshi River Basin |
| Land cover on southern slope | Variable | β | S.E. | Wald | Sig (p) | Odds ratio |
|---|---|---|---|---|---|---|
| Glacier and snow cover | TMP | 70.084 | 28.101 | 6.220 | 0.013 | 2.735 |
| TMX | 458.526 | 152.815 | 9.003 | 0.003 | 1.366 | |
| TMN | -705.254 | 216.345 | 10.627 | 0.001 | 0.000 | |
| Forest | PRE | -0.008 | 0.012 | 0.508 | 0.047 | 0.992 |
| TMN | 93.948 | 72.954 | 1.658 | 0.019 | 6.326 | |
| Cropland | PRE | 0.138 | 0.034 | 16.884 | 0.000 | 1.148 |
| TMP | 305.274 | 93.714 | 10.611 | 0.001 | 3.790 | |
| TMN | -219.798 | 100.111 | 4.820 | 0.028 | 0.000 | |
| TMX | -877.120 | 240.970 | 13.249 | 0.000 | 0.000 | |
| Bare land | TMN | -120.064 | 61.371 | 3.827 | 0.050 | 0.000 |
| TMX | 187.431 | 93.069 | 4.056 | 0.044 | 2.513 | |
| Land cover on northern slope | Variable | β | S.E. | Wald | Sig (p) | Odds ratio |
| Glacier and snow cover | TMN | 454.324 | 139.590 | 10.593 | 0.001 | 2.043 |
| TMX | -759.591 | 180.584 | 17.693 | 0.000 | 0.000 | |
| Grassland | TMP | -76.096 | 14.043 | 29.365 | 0.000 | 0.000 |
| TMN | -271.772 | 155.047 | 3.072 | 0.080 | 0.000 |
| [1] |
|
| [2] |
|
| [3] |
|
| [4] |
|
| [5] |
|
| [6] |
|
| [7] |
|
| [8] |
|
| [9] |
|
| [10] |
|
| [11] |
|
| [12] |
|
| [13] |
|
| [14] |
|
| [15] |
|
| [16] |
|
| [17] |
|
| [18] |
|
| [19] |
|
| [20] |
|
| [21] |
|
| [22] |
|
| [23] |
|
| [24] |
|
| [25] |
|
| [26] |
|
| [27] |
|
| [28] |
|
| [29] |
|
| [30] |
|
| [31] |
|
| [32] |
|
| [33] |
|
| [34] |
|
| [35] |
|
| [36] |
|
| [37] |
|
| [38] |
|
| [39] |
|
| [40] |
|
| [41] |
|
| [42] |
|
| [43] |
|
| [44] |
|
| [45] |
|
/
| 〈 |
|
〉 |

