Research Articles

Explicating the mechanisms of land cover change in the New Eurasian Continental Bridge Economic Corridor region in the 21st century

  • FAN Zemeng , 1, 2, 3 ,
  • LI Saibo 1, 2 ,
  • FANG Haiyan , 1, 2, 4, *
Expand
  • 1. State Key Laboratory of Resources and Environmental Information System, Institute of Geographic Sciences and Natural Resources Research, CAS, Beijing 100101, China
  • 2. College of Resources and Environment, University of Chinese Academy of Sciences, Beijing 100049, China
  • 3. Jiangsu Center for Collaborative Innovation in Geographical Information Resource, Nanjing 210023, China
  • 4. Key Laboratory of Water Cycle and Related Land Surface Processes, CAS, Beijing 100101, China
*Fang Haiyan, PhD and Associate Professor, E-mail:

Fan Zemeng, PhD and Associate Professor, specialized in ecological modelling and system simulation. E-mail:

Received date: 2021-02-03

  Accepted date: 2021-06-11

  Online published: 2021-12-25

Supported by

National Key R&D Program of China(2017YFA0603702)

National Key R&D Program of China(2018YFC0507202)

National Natural Science Foundation of China(41971358)

National Natural Science Foundation of China(41930647)

National Natural Science Foundation of China(41977066)

Strategic Priority Research Program (A) of the Chinese Academy of Sciences(XDA20030203)

Innovation Project of LREIS(O88RA600YA)

Abstract

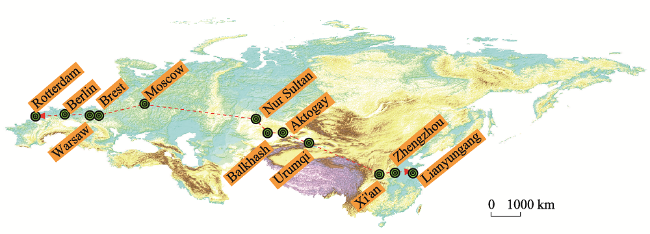
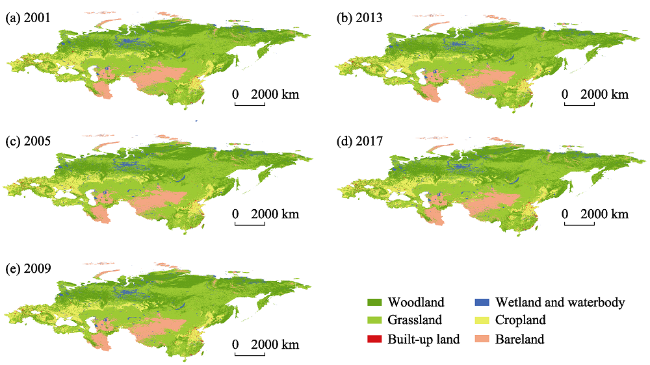
Land cover change has presented clear spatial differences in the New Eurasian Continental Bridge Economic Corridor (NECBEC) region in the 21st century. A spatiotemporal dynamic probability model and a driving force analysis model of land cover change were developed to analyze explicitly the dynamics and driving forces of land cover change in the NECBEC region. The results show that the areas of grassland, cropland and built-up land increased by 114.57 million ha, 8.41 million ha and 3.96 million ha, and the areas of woodland, other land, and water bodies and wetlands decreased by 74.09 million ha, 6.26 million ha, and 46.59 million ha in the NECBEC region between 2001 and 2017, respectively. Woodland and other land were mainly transformed to grassland, and grassland was mainly transformed to woodland and cropland. Built-up land had the largest annual rate of increase and 50% of this originated from cropland. Moreover, since the Belt and Road Initiative (BRI) commenced in 2013, there has been a greater change in the dynamics of land cover change, and the gaps in the socio-economic development level have gradually decreased. The index of socio-economic development was the highest in western Europe, and the lowest in northern Central Asia. The impacts of socio-economic development on cropland and built-up land were greater than those for other land cover types. In general, in the context of rapid socio-economic development, the rate of land cover change in the NECBEC has clearly shown an accelerating trend since 2001, especially after the launch of the BRI in 2013.

Cite this article

FAN Zemeng , LI Saibo , FANG Haiyan . Explicating the mechanisms of land cover change in the New Eurasian Continental Bridge Economic Corridor region in the 21st century[J]. Journal of Geographical Sciences, 2021 , 31(10) : 1403 -1418 . DOI: 10.1007/s11442-021-1903-3

1 Introduction

The dynamic pattern of land cover change, one of the most direct results of climate change and human activities on the Earth’s surface system (Lawler et al., 2014), has affected directly changes in the surface energy balance, the carbon cycle, the water cycle and species diversity (Foley et al., 2005; Turner, 2007; Alkama and Cescatti, 2016), and furthermore it has impacted on local ecological safety, food safety and socio-economic sustainable development. Land cover change has caused changes in vegetation and soil carbon storage (Jackson et al., 2002; Lai et al., 2016) and altered local ecosystem services (Hopping et al., 2018; Yalew et al., 2018). Changes in the distribution of woodland and water bodies will affect the hydrological environment (Meneses et al., 2015; Luo et al., 2016) and the land surface temperature (Blois et al., 2013; Deng et al., 2018; Yue et al., 2019).
Since the launch of the International Geosphere Biosphere Program (IGBP) and the International Human Dimensions Program (IHDP) in 1995, many researches have attempted to explain the driving forces and to predict the land cover change at different levels. Related studies show that human behavior together with local economic activity have played important roles in land cover change (Lambin et al., 2001): an accelerating urbanization process has increased the degree of fragmentation and structural complexity of the desert landscape in central Arizona including the region around Phoenix (Jenerette and Wu, 2001); and comparative analysis of the urban medium-voltage networks (MV networks) and the distribution of urban land use may be used to explain the importance of technology in land cover change (Hasselmann et al., 2010). The influence of climate change on urban land use will become more severe in the future (He et al., 2015); human activities were found to be the key driving factors of land cover change in the Sanjiang Plain of China (Dan et al., 2015); development strategies for urbanization and industrialization have had prominent impacts on land use change in China (Kuang et al., 2016); the ownership and protection policies of land resources have affected land cover change (Zhao, 2016; Scharsich et al., 2017), especially at the rural-urban peripheries (Shkarua et al., 2017); and socio-economic factors, e.g., livestock farming, agriculture and market prices were found to be an important driving force of land cover change in rural Quindío in Colombia (Quintero-Gallego et al., 2018). However, the aforementioned studies have focused mainly on the driving factors of land cover change in a single city and the rural-urban peripheries (Shkarua et al., 2017), and they have lacked research on the impact of different urban development strategies on land cover change. For instance, the effect of international development policies, and co-operative plans or initiatives on land cover change between countries have rarely been mentioned.
With the launch of the Belt and Road Initiative (BRI) in 2013, more and more countries have joined the BRI (Wen et al., 2019). Much research has been undertaken to discuss the framework and model of cooperative development (Dong et al., 2017) and the relationships between the participating countries in the BRI areas (Liu et al., 2018; Zhang and Wu, 2018), especially in the New Eurasian Continental Bridge Economic Corridor (NECBEC) region (Zhang et al., 2018). However, there is still a lack of explicit analysis and discussion regarding the dynamic pattern and driving force of land cover change which would be very beneficial to the scientific planning and efficient utilization of land resources in the NECBEC region (Fan and Li, 2019).
To understand explicitly the dynamic changes of land cover in the NECBEC region, a dynamic probability model of land cover change was developed to calculate quantitatively the interannual rate of change of each land cover type and its spatiotemporal dynamic probability (STDP) on a grid scale since the start of the 21st century. Moreover, an integrated analysis model of driving forces on land cover change was developed to compute the contribution coefficients for land cover change with respect to different socio-economic factors, to analyze the spatiotemporal agglomeration index of socio-economic development, and to explain the mechanisms for land cover change in the countries in the NECBEC region from 2001 to 2017.

2 Data and methods

2.1 Study area and data

The NECBEC connects Chinese exporters to European markets, eastward from Lianyungang city of Jiangsu province in China, and westward to the port of Rotterdam in the Netherlands, and involves 28 countries—China, the Russian Federation, Kyrgyzstan, Kazakhstan, Turkey, Turkmenistan, Iran, Uzbekistan, Belarus, Germany, the Netherlands, Poland, France, Slovakia, Austria, Hungary, Switzerland, Slovenia, Romania, Serbia, Ukraine, Bosnia and Herzegovina, Croatia, Bulgaria, Montenegro, Georgia, Azerbaijan and Mongolia (Figure 1). The whole NECBEC region is about 5,071 km2 and covers more than 36% of the total area of the Earth’s land surface. There are more than 4.2 billion people inhabiting this region, accounting for 75% of the world’s population (Igbinoba, 2018). The section of the NECBEC in China covers the areas along the Longhai and Lanxin railways and from where there are three routes which connect with the Dutch port of Rotterdam (Karrar, 2016).
Figure 1 The New Eurasian Continental Bridge Economic Corridor (NECBEC) region
The land cover data used to analyze the dynamics of land cover change in the NECBEC region were collected from the MODIS dataset of the NASA website (https://www.nasa.gov) in 2001, 2005, 2009, 2013 and 2017 with a spatial resoulution of 500 m × 500 m. The socio-economic data of countries along the NECBEC region were collected from the Agriculture Organization of the United Nations (http://www.fao.org) and the World Bank Group (https://data.worldbank.org), including eight data variables of GDP (V1), urban population (V2), railway traffic mileage (V3), population density (V4), population of service industry (V5), value added from agriculture (V6), value added from industry (V7) and GDP per unit of energy use (purchasing power parity USD of per kg oil equivalent) (V8) during the period from 2001 to 2017. The land cover types were reclassified into woodland, grassland, cropland, built-up land, wetlands and waterbodies, and other land, and were merged with the land cover classiffication system of the University of Maryland (UMD) and that of several researchers (Fan et al., 2013; Zeng et al., 2018) through use of ArcGIS software and Python and R programming languages.

2.2 Spatiotemporal dynamic probability model of land cover change

How to identify quantitatively the annual change intensity of land cover is important from the standpoint of improving the adaptation strategies used to mitigate (and in turn benefit from) the effect of climate change on the projected impact on land use (Rounsevell and Reay, 2009). The dynamic degree indicator was introduced to calculate the rates of land cover change (Lawler et al., 2014), which may be formulated as:
$D_{k}=\left(S_{t+1}-S_{t}\right) / S_{t} \times \frac{1}{Y_{t+1}-Y_{t}} \times 100 \%$
where Dk represents the annual dynamic degree of land cover type k during the period from t to t+1, St and St+1 are the areas of a certain land cover type at periods t and t+1, respectively, Yt and Yt+1 are the years at periods t and t+1, respectively. To describe explicitly the spatiotemporal conversion pattern of land cover, a spatiotemporal conversion matrix was developed to compute the probability of interchange between the various land cover types during the different periods (Table 1).
Table 1 Overview of the conversion probability matrixes of land cover
T1 T2
LC1 LC2 LC3 LCn
LC1 P11 P12 P13 P1n
LC2 P21 P22 P23 P2n
LC3 P31 P32 P33 P3n
LCn Pn1 Pn2 Pn3 Pnn

Notes: T1 and T2 are the different periods; LC1, LC2, LC3,..., LCn, respectively, represent the land cover types; P is the transition probability of land cover.

Land cover change is a complex process which is affected by the continuous interaction of various natural elements and human activities (Fan et al., 2013). If research on the driving mechanisms for land cover change is limited to only some regions and administrative units at a certain period, and ignores the grid heterogeneity and interannual uncertainty of land cover change, it would become exceedingly challenging to understand the driving forces of land cover change and the annual dynamic degree of land cover at the grid level. In this study, a new STDP model was developed to compute the STDP of land cover change at the grid level in the NECBEC region based on the land cover data from 2001 to 2017. The STDP model can be formulated as:
$D T_{k}=\left(\left|\Delta S_{k, \text { in }}\right|+\left|\Delta S_{k, \text { out }}\right|\right) / S_{k, t}$
$D W_{k}=\left\{\begin{array}{ll}D T_{k} / \sum_{i=1}^{i=6} D T_{i}, & D T_{k}<1 \\1, & D T_{k} \geqslant 1\end{array}\right.$
$D M(x, y)_{k}=\left\{\frac{1}{T}, 0\right\}$
$\operatorname{STDP}(x, y)_{k}=\sum_{j=1}^{j=m} D W_{k} \times D M(x, y)_{k, j}$
where x,y is the coordinate of grid cell, k is a certain type of land cover, t is time, i is the type code of land cover whose value is from 1 to 6, j is the value of the annual interval between the periods t and t+1; DTk and DWk represent the dynamic trend and the weight index of the land cover type k, respectively, between t and t+1; ΔSk,in and ΔSk,out are the increase and decrease areas of land cover type k, respectively, between t and t+1; Sk,t is the total area of land cover type k for the period t; DTi is the dynamic trend of the ith land cover type between t and t+1; DM(x,y)k represents the annual change index of land cover type k at grid (x,y) between t and t+1; T is the time interval between t and t+1; STDP(x,y)k represents the integrated spatiotemproal dynamic probability of land cover type k at grid (x,y) between tand t+1 and whose value ranges from 0 to 1.
The operational process of the STDP model includes the following major steps: Step 1, obtaining the DTk, DWk and DM(x,y)k by, respectively, applying equations (2), (3) and (4) in terms of the land cover data at periods t and t+1; Step 2, identifying whether the land cover type k at grid (x,y) changes or not from period t to t+1; if yes, the grid factor weight value is 1/T, else, the grid factor weight value is 0; Step 3, identifying whether the land cover type k at grid (x,y) changes or not in each annual time interval between periods t and t+1; if yes, the STDP value of land cover type k at grid (x,y) is 1, else, the STDP value of land cover type k at grid (x,y) is summed in terms of each annual interval DWk and DM(x,y)k value of land cover type k at grid (x,y) between periods t and t+1; and Step 4, repeating Step 3 untill all grid cells of land cover type k are calculated.

2.3 Integrated analysis model of driving forces on land cover change

For analyzing explicitly the relationship between land cover change and socio-economic development level in the NECBEC region, a synthesis score index was developed to compute the contribution rate of the driving forces to the socio-economic development level using the principal component analysis (PCA) method, which can be formulated as:
$S S I=\sum_{u=1}^{u=g} Z_{u} \times \frac{\lambda_{u}}{\sum_{u=1}^{u=g} \lambda_{u}}$
where SSI represents the synthesis score of each country among the NECBEC region; u is the major principal component code that represents the selected number (g) of driving factors with the PCA method whose information content covers more than 85% of all the original driving factors; Zu is the score of the uth pricipal component; λu is the contribution rate of the uth principal component of all the original driving factors.
Moran’s index (Moran, 1950; Ray et al., 1984) was introuduced to identify the location of spatial clusters of socio-economic development in the countries of the NECBEC region. On the basis of the synthesis score for socio-economic development in the countries of the NECBEC region, the global Moran’s index was used to calculate the cluster level of the whole NECBEC region, and the Local Indicators of Spatial Association (LISA) index was used to calculate the LISA cluster level of every country in the NECBEC region.
Moreover, to explain the impacts of socio-economic development on land cover change, the geodetector method (Wang et al., 2010) was used to analyze the driving mechanisms of land cover change based on the K-means clustering factor. The geodetector method is a set of statistical methods for detecting spatial differentiation and revealing the driving factors (Wang et al., 2016), and may be used to measure the spatial differentiation of land cover change based on the spatial data of land cover and socio-economic factors. The expression for the driving factor detection index (q) can be expressed as:
$q=1-\frac{1}{N \sigma^{2}} \sum_{h}^{L} N_{h} \sigma_{h}^{2}$
where q represents the driving factor detection index for the spatial differentiation of the land cover change, Nh is the number of sample units in the sub-region; N is the number of sample units in whole region; L is the number of sub-regions; σ 2 and $\sigma_{h}^{2}$are the variances of land cover change STDPs in the whole region and the sub-region, respectively. The value interval of the q index is [0,1]. When q = 0, this is an indication that the STDP is randomly distributed. The larger the value of q, the greater is the impact of the influence of the socio-economic factors.

3 Results

3.1 Spatial distribution of land cover in the NECBEC region

The distribution of all land cover types showed the following characteristics of change in the NECBEC region (Figure 2) during the period 2001 to 2017. The area of grassland covered 44.06%-45.01% of the toal area of the NECBEC and was mainly distributed in the Inner Mongolia Plateau, the Qinghai-Tibet Plateau and the southern hilly region in China, the Central Siberian Plateau and the Eastern Siberian Mountains in Russia, the northern part of Mongolia and the semi-arid area of Kazakhstan. The area of woodland accounted for 33.51%-34.28% of the total area and was mainly distributed in the Eastern European Plains and the northern part of Russia, the northeastern and southeastern hilly zones of China, and western Europe. The area of other land occupied 8.85%-9.24% of the total area and was distributed in northwestern China, southern Mongolia, the Iranian Plateau and the Karakum Desert and the Kyzylkum Desert of Central Asia. The area of cropland only accounted for 7.84%-8.00% of the total area and was distributed in the Northeast China Plain, the North China Plain, the Middle-Lower Yangtze River Plains and the Sichuan Basin of China, western Europe and southwestern Russia. The area of built-up land covered just less than 0.5% of the total area and was mainly asociated with cropland.
Figure 2 The spatial patterns of land cover in the NECBEC region from 2001 to 2017

3.2 Spatiotemporal change of land cover in the NECBEC region

Regarding the results gained by analyzing the area of each land cover type of the NECBEC region in 2001, 2005, 2009, 2013 and 2017 (Figure 2), the transformed area and rate of change of land cover that were obtained were used to explain the significant spatiotemporal differences during the period from 2001 to 2017 (Table 2). The areas of grassland, cropland and built-up land all showed an expansionary trend and increased by 114.57 million ha, 8.41 million ha and 3.96 million ha, respectively; the annual rate of increase for built-up land was the highest, and that of cropland was the lowest between 2001 and 2017. The grassland was mainly converted to woodland and accounted for 69.72% of the total increase in the woodland area; however, the woodland was mainly converted to grassland and accounted for 70% of the total increase in grassland that was distributed centrally in the temperate continental climate zone, the Mediterranean climate zone, and the transition zone between woodland and grassland in Russia; these transitions indicated that the changes from grassland to woodland and vice versa occurred most easily in the NECBEC region. The cropland was mainly converted to built-up land and accounted for 50% of the total area of the increased built-up land, which was mainly distributed in the eastern coastal areas and the northern slopes of the Tianshan Mountains, and in Turkey, Azerbaijan and Russia. About 98% of the total increase in the area of cropland was transformed from grassland, and was mainly distributed in the northwest of China and the eastern region of Europe. However, the areas of woodland, water bodies and wetlands, and other land all showed a decreasing trend, decreasing by 74.09 million ha, 46.59 million ha, and 6.26 million ha, respectively, in the NECBEC region during the period from 2001 to 2017.
Table 2 Conversion matrix of annual change of land cover type (area: million ha; %)
Land cover
type
Period Woodland Grassland Cropland Wetlands and water bodies Built-up land Other land
Woodland 2001-2005 - 17815.9 (97.75) 35.5 (0.19) 309.1 (1.70) 0.1 (0.00) 64.5 (0.35)
2005-2009 - 15187.7 (97.23) 25.0 (0.16) 202.2 (1.29) 0.2 (0.00) 205.8 (1.32)
2009-2013 - 18480.2 (98.07) 20.4 (0.11) 222.5 (1.18) 0.1 (0.00) 121.5 (0.64)
2013-2017 - 25081.0 (94.72) 22.3 (0.08) 1178.1 (4.45) 0.2 (0.00) 197.7 (0.75)
2001-2017 - 45012.2 (96.90) 88.1 (0.19) 1012.5 (2.18) 0.7 (0.00) 336.7 (0.72)
Grassland 2001-2005 15218.1 (68.86) - 4248.4 (19.22) 1336.1 (6.05) 43.2 (0.20) 1253.8 (5.67)
2005-2009 18370.5 (75.74) - 3385.5 (13.96) 1225.6 (5.05) 57.8 (0.24) 1215.6 (5.01)
2009-2013 17436.9 (73.95) - 3216.0 (13.64) 1242.4 (5.27) 57.0 (0.24) 1628.3 (6.91)
2013-2017 17360.6 (60.78) - 5207.7 (18.23) 4005.6 (14.02) 73.5 (0.26) 1916.7 (6.71)
2001-2017 36728.9 (69.72) - 9025.4 (17.13) 4102.0 (7.79) 186 (0.35) 2637.3 (5.01)
Cropland 2001-2005 34.5 (0.97) 3452.6 (97.61) - 5.8 (0.16) 43.4 (1.23) 1.0 (0.03)
2005-2009 38.1 (0.96) 3894.1 (97.86) - 5.6 (0.14) 38.8 (0.97) 2.8 (0.07)
2009-2013 46.1 (1.03) 4405.0 (97.93) - 3.8 (0.09) 34.1 (0.76) 9.2 (0.20)
2013-2017 53.6 (1.61) 3211.5 (96.62) - 23.8 (0.72) 31.5 (0.95) 3.3 (0.10)
2001-2017 201.1 (2.42) 7871.5 (94.55) - 48.4 (0.58) 190.4 (2.3) 13.6 (0.16)
Wetland and water bodies 2001-2005 1021.2 (25.36) 2833.6 (70.38) 1.0 (0.02) - 3.9 (0.10) 166.7 (4.14)
2005-2009 694.0 (22.59) 2190.2 (71.29) 1.4 (0.04) - 1.3 (0.04) 185.2 (6.03)
2009-2013 600.5 (19.16) 2382.5 (76.04) 1.1 (0.03) - 0.6 (0.02) 148.7 (4.74)
2013-2017 246.6 (13.96) 1271.4 (71.95) 1.0 (0.06) - 0.2 (0.01) 247.8 (14.02)
2001-2017 1639.5 (24.10) 4997.7 (73.45) 4.3 (0.06) - 8.6 (0.13) 154.0 (2.26)
Other land 2001-2005 176.6 (6.49) 2257.8 (83.02) 3.2 (0.12) 277.0 (10.19) 5.1 (0.19) -
2005-2009 99.0 (3.52) 2462.4 (87.67) 2.4 (0.09) 242.7 (8.64) 2.1 (0.07) -
2009-2013 226.5 (8.04) 2274.0 (80.74) 3.6 (0.13) 311.3 (11.05) 1.0 (0.04) -
2013-2017 137.8 (3.74) 2756.5 (74.85) 5.2 (0.14) 781.3 (21.21) 2.1 (0.06) -
2001-2017 471.2 (6.04) 6255.4 (80.19) 48.2 (0.62) 1015.2 (13.01) 10.3 (0.13) -

Notes: To the express format A(B), A and B are, respectively, the area and the percentage of the land cover type in the columns transformed to the land cover type in the rows in a certain period.

To better understand the trends in the land cover changes in the NECBEC region, the rates of change of area for all land cover types were calculated for the four periods of 2001-2005, 2005-2009, 2009-2013 and 2013-2017 (Table 2). The results for comparative analysis show that the spatial distribution of land cover change in the NECBEC region showed a distinctly different pattern between 2001-2013 and 2013-2017. Except for grassland, the intensity of change for every land cover type in 2013-2017 was more than that for any of the other three periods. The areas of cropland decreased in the two periods of 2005-2009 and 2009-2013, but increased in 2013-2017, especially in Montenegro. The areas of water bodies and wetlands showed a continuous decreasing trend from 2001-2013, while there was an increase, especially in Slovenia which had the highest rate of increase since 2013. The areas of built-up land all increased, especially in China, but the areas of other land all decreased during the four time periods. In general, the intensity of land cover change was the largest in 2013-2017, and the transformations of the land cover types showed a similar direction for the different types of land cover in the four time periods.

3.3 The dynamic probability of land cover change

The results (Table 3) of the STDP model for all land cover types, except built-up land, revealed the possibility of change during the four periods of 2001-2005, 2005-2009, 2009-2013 and 2013-2017; the STDP value for grassland was the largest on average, followed by woodland and then cropland.The annual area of water bodies and wetlands transformed was the least, but the STDP for the unchanged water bodies and wetlands was more than that for the other land cover types in 2001-2005. The STDP for the unchanged other land area was less than those for other land cover types during the four periods. Furthermore, the STDP values for cropland, and the water bodies and wetlands showed a decreasing trend during the three periods of 2001-2005, 2005-2009 and 2009-2013, the exception being 2013-2017, where there was an increase in area; in contrast, however, the respective areas that were possibly transformed showed an increasing trend in all periods. The STDP values for woodland, grassland and cropland in 2013-2017, in general, showed a decreasing trend, but the areas possibly transformed exhibited a rapidly increasing trend, which indicated their stability was reduced from 2013 to 2017.
Table 3 The possible transformed areas and the STDP values for a certain land cover type (area: million ha; STDP: %)
Period Woodland Grassland Cropland Wetlands and water
bodies
Other land
Possible transformed area STDP Possible transformed area STDP Possible transformed area STDP Possible transformed area STDP Possible transformed area STDP
2001-2005 1916.2 0.10 2803.04 0.11 390.26 0.10 179.82 0.14 245.39 0.04
2.81 0.15 5.82 0.16 0.41 0.14 1.07 0.20 2.03 0.07
8.40 0.21 14.85 0.21 3.68 0.21 0.79 0.27 1.55 0.09
Total area 1927.42 2823.71 394.34 181.68 248.96
2005-2009 1723.46 0.10 2546.42 0.11 437.34 0.09 230.51 0.12 198.98 0.05
0.92 0.16 2.62 0.17 0.16 0.14 2.84 0.18 2.13 0.07
8.84 0.21 13.74 0.22 2.86 0.19 1.00 0.24 1.19 0.10
Total area 1733.21 2562.78 440.36 234.38 202.29
2009-2013 1543.55 0.10 3217.59 0.11 547.54 0.09 265.27 0.12 213.29 0.05
1.09 0.16 3.05 0.17 1.25 0.14 3.36 0.18 1.45 0.08
8.89 0.21 13.72 0.22 9.32 0.19 1.36 0.24 0.79 0.09
Total area 1553.53 3234.35 558.11 277.32 215.53
2013-2017 4560.28 0.10 7336.49 0.10 956.84 0.08 473.89 0.15 884.55 0.05
4.82 0.15 11.22 0.15 0.76 0.12 5.55 0.23 10.1 0.08
29.49 0.19 43.04 0.20 10.7 0.16 3.30 0.30 4.34 0.10
Total area 4594.59 7412.22 968.29 482.73 898.98

3.4 Socio-economic development level in the countries of the NECBEC region

The integrated socio-economic development level and the level of spatiotemporal clustering (Table 4) were obtained from the calculation of the synthesis score index and the Moran’s index. The results show that the value of the global Moran’s index of socio-economic development exhibited a trend whereby from the year 2001 it increased at first and then decreased, thus indicating that the spatial difference of socio-economic development in the whole NECBEC region decreased first and then increased, and then continued to increase in those countries having a higher comprehensive economic development score. Although the economic development level of each country in the NECBEC region has clear spatiotemporal differences, there is no significant change in the location of the distribution of the high-high and low-low cluster zones, which are distributed in western Europe (Switzerland, Germany, the Netherlands, France, and Austria) and northern Central Asia (Uzbekistan, Kyrgyzstan, Turkmenistan, etc.), respectively. The rates of the integrated socio-economic development level in Turkmenistan, China, Azerbaijan and Romania were higher than for other countries along the NECBEC from 2001 to 2017; especially, in 2017 the economic development level for Turkmenistan was classified into a high-low cluster zone. However, the integrated socio-economic development level of Ukraine, Russia, Iran and Belarus has shown a slight downward trend since 2001.
Table 4 The socio-economic development and LISA cluster levels of different countries in the NECBEC region
Country Synthesis score of socio-economic development LISA cluster level
2001 2005 2009 2013 2017 2001 2005 2009 2013 2017
China -0.65 0.28 0.23 0.2 0.22 - - - - -
Russia 0.99 -0.32 -0.15 -0.04 0.19 - - - - -
Kyrgyzstan -1.41 -1.13 -1.23 -1.27 -1.16 L-L L-L L-L L-L L-L
Kazakhstan 0.04 -0.29 -0.27 -0.29 -0.21 - - - - -
Turkey 0.06 0.19 0.2 0.41 0.32 - - - - -
Turkmenistan -0.61 -1.09 -0.26 0.01 0.55 L-L L-L - - L-H
Iran 0.32 0.3 0.16 -0.02 -0.55 - - - - -
Uzbekistan -1.15 -1.33 -1.23 -1.21 -1.36 L-L L-L - - -
Belarus 0.44 -0.16 -0.21 -0.09 -0.19 - - - - -
Germany 0.88 0.99 0.95 0.89 0.88 H-H H-H H-H H-H H-H
The Netherlands 0.9 0.63 0.73 0.69 0.68 H-H H-H H-H H-H H-H
Poland 0.24 0.31 0.23 0.22 0.24 - - - - -
France 0.84 0.77 0.73 0.64 0.64 H-H H-H H-H H-H H-H
Slovakia 0.11 0.22 0.12 0.08 0.09 - - - - -
Austria 0.31 0.8 0.66 0.57 0.47 - H-H - - -
Hungary 0.38 0.21 0.18 0.24 0.23 - - - - -
Switzerland 0.79 1.13 1.23 1.27 1.15 H-H H-H H-H H-H H-H
Slovenia -0.12 0.53 0.24 0.22 0.19 - H-H - - -
Romania -0.4 -0.06 0.14 0.16 0.05 - - - - -
Serbia -0.4 -0.22 -0.47 -0.46 -0.36 - - - - -
Ukraine 0.31 -0.52 -0.64 -0.78 -0.73 - - - - -
Bosnia and Herzegovina -0.74 -0.06 -0.49 -0.6 -0.64 - - - - -
Croatia -0.13 0.29 0.08 0.08 0.05 - - - - -
Bulgaria 0.33 -0.19 -0.06 -0.07 0.04 - - - - -
Montenegro 0.04 -0.17 -0.19 -0.27 -0.22 - - - - -
Georgia -0.7 -0.29 -0.49 -0.56 -0.54 - - - - -
Azerbaijan -0.18 0.01 0.74 0.71 0.5 - - - - -
Mongolia -0.51 -0.81 -0.93 -0.73 -0.53 - - - - -

3.5 Effect of key socio-economic factors on land cover change

For explicating the effect of the key socio-economic factors on land cover change in the NECBEC region, the contribution coefficients of each factor to every land cover type were comupted by operating the K-means clustering and geodetector methods during the periods from 2001 to 2005, 2005 to 2009, 2009 to 2013, and 2013 to 2017 (Table 5). The results show that the impacts of most socio-economic factors on land cover change have, in general, shown an increasing trend in the NECBEC region since the beginning of the 21st century. The population density (V4), population of service industry (V5) and GDP unit energy use (V8) had a fluctuating influence on the change in cropland but overall a clear upward trend was revealed. The urban population (V2), value added from agriculture (V6) and value added from industry (V7) had a relatively weak impact on cropland change, of which the impact of V7 on cropland change was larger than that of V2 and V7. The GDP (V1) and traffic mileage (V3) had a significant impact on the change of built-up land which was larger than the effect of other variables. The impact on the change in woodland driven mainly by V3, V4, V5,V6 and V7 exhibited an increasing trend from 2001 to 2017, in which the impact of V4 on woodland was the largest which meant that the intensity of disturbance of V4 on the change in woodland was higher than those of the other impact variables operating in the NECBEC region. The impact of V8 on the change in grassland was higher than that of the other variables. Moreover, the impact on the water bodies and wetlands and other land change driven by the V1, V3 and V4 variables, in general, exhibited an increasing trend from 2001 to 2017, especially in the period from 2013 to 2017.
Table 5 Contribution coefficients of the different socioeconomic factors on land cover change
Land cover types Time interval V1 V2 V3 V4 V5 V6 V7 V8
Woodland 2001-2005 0.04 0.26 0.02 0.29 0.11 0.20 0.15 0.3
2005-2009 0.05 0.18 0.05 0.38 0.45 0.37 0.15 0.04
2009-2013 0.13 0.92 0.04 0.93 0.23 0.04 0.14 0.04
2013-2017 0.04 0.05 0.03 0.36 0.17 0.27 0.26 0.20
Grassland 2001-2005 0.09 0.28 0.06 0.02 0.07 0.08 0.24 0.23
2005-2009 0.01 0.19 0.02 0.01 0.12 0.14 0.21 0.39
2009-2013 0.49 0.11 0.50 0.08 0.16 0.11 0.10 0.09
2013-2017 0.06 0.14 0.06 0.03 0.08 0.05 0.26 0.27
Cropland 2001-2005 0.10 0.16 0.07 0.10 0.08 0.49 0.17 0.09
2005-2009 0.05 0.05 0.04 0.20 0.26 0.24 0.36 0.10
2009-2013 0.08 0.11 0.05 0.15 0.13 0.30 0.23 0.07
2013-2017 0.07 0.09 0.07 0.16 0.17 0.19 0.08 0.10
Wetlands and water bodies 2001-2005 0.01 0.06 0.04 0.10 0.11 0.16 0.15 0.20
2005-2009 0.01 0.08 0.02 0.06 0.07 0.20 0.18 0.10
2009-2013 0.06 0.05 0.05 0.09 0.15 0.11 0.16 0.14
2013-2017 0.06 0.15 0.05 0.21 0.17 0.14 0.07 0.15
Built-up land 2001-2005 1.00 0.22 1.00 0.09 0.22 0.09 0.31 0.05
2005-2009 1.00 0.21 1.00 0.09 0.21 0.09 0.30 0.05
2009-2013 1.00 0.08 1.00 0.08 0.09 0.06 0.48 0.08
2013-2017 0.99 0.05 1.00 0.08 0.06 0.08 0.09 0.08
Other land 2001-2005 0.12 0.09 0.03 0.16 0.20 0.13 0.10 0.31
2005-2009 0.07 0.16 0.07 0.18 0.40 0.19 0.31 0.13
2009-2013 0.11 0.04 0.05 0.18 0.06 0.18 0.11 0.05
2013-2017 0.01 0.31 0.02 0.07 0.06 0.11 0.04 0.07

4 Discussion

Due to the combined and synergistic effects of climate change and human activities, the dynamic pattern of land cover in the NECBEC region has clearly changed in the first two decades of the 21st century, especially since the start of the BRI in 2013 (Fan et al., 2020).

4.1 Impacts of climate change on land cover change

Changes in land cover play a key role in maintaining the human living environment and sustaining development (Fan et al., 2020), both of which are major indicators of global change on the Earth’s surface (Willis et al., 2018; Fan and Fan, 2019). Climate change, as an important aspect of global change (Yue et al., 2016), has caused a series of changes in the spatiotemporal distribution of vegetation (Scholze et al., 2006; Yue et al., 2006; Faour et al., 2018; Yue, 2020), which then leads to a corresponding series of land cover changes (Fan et al., 2020).
Due to the influence of increases in temperature and decreases in the mean precipitation (Faour et al., 2018; Fan et al., 2019), especially the increased frequency of extreme drought and precipitation events in the NECBEC region (Miao et al., 2015; Yue, 2016; Dyderski et al., 2018), the distributions of woodland, grassland, wetlands and water bodies, and other land, which are mainly affected by climate change and less disturbed by human activities (Fan and Fan, 2019; Fan et al., 2020), exhibited relatively different changing trends between 2001 and 2017. The areas of woodland decreased from 2001 to 2005, and increased from 2005 to 2009, and then decreased from 2009 to 2017, with an overall decrease of 0.14% per year. The areas of grassland increased from 2001 to 2005, and decreased from 2005 to 2009, and then increased from 2009 to 2017, with an average growth of 0.17% per year. The wetlands and water body areas decreased continuously from 2001 to 2013, and then increased from 2013 to 2017, and in general, decreased by 0.10% overall per year. The areas of other land showed a continuously decreasing trend with an overall decrease of 0.32% per year from 2001 to 2017, in which about 80% of this decrease in other land was transformed to grassland and being mainly distributed in the Loess Plateau and the Tibetan Plateau of China, and the Central Asia and Iran zones. The analysis results show that precipitation and the drought index were the key drivers of natural vegetation change (Hu and Hu, 2019) which directly affected the changes in the distribution of woodland, grassland, wetlands and water bodies, and other land; also, there were significant changes in the natural vegetation for areas experiencing extreme climates, with seasonal and spatial differences occurring (Song et al., 2018; Chen et al., 2019; Hu et al., 2019).

4.2 Effects of human activities on land cover change

With the advancement of new technologies, people’s ability to transform and shape the natural environment has been significantly enhanced, and various socio-economic development factors have gradually increased the effects on land cover change (Foley et al., 2005; Fan et al., 2015; Li et al., 2015). The analyzed results show that the impacts of most socio-economic factors on land cover change have generally resulted in an increasing trend in the NECBEC region since the start of the 21st century. The impacts on wetlands and water bodies, and other land changes associated with the GDP, railway traffic mileage and population density have shown an accelerating trend after 2013.
Moreover, as a result of the diverse interactions between human societies and new technologies, different major driving factors arise for different types of land cover changes (Liu et al., 2010). The socio-economic development level of each country in western Europe and the northern part of Central Asia did not show a significant change in the high-high cluster and low-low cluster zones during the period from 2001 to 2013, but in the context of globalization, especially with the implementation of the BRI, more and more international economic activities and investments (e.g., infrastructure, agriculture and tourism) have occurred in the NECBEC region (Liu et al., 2018; Hjalager, 2020; Lu et al., 2020), which has directly led to a series of land cover changes (Dong et al., 2017). The intensity of change for land cover types in the NECBEC region in the period from 2013 to 2017 was greater than for the other three periods, which is consistent with a gradual but significant impact of most socio-economic factors on land cover change (Zhang et al., 2018), especially for changes in built-up land and cropland.
Sustainable land management, targeted measures for alleviation of poverty and integrated urban/town development are key issues for the developing countries in the NECBEC region. Thus, with further deepening of cooperation among the BRI countries, maintaining sustainable use of limited land resources, preventing ecological degradation and reducing environmental pollution are the challenges that require more attention in the next cooperative framework of the BRI.

5 Conclusions

A STDP model and an integrated analysis model of the driving forces for land cover change have been developed in this study in an attempt to explicate the dynamic changes of land cover and the contribution coefficients of various socio-economic factors operating in the NECBEC region.
The areas of grassland, cropland and built-up land in the NECBEC region increased by 114.57 million ha, 8.41 million ha and 3.96 million ha between 2001 and 2017, respectively. The areas of woodland, other land, and water bodies and wetlands decreased by 74.09 million ha, 6.26 million ha, and 46.59 million ha, respectively. The grassland had the highest probability of transformation compared to the other land cover types, and the built-up land exhibited the largest annual increase rate due, in the main, to the transformation of cropland.
Compared with the periods before 2013, the trends for the annual change of cropland, woodland, built-up land, other land, and water bodies and wetlands increased between 2013 and 2017. The potential probabilities of change for the different land cover types were different in different periods, whereby the unchanged zone for grassland had the largest area of potential change. The potential stabilities of the water bodies and wetlands, and other land, in general, showed a decreasing trend, and those for woodland, grassland and cropland showed a slightly increasing trend. Moreover, there was a significant difference in the comprehensive level of socio-economic development in the countries along the NECBEC region, and an expansionary trend was seen in those countries with higher comprehensive economic development scores, whereby the high-high and low-low cluster zones were distributed in western Europe and northern Central Asia, respectively.
Under the influence of climate change, especially the increased frequency of extreme drought and precipitation events, the areas of other land showed a continuously decreasing trend with an overall decrease of 0.32% per year from 2001 to 2017. The impacts of most socio-economic factors on land cover change have generally shown an increasing trend in the NECBEC region since the start of the 21st century. With initiation of the BRI project in 2013, the intensity of land cover change has generally exhibited an accelerating trend, especially with respect to changes in built-up land and cropland. Thus, in the future, compared to climate change, more attention needs to be paid to the impacts of the BRI, and other economic factors relevant to land cover change, on land resources mangement and planning in those countries along the NECBEC region.
[1]
Alkama R, Cescatti A, 2016. Climate change: Biophysical climate impacts of recent changes in global forest cover. Science, 351(6273): 600-604.

DOI

[2]
Blois J L, Zarnetske P L, Fitzpatrick M C et al., 2013. Climate change and the past, present, and future of biotic interactions. Science, 341(6145): 499-504.

DOI

[3]
Chen C, Park T, Wang X et al., 2019. China and India lead in greening of the world through land-use management. Nature Sustainability, 2(2): 122-129.

DOI PMID

[4]
Dan W, Wei H, Shuwen Z et al., 2015. Processes and prediction of land use/land cover changes (LUCC) driven by farm construction: The case of Naoli River Basin in Sanjiang Plain. Environmental Earth Sciences, 73(8): 4841-4851.

DOI

[5]
Deng Y H, Wang S J, Bai X Y et al., 2018. Relationship among land surface temperature and LUCC, NDVI in typical karst area. Scientific Reports, 8(1).

[6]
Dong S C, Kolosov V, Yu L et al., 2017. Green development modes of the belt and road. Geography, Environment, Sustainability, 10(1): 53-69.

DOI

[7]
Dyderski M K, Paź S, Frelich L E et al., 2018. How much does climate change threaten European forest tree species distributions? Global Change Biology, 24(3): 1150-1163.

DOI PMID

[8]
Fan Z M, Bai R Y, Yue T X, 2020. Scenarios of land cover in Eurasia under climate change. Journal of Geographical Sciences, 30(1): 3-17.

DOI

[9]
Fan Z M, Fan B, 2019. Shifts of the mean centers of potential vegetation ecosystems under future climate change in Eurasia. Forests, 10(10): 873.

DOI

[10]
Fan Z M, Fan B, Yue T X, 2019. Terrestrial ecosystem scenarios and their response to climate change in Eurasia. Science China Earth Sciences, 62(10): 1607-1618.

DOI

[11]
Fan Z M, Li J, Yue T X et al., 2015. Scenarios of land cover in karst area of southwestern China. Environmental Earth Sciences, 74(8): 6407-6420.

DOI

[12]
Fan Z M, Li S B, 2019. Change pattern of land cover and its driving force since 2001 in the New Eurasian Continental Bridge Economic Corridor. Acta Ecologica Sinica, 39(14): 5015-5027. (in Chinese)

[13]
Fan Z M, Zhang X, Li J et al., 2013. Land-cover changes of national nature reserves in China. Journal of Geographical Sciences, 23(2): 258-270.

DOI

[14]
Faour G, Mhawej M, Nasrallah A, 2018. Global trends analysis of the main vegetation types throughout the past four decades. Applied Geography, 97: 184-195.

DOI

[15]
Foley J A, DeFries R, Asner G P et al., 2005. Global consequences of land use. Science, 309(5734): 570-574.

DOI

[16]
Hasselmann F, Csaplovics E, Falconer I et al., 2010. Technological driving forces of LUCC: Conceptualization, quantification, and the example of urban power distribution networks. Land Use Policy, 27(2): 628-637.

DOI

[17]
He C, Zhao Y, Huang Q et al., 2015. Alternative future analysis for assessing the potential impact of climate change on urban landscape dynamics. Science of the Total Environment, 532: 48-60.

DOI

[18]
Hjalager A M, 2020. Land-use conflicts in coastal tourism and the quest for governance innovations. Land Use Policy, 94: 104566.

DOI

[19]
Hopping K A, Knapp A K, Dorji T et al., 2018. Warming and land use change concurrently erode ecosystem services in Tibet. Global Change Biology, 24(11): 5534-5548.

DOI PMID

[20]
Hu X, Huang B, Cherubini F, 2019. Impacts of idealized land cover changes on climate extremes in Europe. Ecological Indicators, 104: 626-635.

DOI

[21]
Hu Y, Hu Y, 2019. Land cover changes and their driving mechanisms in Central Asia from 2001 to 2017 supported by Google Earth Engine. Remote Sensing, 11(5): 554.

DOI

[22]
Igbinoba E, 2017. Empirical Assessment of Trade Engagements: Africa, China and the Maritime Belt and Road Initiative. Social Science Electronic Publishing, 17-23.

[23]
Jackson R B, Banner J L, Jobbágy E G et al., 2002. Ecosystem carbon loss with woody plant invasion of grasslands. Nature, 418(6898): 623-626.

DOI

[24]
Karrar H H, 2016. The resumption of Sino-Central Asian trade, c. 1983-94: Confidence building and reform along a Cold War fault line. Central Asian Survey, 35(3): 334-350.

DOI

[25]
Kuang W, Liu J, Dong J et al., 2016. The rapid and massive urban and industrial land expansions in China between 1990 and 2010: A CLUD-based analysis of their trajectories, patterns, and drivers. Landscape and Urban Planning, 145: 21-33.

DOI

[26]
Lai L, Huang X, Yang H et al., 2016. Carbon emissions from land-use change and management in China between 1990 and 2010. Science Advances, 2(11): e1601063.

DOI

[27]
Lambin E F, Turner B L, Geist H J et al., 2001. The causes of land-use and land-cover change: Moving beyond the myths. Global Environmental Change, 11(4): 261-269.

DOI

[28]
Lawler J J, Lewis D J, Nelson E et al., 2014. Projected land-use change impacts on ecosystem services in the United States. Proceedings of the National Academy of Sciences, 111(20): 7492-7497.

DOI

[29]
Li P, Qian H, Howard K W F et al., 2015. Building a new and sustainable “Silk Road Economic Belt”. Environmental Earth Sciences, 74(10): 7267-7270.

DOI

[30]
Liu J, Zhang Z, Xu X et al., 2010. Spatial patterns and driving forces of land use change in China during the early 21st century. Journal of Geographical Sciences, 20(4): 483-494.

DOI

[31]
Liu Z, Wang T, Sonn J W et al., 2018. The structure and evolution of trade relations between countries along the Belt and Road. Journal of Geographical Sciences, 28(9): 1233-1248.

DOI

[32]
Lu X, Li Y, Ke S, 2020. Spatial distribution pattern and its optimization strategy of China’s overseas farmland investments. Land Use Policy, 91: 104355.

DOI

[33]
Luo K, Tao F, Moiwo J P et al., 2016. Attribution of hydrological change in Heihe River Basin to climate and land use change in the past three decades. Scientific Reports, 6(1): 1-12.

DOI

[34]
Meneses B M, Reis R, Vale M J et al., 2015. Land use and land cover changes in Zêzere watershed (Portugal): Water quality implications. Science of the Total Environment, 527: 439-447.

[35]
Miao L, Liu Q, Fraser R et al., 2015. Shifts in vegetation growth in response to multiple factors on the Mongolian Plateau from 1982 to 2011. Physics and Chemistry of the Earth, Parts A/B/C, 87: 50-59.

[36]
Moran P A P, 1950. Notes on continuous stochastic phenomena. Biometrika, 37(1/2): 17-23.

DOI

[37]
Quintero-Gallego M E, Quintero-Angel M, Vila-Ortega J J, 2018. Exploring land use/land cover change and drivers in Andean Mountains in Colombia: A case in rural Quindío. Science of The Total Environment, 634: 1288-1299.

DOI

[38]
Ray W D, Abraham B, Ledolter J, 1984. Statistical methods for forecasting. Journal of the Royal Statistical Society. Series A (General), 69: 243-268.

[39]
Scharsich V, Mtata K, Hauhs M et al., 2017. Analysing land cover and land use change in the Matobo National Park and surroundings in Zimbabwe. Remote Sensing of Environment, 194: 278-286.

DOI

[40]
Scholze M, Knorr W, Arnell N W et al., 2006. A climate-change risk analysis for world ecosystems. Proceedings of the National Academy of Sciences, 103(35): 13116-13120.

DOI

[41]
Shkaruba A, Kireyeu V, Likhacheva O, 2017. Rural-urban peripheries under socioeconomic transitions: Changing planning contexts, lasting legacies, and growing pressure. Landscape and Urban Planning, 165: 244-255.

DOI

[42]
Sinha P, Mann M E, Fuentes J D et al., 2018. Downscaled rainfall projections in south Florida using self-organizing maps. Science of the Total Environment, 635: 1110-1123.

DOI

[43]
Song X P, Hansen M C, Stehman S V et al., 2018. Global land change from 1982 to 2016. Nature, 560(7720): 639-643.

DOI

[44]
Turner B L, Lambin E F, Reenberg A, 2007. The emergence of land change science for global environmental change and sustainability. Proceedings of the National Academy of Sciences, 104(52): 20666-20671.

DOI

[45]
Wang J F, Li X H, Christakos G et al., 2010. Geographical detectors-based health risk assessment and its application in the neural tube defects study of the Heshun Region, China. International Journal of Geographical Information Science, 24(1): 107-127.

DOI

[46]
Wang J F, Zhang T L, Fu B J, 2016. A measure of spatial stratified heterogeneity. Ecological Indicators, 67: 250-256.

DOI

[47]
Wen X, Ma H L, Choi T M et al., 2019. Impacts of the Belt and Road Initiative on the China-Europe trading route selections. Transportation Research Part E: Logistics and Transportation Review, 122: 581-604.

DOI

[48]
Willis K J, Jeffers E S, Tovar C, 2018. What makes a terrestrial ecosystem resilient? Science, 359(6379): 988-989.

DOI PMID

[49]
Yalew S G, Pilz T, Schweitzer C et al., 2018. Coupling land-use change and hydrologic models for quantification of catchment ecosystem services. Environmental Modelling & Software, 109: 315-328.

[50]
Yue T X, Fan Z M, Liu J Y et al., 2006. Scenarios of major terrestrial ecosystems in China. Ecological Modelling, 199(3): 363-376.

DOI

[51]
Yue T X, Zhao N, Fan Z M et al., 2016. CMIP5 downscaling and its uncertainty in China. Global and Planetary Change, 146: 30-37.

DOI

[52]
Yue T, Zhao N, Liu Y et al., 2020. A fundamental theorem for eco-environmental surface modelling and its applications. Science China Earth Sciences, 63(8): 1092-1112.

DOI

[53]
Yue W Z, Qiu S S, Xu H et al., 2019. Polycentric urban development and urban thermal environment: A case of Hangzhou, China. Landscape and Urban Planning, 189: 58-70.

DOI

[54]
Zeng Z, Estes L, Ziegler A D et al., 2018. Highland cropland expansion and forest loss in Southeast Asia in the twenty-first century. Nature Geoscience, 11(8): 556-562.

DOI

[55]
Zhang Y, Zhang J H, Tian Q et al., 2018. Virtual water trade of agricultural products: A new perspective to explore the Belt and Road. Science of the Total Environment, 622: 988-996.

[56]
Zhao P J, 2016. Planning for social inclusion: The impact of socioeconomic inequities on the informal development of farmland in suburban Beijing. Land Use Policy, 57: 431-443.

DOI

Outlines

/