Research Articles

Spatio-temporal analysis of cropland change in the Guanzhong area, China, from 1650 to 2016

  • WEI Xueqiong , 1 ,
  • LI Yuanfang 1 ,
  • GUO Yu 1 ,
  • CHEN Tiexi 1 ,
  • LI Beibei 2
Expand
  • 1. School of Geographical Sciences, Nanjing University of Information Science and Technology, Nanjing 210044, China
  • 2. Research Institute for History of Science and Technology, Nanjing University of Information Science and Technology, Nanjing 210044, China

Wei Xueqiong, PhD, specialized in historical land cover reconstruction. E-mail:

Received date: 2020-09-30

  Accepted date: 2021-03-17

  Online published: 2021-11-25

Supported by

National Natural Science Foundation of China(41807433)

National Natural Science Foundation of China(41972193)

Basic Research Program (Natural Science Foundation) of Jiangsu Province(BK20180804)

Jiangsu Students’ Platform for Innovation and Entrepreneurship Training Program(201910300074Y)

Copyright

Copyright reserved © 2021. Office of Journal of Geographical Sciences All articles published represent the opinions of the authors, and do not reflect the official policy of the Chinese Medical Association or the Editorial Board, unless this is clearly specified.

Abstract

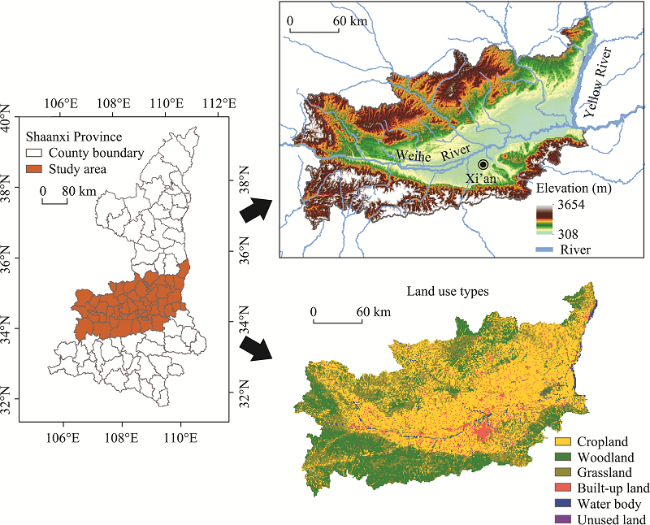
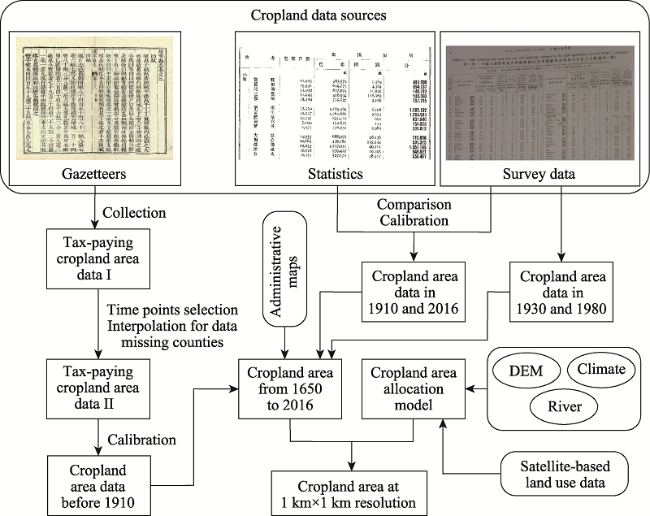
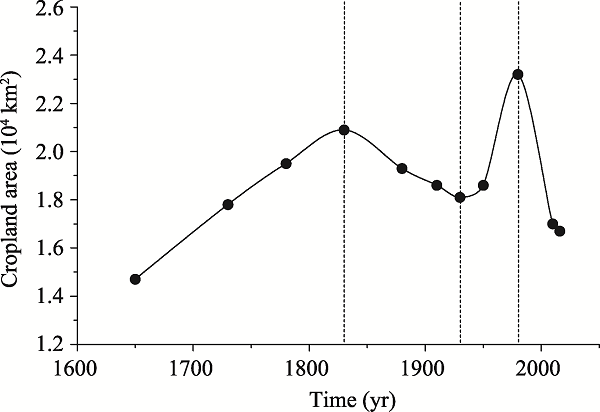
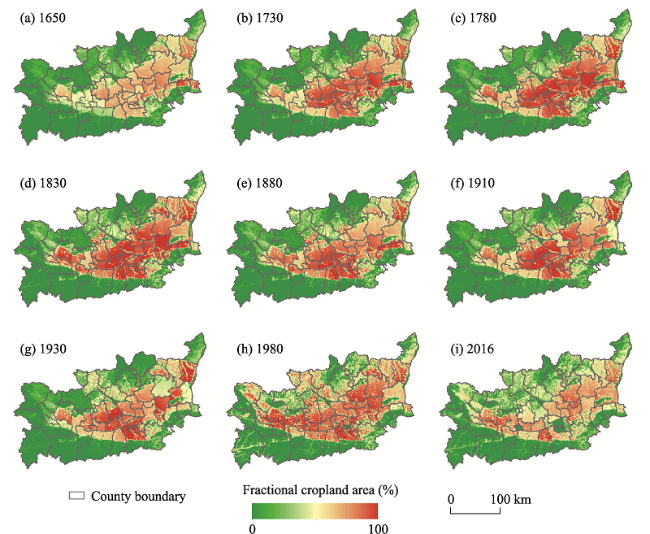
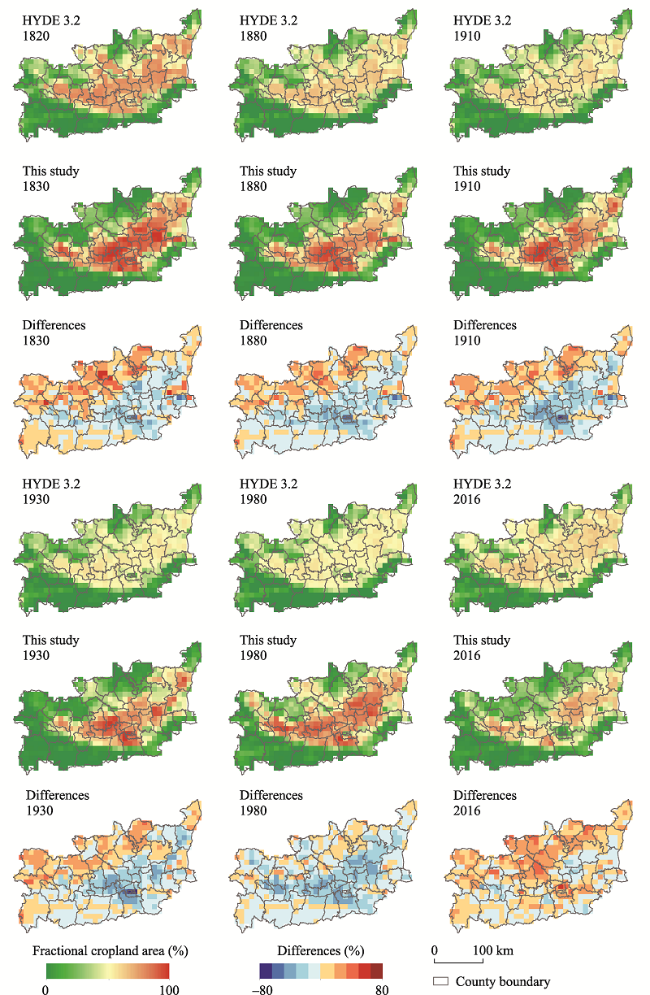
As one of the most critical impact factors of global change, historical land-use change is an indispensable input in climate and environment simulations. To better understand the cropland change in the Guanzhong area, gazetteers, statistics, and survey data were collected as data sources. Methods of registered tax-paying cropland data collection, selection of time points, and data interpolation and calibration were used to reconstruct changes in the cropland area. The cropland area data at the county level were allocated to 1 km×1 km grid cells. The total cropland area in the Guanzhong area was influenced by changes in population, wars, natural disasters, and land-use types, and it fluctuated from 1650 to 2016. From 1780 to 1830, the cropland expanded in the northern and western parts of Guanzhong area, and the cropland in the north of Qinling Mountains increased slightly. The spatial pattern of cropland reached its maximum range in 1980, and the cropland area declined in the whole study area, especially in the cities of Xi’an and Xianyang in 2016. The comparison between HYDE 3.2 and the data obtained in this study showed that the grid cells of HYDE 3.2 exhibit lower values of cropland area fractions in the Guanzhong Basin and higher values in high-altitude areas around the Guanzhong Basin as compared to those in this study.

Cite this article

WEI Xueqiong , LI Yuanfang , GUO Yu , CHEN Tiexi , LI Beibei . Spatio-temporal analysis of cropland change in the Guanzhong area, China, from 1650 to 2016[J]. Journal of Geographical Sciences, 2021 , 31(9) : 1381 -1400 . DOI: 10.1007/s11442-021-1902-4

1 Introduction

Since land-use practices are essential to feed the world, the accelerated population growth has led to the intensification of land-use activities over the past several centuries (Foley et al., 2005). Thusfar, land use has affected approximately 75% of the global ice-free land surface (Arneth et al., 2019). This large-scale change in land cover results in global, regional, and local adaptations of biogeochemical and biophysical processes (Hoesly et al., 2018; Houghton, 2018; Pongratz et al., 2009a; Tian et al., 2019). Land-use change is one of the most critical impact factors of global change (Klein Goldewijk et al., 2017). To study the effects of human land use on future climate and environmental change, many models have been developed, such as bookkeeping models, dynamic global vegetation models (DGVMs), and earth system models (ESMs). All those models require high-resolution gridded historical land-use data (Houghton, 2003; Hazeleger et al., 2010; Pongratz et al., 2014; Friedlingstein et al., 2019). The global historical land-use datasets have always been the most widely used input data for the models because they have high spatiotemporal resolutions and cover a long temporal range (Ramankutty and Foley, 1999, 2010; Pongratz et al., 2009b; Kaplan et al., 2010; Klein Goldewijk et al., 2011, 2017; Brovkin et al., 2013; Findell et al., 2017; Gilgen et al., 2019; Ellis et al., 2020). However, the global datasets vary greatly, especially in some regions, owing to the different input parameters and empirical models used (Zhang et al., 2013; Gilgen et al., 2019; Li et al., 2019a). Uncertainties of global datasets arise owing to the assumptions about per-capita land use, variations in historical population data, and spatial land-use allocation schemes (Klein Goldewijk et al., 2017; Harrison et al., 2020). If the outputs of ESM simulations based on global datasets are used as input to impact models, these uncertainties can propagate to projected impacts (Arneth et al., 2019).
Regional land-use reconstructions using archaeological, historical, and paleo-vegetation information could effectively reduce uncertainties in global historical land-use datasets (Klein Goldewijk and Verburg, 2013; Harrison et al., 2020). The PAGES LandCover6k Working Group aims to evaluate and improve scenarios of anthropogenic land cover change with the combined information from local to global scales (Gaillard and LandCover6k Interim Steering Group members, 2015; Gaillard et al., 2018). Compared to that of HYDE 3.1, the accuracy of HYDE 3.2 has been dramatically improved because specific sub-national land use data were taken for some large countries (Klein Goldewijk et al., 2017; Li et al., 2019a). Because HYDE 3.2 used new and improved historical population and land-use data, Anthromes 12K, which is based on HYDE 3.2, is significantly better than Anthromes 2.0, which uses HYDE 3.1, especially in the periods before 1990 (Ellis et al., 2020). Thus, more regional historical land-use datasets derived from historical or natural records are essential for quantitative credibility assessments of historical global land-use data (Fang et al., 2020), especially for regions affected by unique natural and social factors in history.
Historical reconstructions of cropland in China are more abundant than those of other land cover types owing to the availability of historical records and the relationship between cropland area and population. Several national-scale gridded cropland datasets have been developed in China over the past 300 years (Yang et al., 2015; Li et al., 2016). However, uncertainties remain in some provinces and areas. The lack of more detailed sub-provincial cropland data and the downscale methods used for obtaining gridded data based on cropland data at the provincial level caused uncertainties. These uncertainties have been reduced by several provincial-scale reconstructions based on historical cropland records at the county level (Li et al., 2010; Wei et al., 2019). Currently, datasets based on historical cropland area at the county level are available in some typical areas (Ryavec, 2001; Ye and Fang, 2009, 2012; Li et al., 2010; Li et al., 2011; Luo et al., 2014; Zhang et al., 2015; Li et al., 2019b; Wei et al., 2019). However, the existing high-resolution cropland dataset for the ecologically fragile Loess Plateau is still based on the global dataset (Tian et al., 2012), and its accuracy needs to be improved.
The Guanzhong area, which belongs to the Loess Plateau, is one of the main agricultural areas with the longest history in China. In the Ming and Qing dynasties, the largest cropland area once reached more than 2×10⁴ km2 (EDCAE, 1995). Thus, after the Ming Dynasty, the factors affecting the change of cropland in the Guanzhong area were no longer population changes but disasters, wars, and policies. In contrast to other typical areas, the Guanzhong area exhibits a unique process of cropland change. In this study, we aimed to reconstruct the cropland area change over the past 300 years and analyze the spatio-temporal cropland changes in the Guanzhong area. The results can provide spatially explicit data on cropland changes in the Guanzhong area at key time points for global research on cropland change.

2 Data sources and methods

2.1 Study area

The Guanzhong area is located in the middle of Shaanxi Province, ranging from 34°31′-35°35′N to 106°36′-110°32′E (Figure 1). It has a maximum height of 3654 m in its southwest and a minimum height of 308 m on the plain. The Weihe River runs through the Guanzhong area from west to east and converges into the Yellow River. The Guanzhong area is formed mainly by river alluvium and loess accumulation. The annual average temperature ranges from 6℃ to 13℃, and the annual precipitation is between 500 mm and 800 mm. With its flat terrain, mild climate, fertile soil, and abundant water resources, Guanzhong is the most conducive area for machinery farming and irrigation in Shaanxi. As an important grain producing area in Shaanxi Province, the cropland in the Guanzhong area currently accounts for more than 30% of the land area. The extensive croplands are mainly found in the Guanzhong Basin, located in the central and eastern parts of the Guanzhong area. The Guanzhong Basin primarily consists of plains and loess tablelands. Woodland and grassland are mostly found in the high-altitude areas around croplands, including the west, southwest, and north of the study area (Liu et al., 2010).
Figure 1 Geographical location and land-use types of the Guanzhong area
From the Qing Dynasty (1644-1911) to the present era, the administrative boundaries have been changed several times. In the Qing Dynasty, the study area was included in six prefectures (Xi’an, Fengxiang, Tongzhou, Qianzhou, Binzhou, and Fuzhou). By 1911, the Guanzhong area was governed by a higher administrative unit, called Guanzhong dao. After 1949, the names and jurisdictions of the prefecture-level administrative units in the Guanzhong area changed significantly. The boundaries of counties did not change significantly, but there were cancellations, mergers, and renaming of counties (Fu and Zheng, 2007; Fu et al., 2013).

2.2 Data sources

2.2.1 Cropland data
The cropland data sources represented three periods: the Qing Dynasty (1644-1911), the Republic of China (1911-1949), and after 1949, covering the period from 1650-2016. Most data sources provide cropland data at the county level (Table 1).
Table 1 Cropland data sources used in this study
Data source Time of data Spatial resolution Reference
Gazetteers 1644-1911 County National Digital Library of China (http://www.nlc.gov.cn/); Collection of Chinese Gazetteers (Phoenix Publishing House, 2007); Series of Chinese Gazetteers (Cheng Wen Publishing, 1966)
Statistics ~1916 County The Fifth Agricultural and Commercial Statistics Table (Ministry of Agriculture and Commerce, 1919)
Survey data ~1933 County Land Utilization in China (Buck, 1941)
Statistics and survey data ~1980s County Summary of Rural Economic Statistics by County in China (National Bureau of Statistics, 1989); Datasets of Land and Resources of China (Commission for Integrated Survey of Natural Resources, the Chinese Academy of Sciences and State Planning Commission, 1989)
Statistics and survey data ~2016 County; municipality Chinese Statistical Yearbooks; The Second National Land Survey
Cropland data in the Qing Dynasty were obtained from gazetteers. Based on the book A General Catalogue of Gazetteers in China (BAOCAS, 1985), there are approximately 198 volumes of gazetteers on the Guanzhong area from 1644 to 1949. We collected 161 volumes of gazetteers from the National Digital Library of China (http://www.nlc.gov.cn/) as well as the books Collection of Chinese Gazetteers (PPH, 2007) and Series of Chinese Gazetteers (CWP, 1966), including county, prefectural, and provincial gazetteers. Since the records of the gazetteers in the Republic of China were mostly the continuation of those in the Qing Dynasty, the Republic of China’s gazetteers were also essential sources of cropland data in the Qing Dynasty. Gazetteers recorded tax-paying cropland data and tax revenue before the year of publication, which was vital information about the cropland area of each county. Gazetteers of different levels of administrative units had different ways of recording tax-paying cropland data. County gazetteers recorded the size of various tax-paying cropland types and their changes over time. Prefectural and provincial gazetteers mostly summarized county gazetteers’ records and only roughly recorded each county or prefecture’s total tax-paying cropland area.
For the period of the Republic of China, cropland data were obtained from two sources. The book The Fifth Agriculture and Commerce Statistics Table (MAC, 1919) recorded the number of peasant households and gardens, planting area of crops, amount of cropland area, abandoned cropland area, and cropland area affected by disasters in each county. The cropland area data collected from this book are statistics. Another source is survey data from the book of Land Utilization in China (Buck, 1937). Funded by the Institution of Pacific Relations, Buck investigated the land use of China from 1929 to 1933 and published this book based on the investigation of land area, cropland area, planting area, etc. Compared with statistics from The Fifth Agriculture and Commerce Statistics Table, Buck’s survey data on cropland are more scientific and closer to each county’s “real value”.
For the period after 1949, we collected both statistics and survey data around the 1980s and 2016. In the 1980s, statistics and survey data were sourced from Summary of Rural Economic Statistics by County in China (NBS, 1989) and Datasets of Land and Resources of China (CISNR, 1989), respectively. The statistics for 2016 were obtained from the Chinese Statistical Yearbooks (https://data.cnki.net/Yearbook/) of each prefecture in the Guanzhong area. Survey data in 2010 and 2016 were acquired from The Second National Land Survey (http://tddc.mnr.gov.cn/). We also used the total cropland area of the Guanzhong area around 1950 from the study of Liu (2015) and the data in 2010 to analyze the temporal changes in the total cropland area.
2.2.2 Administrative boundaries
The digital administrative division maps were obtained from three sources. The administrative division map at the county level in 1911 was obtained from The China Historical Geographic Information System (CHGIS; http://yugong.fudan.edu.cn), whereas those in 1980 and 2015 were sourced from the National Earth System Science Data Center (http://www.geodata.cn/) and National Catalogue Service for Geographic Information (http://www.webmap.cn/main.do?method=index), respectively.
2.2.3 Geographical conditions
We also used spatial data of land use, digital elevation model (DEM), climate, and river. The satellite-based land-use data in 1980 and 2000 and the climatic potential productivity value were provided by the National Earth System Science Data Center (http://www.geodata.cn/). The 1 km×1 km DEM used in this study was from the Resource and Environment Data Cloud Platform (http://www.resdc.cn/). The digital river data in 1820 was obtained from CHGIS.

2.3 Methods

The outline of the relationship between different cropland data sources and the methods for the reconstruction of cropland area change from 1650 to 2016 in the Guanzhong area is summarized in Figure 2. Based on gazetteers, we used methods of registered tax-paying cropland data collection, time points selection, missing data interpolation, and data calibration to obtain each county’s cropland area before 1910. The cropland area from statistics was compared with survey data and calibrated. Then, the cropland area data with a uniform measurement standard at the county level was produced. The main factors (altitude, slope, climate, and rivers) affecting the spatial distribution of cropland were selected, and cropland area data at the county level were allocated to 1 km×1 km grid cells.
Figure 2 Flowchart for cropland change reconstruction in the Guanzhong area from 1650 to 2016
2.3.1 Registered cropland data collection
In the Qing Dynasty, the Manchu government divided cropland into multiple forms for taxation. Different forms of tax-paying land paid different amounts of tax per unit area. There were four common forms of registered tax-paying land in the gazetteers in the Guanzhong area, including civilian (Min Di), soldier-cultivated (Tun Di), renamed (Gengming Di), and education (Xue Tian) lands. Civilian land referred to tax-paying land cultivated by private civilians. In the Ming Dynasty (1368-1644), the government established military departments (Wei/Suo) and provided them some land for cultivation to supply food for local troops, which was called soldier-cultivated land. In the early Qing Dynasty, several military departments were disbanded. Their soldier-cultivated land was changed to tax-paying land and allocated to private civilians. Renamed land was owned by royal family members and officials in the Ming Dynasty. At the beginning of the Qing Dynasty, Manchu warriors overthrew the Ming Dynasty, and the government gave renamed land to private civilians to cultivate free of charge. Still, civilians paid taxes after gaining income from farming. Education land was used for supporting schools, but it was cultivated by civilians who rent it. These four common forms of registered tax-paying land were cropland. Thus, their areas were all included in the total cropland area of each county.
There were many records about the change in the administrative ownership of the soldier-cultivated land in gazetteers. Regarding the soldier-cultivated land that was put under the administration of other counties, it was not included in the county’s total cropland area calculation. The abandoned land area was also not included in the total cropland area because no crop was grown on the forsaken land, and it was exempt from taxes. After the step of registered cropland data collection, we collected 431 records related to tax-paying cropland area data from gazetteers in the Guanzhong area, covering 46 counties in the Qing Dynasty. The data sources in the Republic of China and after 1949 were statistical and survey data, which recorded the cropland area in tables. Therefore, the total cropland area of each county was collected directly.
2.3.2 Time points selection and data interpolation
Because not all counties have collected tax-paying cropland data each year in the Qing Dynasty, we selected several years when there were enough counties with tax-paying cropland data as time points for studying cropland change in the Guanzhong area. Figure 3 shows the number of counties that had tax-paying cropland data from 1644 to 1911. Specifically, 17 (37%), 41 (89%), 10 (22%), 18 (39%), and 46 (100%) of the 46 counties had tax-paying cropland data in 1650, 1734, 1741, 1779, and 1827, respectively. In other years, the number of counties that had tax-paying cropland data was below 10. Thus, we selected 1650, 1730, 1780, and 1830 as four time points and chose the tax-paying cropland data of the neighboring 15 years to supplement the data in 1650, 1730, and 1780. Augmented by the data in the neighboring years, 36, 42, and 37 counties with tax-paying cropland data were available in 1650, 1730, and 1780, respectively. The missing data were interpolated using the data in neighboring time points and correlations of tax-paying data in each time point.
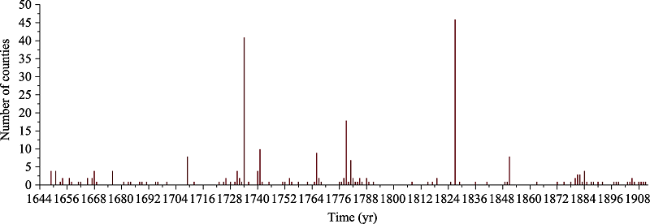
Figure 3 The number of counties with available tax-paying cropland data from 1644 to 1911
At the beginning of the reign of Guangxu (1877-1878), a severe drought (Dingwu Disaster) hit the Yellow River basin in China, which lasted for 3-4 years and caused a considerable reduction in the cropland area. Shaanxi Province was one of the disaster-stricken centers. Many gazetteers recorded the effect of the severe drought on the cropland area in the Guanzhong area. Therefore, to quantitatively analyze the effect of the severe drought in the Guanzhong area on cropland area, it is necessary to select a time point at approximately 1877-1878. Around 1880, 15 out of 46 counties (33%) had tax-paying cropland data. Gazetteers recorded that the proportion of abandoned cropland in northwestern Guanzhong area was approximately 6%-20%, whereas it was approximately 0.41%-0.94% southeastern and 0.14%-3.6% in the central plain area from 1830 to 1880. Based on the research of Zhang (2018), the abandoned cropland recorded in gazetteers of the reign of Guangxu may include the cropland that was abandoned in the early Qing Dynasty. Moreover, Shaanxi Province was not seriously affected by the drought (Xia, 1992). We assumed that neighboring counties had the same proportion of abandoned cropland caused by the disaster. Then, we interpolated the missing tax-paying cropland data in 1880 based on the ratio of abandoned cropland areas in their neighboring counties.
Based on the collected cropland area data in each county in the Republic of China and after 1949, we selected 1910, 1930, 1980 and 2016 as time points. No missing data were interpolated from 1910 to 2016.
2.3.3 Data calibration
The conventional Chinese land-assessment principles are very complicated. The registered tax-paying cropland area data in the Ming and Qing dynasties were very different from the real cropland area (Ho, 1959). The area unit of mu used in tax-paying cropland registration is not a land area unit in modern times, but a land tax unit. The tax-paying cropland area data recorded in gazetteers are also affected by land assessment principles and land tax units. Since the tax-paying cropland area data recorded in gazetteers were obtained based on the real cropland area, they will be closer to the real cropland area after analysis and calibration. In previous studies, main factors such as various definitions of mu, discount of mu, land tax quotas, unregistered land, and exaggerating phenomenon were considered to calibrate the collected tax-paying cropland data from gazetteer (Wei et al., 2015; Ye et al., 2009). These factors led to the difference between the registered tax-paying cropland area data and the real cropland area. We calibrated our collected tax-paying cropland data based on the characteristics of the registered cropland area and the trend of cropland area change in the Guanzhong area (He et al., 2003).
There was no description of the unit of cropland area in gazetteers in the Guanzhong area. Qǐng, mǔ, and fēn were three units for tax-paying cropland recorded in gazetteers, with 1 qǐng = 10 mǔ = 100 fēn. However, the definition of mǔ in gazetteers (Qing mǔ) is different from that in the present day (Modern mǔ). The relationship between them is 1 Qing mǔ ≈ 0.9216 modern mǔ = 0.9216/1500 km2. As there were no different definitions about the Qing mǔ in different counties, we converted the unit of tax-paying cropland area from Qing mǔ to km2. The gazetteers in the Guanzhong area recorded discounts of mu for civilian land in 12 counties. We found ways of converting the true mu to tax-paying mu in three counties, i.e., Hancheng, Xianyang, and Yijun. After analysis and calculations, the discount rates of mu for civilian land in Hancheng, Xianyang, and Yijun counties were determined as 1.11, 1.01, and 2.76, respectively. We used them to convert the collected tax-paying mu to true mu. For the nine counties without any record about the ways of mu converting, we calibrated the tax-paying mu based on the conversion rate in their neighboring counties, statistics, and survey data in the Republic of China in corresponding counties.
In the early Qing Dynasty, affected by the Manchu war, approximately half of its cropland was abandoned (Peng, 1990). Records of the gazetteers in the Guanzhong area showed that the rate of cropland abandonment in the early Qing Dynasty reached approximately 30%. Since there was no policy to encourage reclamation before 1650, phenomena of concealment and exaggeration in tax-paying cropland registration were not apparent. Land tax quota delayed the growth of registered tax-paying cropland areas in the Qing Dynasty, especially in 1730-1830. However, the study of He et al. (2003) showed that in the period of agricultural restoration, which was from the tenth year of the Shunzhi reign (1653) to the sixth year of the Qianlong reign (1741), all the abandoned cropland in the early Qing Dynasty had been reclaimed. After that, from the sixth year of the Qianlong reign (1741) to the reigns of Daoguang and Xianfeng (1820-1861), the cropland expanded in high-altitude areas. The total cropland area around 1820-1861 should be larger than the land tax quota in the late Ming Dynasty. Thus, we used calibration coefficients of 1.1 and 1.2 to compensate for the unregistered cropland affected by the land tax quota in 1730 and 1780, respectively. We then used calibration coefficients of 1.2 to calibrate the registered cropland area in 18 counties located in the Guanzhong Basin and 1.5 to calibrate the cropland area in 28 counties in high-altitude areas in 1830. After calibration, the total cropland area in 1730, 1780, and 1830 was 0.86, 0.94, and 1.02 times the land tax quota in the late Ming Dynasty. Statistics in 1910 were also affected by the factor of unregistered land. The correlation analysis between statistics and the survey data of each county in 1980 in the Guanzhong area (CISNR, 1989) showed that the survey cropland area data was 1.18 times of the cropland area data from statistics. Thus, a calibration coefficient of 1.18 was used to improve the cropland area data from statistics to the survey data standard in 1910. After calibration, the cropland areas of seven counties were found to be much smaller than those in 1880. Based on the cropland area change from 1880 to 1910 in their neighboring counties, the cropland areas of seven counties in 1910 were re-calculated. For statistics in 2016, the calibration coefficients were calculated based on the statistics and survey data at the municipality level. The statistics at the county level in the corresponding municipalities were also improved.
2.3.4 Cropland area allocation
Based on the studies of administrative division change in the Guanzhong area over the past 300 years (Fu and Zheng, 2007; Fu et al., 2013), we found that administrative boundaries of most counties did not change significantly before 1949, except for splitting, merging and renaming of a few counties. The administrative map in 1911 was used as the base map for cropland area data in 1650, 1730, 1780, 1830, 1880, 1910, and 1930. We adjusted the cropland area data for counties that were split or merged. The administrative map in 1980 and 2015 was used as the base map for cropland area data in 1980 and 2016, respectively.
To allocate the cropland area data at the provincial level in China into 10 km×10 km grids, Li et al. (2016) developed a cropland area allocation model. This model was also applicable to many regional studies (Paudel et al., 2017; Li et al., 2019; Wei et al., 2019). In the Guanzhong area, the cropland area reached the maximum around 1980, and most of the built-up lands were changed from cropland. Thus, the potential maximum cropland area data for cropland area allocation was developed from the 1 km×1 km satellite-based cropland and built-up data in 1980. Factors of elevation, slope, and the climatic potential productivity data at 1 km×1 km resolution were quantified and used to calculate the value of land suitability for the cultivation of grid i. Based on cropland area data at the county level in the Guanzhong area and the cropland area allocation model (Li et al., 2016), we allocated the cropland area at the county level in the Guanzhong area into 1 km×1 km grids for the time points of 1650, 1730, 1780, 1830, 1880, 1910, 1930, 1980, and 2016.

3 Results

3.1 Temporal changes in total cropland area

Affected by natural disasters, wars, and politics, the total cropland area in the Guanzhong area fluctuated over the past 360 years (Figure 4). The changes could be classified into four phases.
Figure 4 Total cropland area change in the Guanzhong area from 1650 to 2016
The first phase was from 1650 to 1830. The Guanzhong Basin, which is close to the Yellow River and has a flat terrain, was almost wholly cultivated in the Ming Dynasty (1368-1644). However, the Manchu wars in the late Ming Dynasty caused numerous deaths and escapes. As a result, about 30% of the cropland was abandoned. Around 1650, the total cropland area stood at 1.47×10⁴ km2. After Manchu took over Beijing and the Qing government suppressed the anti-Qing forces in Shaanxi Province, land reclamation in the Guanzhong area began. The government implemented a series of policies to encourage land reclamation. The total cropland area increased steadily from 1650 to 1830, peaking at 2.09×10⁴ km2 in 1830.
The second phase was from 1830 to 1930. After 1830, the steady growth of the cropland area did not last for a long time. In the second phase, the “Tongzhi rebellion” among the Hui people in Shaanxi Province occurred. After the Qing government suppressed the rebellion, the most severe drought event of the 19th century, Dingwu Disaster, occurred and had devastating effects on agriculture and water supplies in the Guanzhong area. The total cropland area decreased to 1.93×10⁴ km2 in 1880, which was less than that in 1780. The next 30 years still experienced a slight decrease, with 1910 arriving at 1.86×10⁴ km2. From 1924 to 1930, devastating droughts, hail, and frost disasters caused severe damage to cropland, and war caused by warlords aggravated the impact of the disasters (Yuan, 1994). The total cropland area plunged to the lowest point of 1.81×10⁴ km2 in 1930.
The third phase was from 1930 to 1980. During this period the total cropland area increased rapidly, peaking at 2.32×10⁴ km2 in 1980. Due to the reduction of wars and the government’s encouragement of land reclamation, the fractional cropland area increased from 33.16% in 1930 to 41.86% in 1980.
The fourth phase was from 1980 to 2016. The total cropland area declined again to 1.67×10⁴ km2 in 2016 because of urbanization, migration, and industrial structure changes. Moreover, survey data showed that areas comprising forests and fruit trees increased, whereas cropland and grassland distributions decreased in this period. The planting of fruit trees and changing cropland to forests also contributed to the decline in the cropland area.

3.2 Spatiotemporal changes in cropland distribution

Most of the cropland was distributed in the Guanzhong Basin, especially on both sides of the Weihe River and on the Yellow River’s west side (Figure 5). In 1650, a large amount of cropland was abandoned. Grid cells with more than 50% of the cropland area accounted for only 26.52% of the total number of grid cells. The cropland area fractions of most grid cells in the northern Guanzhong area, which belongs to the Loess Plateau, and northern Qinling Mountains were less than 30%. The years of 1730 and 1780 were in the period of land reclamation. The cropland area fraction increased in the Guanzhong Basin. However, the cropland area in the northern Guanzhong area and northern Qinling Mountains did not change significantly. Grid cells with more than 50% of the cropland area accounted for 33.35% in 1730 and 35.2% in 1780. The grid cells with more than 80% of the cropland area increased by 5%. As the population increased steadily, the abandoned cropland was completely reclaimed. Uncultivated land and mountainous areas with poor natural conditions also began to be cultivated by migrants. In 1830, the cropland expanded in the northern and western Guanzhong areas. Additionally, the cropland in the north of the Qinling Mountains increased slightly. Between 1730 and 1830, grid cells with more than 20% of the cropland area increased by 5.37%, mainly distributed in the northern and northwestern parts of the Guanzhong area. Grid cells with more than 50% and 80% of the cropland area accounted for 37.14% and 23.97% of the total number of grid cells in 1830, respectively.
Figure 5 Spatial distributions of cropland in the Guanzhong area from 1650 to 2016
Then, wars and disasters caused a sharp decline in the population of the Guanzhong area, and a vast amount of cropland was abandoned again. The cropland area in the overall Guanzhong area declined, either in the basin or the high-altitude areas. The devastating Dingwu Disaster ended around 1880. Grid cells with more than 50% and 80% of the cropland area declined to 35.62% and 16.69%. From 1880 to 1910, the government adopted several policies to encourage reclamation. Thus, the cropland area increased significantly in and around the Guanzhong Basin, mostly in Chang’an, Fuping, Heyang, Lintong, Jingyang, and Chunhua counties. However, the cropland area still decreased in the western, northern, and northeastern parts. Grid cells with more than 50% of the cropland area also decreased to 34.50% in 1910. In the following years, endless wars and frequent natural disasters prevented agricultural production in the Guanzhong area from fully recovering. In 1930, though the cropland area in Chang’an, Xianning, Weinan, Dali, Fufeng, and Baishui counties increased, the cropland area in Pucheng, Lintong, Chunhua, Fuping, and Baoji counties decreased a lot, which was impacted by one of the worst droughts in 1929 in northwestern China.
The end of wars, promotion of agricultural technology, and implementation of new policies caused an increase in the cropland area, which expanded dramatically in the northern, northeastern, and western parts of the Guanzhong area. Grid cells with more than 50% and 80% of the cropland area increased to 43.26% and 21.71% in 1980. However, urbanizations caused a decline in the cropland area in the central Guanzhong Basin.
After 1980, the cropland declined in the whole study area, especially in the cities of Xi’an and Xianyang. Because of the acceleration of urbanization, demands for urban land increased. Simultaneously, since cities could provide more employment opportunities and higher returns, many rural laborers entered the towns, making part of the cropland unusable. To increase income, people stopped growing food crops and replaced them with fruit trees and vegetables. All these factors caused the decline in the cropland area. In 2016, grid cells with more than 50% and 80% of the cropland area dropped to 27.91% and 3.59%, which were even less than those in 1730.

4 Discussion

4.1 Temporary abandonment of cropland in 1880 and 1930

Our cropland data in 1650, 1730, 1780, and 1830 reflected the change of cropland cover in the early and middle Qing Dynasty. However, the decreases in the cropland area in 1880 and 1930 were caused by the temporary abandonment of cropland. The abandoned cropland was not cultivated for a short time or converted to other land cover types. Thus, our cropland area data in 1880 and 1930 reflected the impacts of wars and disasters on cropland, but not cropland cover for a long time.
From 1862 to 1877, the “Tongzhi rebellion” by the Hui occurred because of racial antagonism and class warfare (Hastings et al., 1916). The revolt began in 1862 in the Weihe River valley and spread rapidly throughout southeastern Shaanxi (Twitchett and Fairbank, 1980). Qwing to war conditions, many civilians died, and many people migrated to Shanxi and Inner Mongolia. The post-war consensus reflected a population reduction of 44.7% in Shaanxi (Cao, 2001). After Dungan Revolt, almost all cropland reclaimed by immigrants in the early Qing Dynasty in the northwestern part was lost (Hou, 1997). Then, a large-scale drought, known as the Dingwu Disaster, occurred in China from 1877 to 1878, which also caused the death of countless people and migrations. One of its centers was Shaanxi Province. The disaster temporarily prevented the post-revolt reclamation. However, the drought in central Shaanxi was fully relieved in April 1878 (Zhang and Liang, 2010). With the gradual return of refugees and policies that encouraged reclamation, the abandoned cropland was cultivated again (Hou, 1997).
Starting in 1927, wars and drought disasters across northern China occurred, causing severe famine and many deaths in rural areas. Among the disaster-affected provinces, Shaanxi Province was the most affected, with 3 million deaths by hunger, and 6 million people fled (Li, 2007). The Guanzhong area was the hardest-hit area in Shaanxi. In 1930, the population of all counties in Guanzhong decreased significantly compared with that in 1928 (Zheng, 2001). The amount of abandoned cropland area accounted for about 30%-100% in 19 counties in Shaanxi Province (Deng, 2012). Grain prices were abnormally high, while land prices plummeted; however, no farmer wanted to buy land (Zhao and Hou, 2012). With the appearance of rain in some counties in 1930, the drought ended by 1932 in the Guanzhong area (Zhang, 2014). However, affected by the drought, more than 100 km2 of abandoned cropland in fertile Weihe River valley was still uncultivated in 1933 (Deng, 2012). Therefore, although the cropland was also abandoned temporarily in 1930, the barren cropland lasted longer than in 1880.

4.2 Comparison with previous studies

Three published studies provided the total cropland area data in the Guanzhong area over the past 300 years (Liu, 2015; Li et al., 2016; Klein Goldewijk et al., 2017); we compared them with our results (Figure 6). Liu (2015) collected the total tax-paying cropland area data from historical literatures without calibration. Thus, the total cropland area of Liu (2015) is much lower than ours, especially after 1730. Moreover, since different data sources were used by Liu (2015), the total cropland area from 1724 to 1741 varied greatly. The total cropland area data at the provincial level was allocated into grid cells of 10 km×10 km, depending on the land suitability for cultivation, and the Chinese historical cropland dataset (CHCD) was generated (Li et al., 2016). Because the Guanzhong area is the most suitable area for cultivation in Shaanxi Province, the cropland allocation method of the CHCD increased the total cropland area more than in this study.
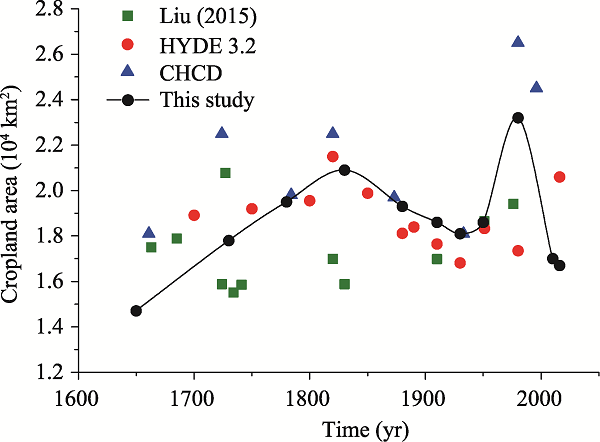
Figure 6 Comparison of total cropland area between previous studies and this study
The cropland area changing trend of the Guanzhong area from the HYDE 3.2 dataset is close to that in this study, especially from 1730 to 1950 (Figure 6). However, HYDE 3.2 shows that the cropland area grew from 1930 to 1950, decreased from 1950 to 1980, and grew rapidly after 1980. This study reflects that the period between 1930 and 1980 experienced a sharp rise, and the cropland area quickly declined after 1980. Based on the analysis of Feng et al. (2005), China experienced a new land reclamation period from 1963 to 1966. The cropland area in the whole country increased until 1979. However, HYDE 3.2 significantly underestimates the cropland area in the Guanzhong area in 1980. The cropland area extracted from HYDE 3.2 was 1.74×10⁴ km2 in 1980, which is less than that in this study. Conversely, in 2016, the total cropland area from HYDE 3.2 was 2.06×10⁴ km2, which is more extensive than that in this study. Different definitions of cropland between HYDE 3.2 and this study may be among the reasons for the difference in 2016. The cropland in HYDE 3.2 included permanent crops, which were excluded in this study.
Since the total cropland area from HYDE 3.2 has good correspondence with our study, we compared our cropland maps with HYDE 3.2. We used Formula (1) to calculate the differences between HYDE 3.2 and this study for six time points (1830, 1880, 1910, 1930, 1980, and 2016). For HYDE 3.2, we selected 1820 in correspondence to 1830 in this study.
Difference(i) = HYDE(i) - GZ(i)
where Difference(i) is the difference between HYDE 3.2 and the data of this study, HYDE(i) is the cropland area fractions of grid i in HYDE 3.2, and GZ(i) is the cropland area fractions of grid i in this study.
Differences in cropland distribution between HYDE 3.2 and the data in this study are depicted in Figure 7. For the six selected time points, the differences of grid cells between HYDE 3.2 and this study were all between -79% and 40%, and the grid cells with a negative difference value accounted for approximately 34%-55% of the total grid cells. From 1820 to 1980, grid cells of HYDE 3.2 had lower amounts of cropland area fraction than those in this study in the Guanzhong Basin. However, in high-altitude areas around the Guanzhong Basin, HYDE 3.2 had higher amounts of cropland area fraction than this study, especially in the northern and northwestern parts of the Guanzhong area. Before 1930, HYDE 3.2 had a larger cropland area along Weihe River’s tributaries, Jinghe River and Qianhe River. Besides, there was little difference in the cropland area fraction of grid cells between different regions inside the Guanzhong Basin showed by HYDE 3.2. However, this study shows grid cells with high cropland area fractions concentrated in the middle of the basin, especially around Xi’an City. HYDE 3.2 showed the same spatial patterns of cropland in 1930 and 1980. However, this study showed that the number of grid cells with high cropland area fraction decreased in 1930 because of the drought, and cropland expanded to high-altitude areas around the Guanzhong Basin in 1980. The number of grid cells with differences of less than -20% and more than 20% accounted for 28% in 1980 and 23% in 2016. Since HYDE 3.2 and this study used different data sources and cropland area allocation models, there were significant differences between them. The difference in spatial resolution and accuracy of the data sources also increased the contrast. Assigning more weight to the grid cells around the river in the cropland area allocation model and allocating the total cropland area at the provincial level to grid cells increased the uncertainty of HYDE 3.2 before 1930 in the Guanzhong area.
Figure 7 Differences in cropland distributions in the Guanzhong area between HYDE 3.2 and this study

4.3 Uncertainties

There were still some uncertainties in this study. Since the cropland area information of only 15 counties was recorded in gazetteers, we interpolated the missing data in 1880 based on cropland records in neighboring counties, which may cause data errors.
Furthermore, we only found the administrative division map at the county level for 1911. However, there are few results on the changes in the administrative boundaries of each county in history. Thus, the collected cropland areas from data sources in some counties did not match the administrative division map of 1911. For example, the recorded cropland area in Fengxiang County before 1910 was larger than the land area provided by the administrative division map of 1911. We could only adjust the cropland area based on the cropland area fraction in its neighboring counties. Therefore, there is a need to obtain more information on the administrative changes of each county in history.
For the assessment of the accuracy of the cropland area allocation model, Li et al. (2016) compared their results, which were obtained using the same model, with satellite-based data obtained in 2000 for the whole country. The differences were mostly distributed between -20% and 20%, which reflected the reliability of the cropland area allocation model. Although the result of cropland area allocation in this study is reliable, the built-up land was not removed from the potential maximum cropland area map before 1980. A few cropland areas were allocated to grid cells that were supposed to be built-up land. Moreover, more information on historical facts relating to agricultural development in the Guanzhong area should be collected to improve the rationality of the reconstruction.

5 Conclusions

In this study, we reconstructed the cropland change from 1650 to 2016 based on gazetteers, statistics, and survey data at the county level, and pursued a quantitative understanding of spatio-temporal changes of cropland in the Guanzhong area from 1650 to 2016. The following major conclusions were obtained:
(1) Influenced by changes in population, wars, natural disasters, and land use types, the total cropland area in the Guanzhong area fluctuated from 1650 to 2016. There are four phases of cropland change: steady growth before 1830, decrease from 1830 to 1930, rapid increase from 1930 to 1980, and quick decrease after 1980. The total cropland area increased from 1.47×10⁴ km2 in 1650 to 2.32×10⁴ km2 in 1980 and then decreased to 1.67×10⁴ km2 in 2016.
(2) From 1650 to 2016, the largest part of the cropland was distributed in the Guanzhong Basin, especially along the Weihe River and Yellow River. From 1780 to 1830, the cropland expanded in the northern and western Guanzhong area, and the cropland in the north of Qinling Mountains also increased slightly. The range of cropland spatial patterns reached its maximum in 1980, and the cropland area declined in the whole study area, especially in the cities of Xi’an and Xianyang in 2016.
(3) From 1830 to 1930, the grid cells of HYDE 3.2 showed lower amounts of cropland area fraction than those found in the study in the Guanzhong Basin and higher values in the high-altitude areas around the Guanzhong Basin, especially along the tributaries of the Weihe River. Either assigning more weight to the grid cells around the river in the cropland area allocation model or allocating the total cropland area at the provincial level to grid cells increased the uncertainty of the HYDE 3.2 dataset in the Guanzhong area.
[1]
Arneth A, Denton F, Agus F et al., 2019. Framing and Context. In: Climate Change and Land: an IPCC special report on climate change, desertification, land degradation, sustainable land management, food security, and greenhouse gas fluxes in terrestrial ecosystems.

[2]
Beijing Astronomical Observatories, Chinese Academy of Sciences (BAOCAS), 1985. A general catalogue of gazetteers in China. Beijing: Chinese Academy of Sciences. (in Chinese)

[3]
Brovkin V, Boysen L, Arora V K et al., 2013. Effect of anthropogenic land-use and land-cover changes on climate and land carbon storage in CMIP5 Projections for the twenty-first century. Journal of Climate, 26(18): 6859-6881.

DOI

[4]
Buck J L, 1937. Land Utilization in China. Shanghai: The Commercial Press.

[5]
Cao S, 2001. Chinese Population History (Volume V): Qing Dynasty. Shanghai: Fudan University Press. (in Chinese)

[6]
Cheng Wen Publishing (CWP), 1966. Series of Chinese Gazetteers. Taiwan: Cheng Wen Publishing. (in Chinese)

[7]
Commission for Integrated Survey of Natural Resources (CISNR), the Chinese Academy of Sciences and State Planning Commission, 1989. Datasets of land and resources of China. (in Chinese)

[8]
Deng T, 2012. Famine Relief History in China. Wuhan: Wuhan University Press. (in Chinese)

[9]
Editorial Department of Chinese Agricultural Encyclopedia (EDCAE), 1995. Encyclopedia of Chinese Agriculture (Agricultural History Volume). Beijing: Agricultural Press. (in Chinese)

[10]
Ellis E C, Beusen A H W, Klein Goldewijk K, 2020. Anthropogenic biomes: 10,000 BCE to 2015 CE. Land, 9(5): 129.

DOI

[11]
Fang X, Zhao W, Zhang C et al., 2020. Methodology for credibility assessment of historical global LUCC datasets. Science China Earth Sciences, 63(7): 1013-1025.

DOI

[12]
Feng Z, Liu B, Yang Y, 2005. A study of the changing trend of Chinese cultivated land amount and data reconstructing: 1949-2003. Journal of Natural Resources, 20(1): 35-43. (in Chinese)

[13]
Findell K L, Berg A, Gentine P et al., 2017. The impact of anthropogenic land use and land cover change on regional climate extremes. Nature Communications, 8(1): 989.

DOI

[14]
Foley J A, Defries R, Asner G P et al., 2005. Global consequences of land use. Science, 309(5734): 570-574.

DOI

[15]
Friedlingstein P, Jones M W, O'Sullivan M et al., 2019. Global Carbon Budget 2019. Earth System Science Data, 11(4): 1783-1838.

DOI

[16]
Fu X, Lin J, Ren Y et al., 2013. The History of Administrative Divisions in China (Qing Dynasty). Shanghai: Fudan University Press. (in Chinese)

[17]
Fu X, Zheng B 2007. The History of Administrative Divisions in China (The Republic of China). Shanghai: Fudan University Press. (in Chinese)

[18]
Gaillard M-J and LandCover6k Interim Steering Group Members, 2015. LandCover6k: Global anthropogenic land-cover change and its role in past climate. Past Global Change Magazine, 23(1): 38-39.

DOI

[19]
Gaillard M-J, Morrison K D, Madella M et al., 2018. Past land-use and land-cover change: The challenge of quantification at the subcontinental to global scales. Past Global Change Magazine, 26(1): 3.

DOI

[20]
Gilgen A, Wilkenskjeld S, Kaplan J O et al., 2019. Effects of land use and anthropogenic aerosol emissions in the Roman Empire. Climate of the Past, 15(5): 1885-1911.

DOI

[21]
Harrison S P, Gaillard M-J, Stocker B D et al., 2020. Development and testing scenarios for implementing land use and land cover changes during the Holocene in Earth system model experiments. Geoscientific Model Development, 13(2): 805-824.

DOI

[22]
Hastings J, Selbie J A, Gray L H, 1916. Encyclopaedia of Religion and Ethics: Life and Death-Mulla. T. & T. Clark.

[23]
Hazeleger W, Severijns C, Semmler T et al., 2010. EC-Earth: A seamless earth-system prediction approach in action. Bulletin of the American Meteorological Society, 91(10): 1357-1364.

DOI

[24]
He F, Tian Y, Ge Q, 2003. Spatial-temporal characteristics of land reclamation in Guanzhong region in the Qing Dynasty. Geographical Research, 22(6): 687-697. (in Chinese)

[25]
Ho P T, 1959. Studies on the Population of China, 1368-1953. Cambridge: Harvard University Press.

[26]
Hoesly R M, Smith S J, Feng L et al., 2018. Historical (1750-2014) anthropogenic emissions of reactive gases and aerosols from the Community Emissions Data System (CEDS). Geoscientific Model Development, 11(1): 369-408.

DOI

[27]
Hou C, 1997. Migration and its impacts in Northwest China after the Tongzhi Hui Revolt. Journal of Shanxi University (Philosophy and Social Science Edition), 3: 68-72. (in Chinese)

[28]
Houghton R A, 2003. Revised estimates of the annual net flux of carbon to the atmosphere from changes in land use and land management 1850-2000. Tellus B: Chemical and Physical Meteorology, 55(2): 378-390.

[29]
Houghton R A, 2018. Interactions between land-use change and climate-carbon cycle feedbacks. Current Climate Change Reports, 4(2): 115-127.

DOI

[30]
Kaplan J O, Ruddiman W F, Crucifix M C et al., 2010. Holocene carbon emissions as a result of anthropogenic land cover change. The Holocene, 21(5): 775-791.

DOI

[31]
Klein Goldewijk K, Beusen A, Doelman J et al., 2017. Anthropogenic land use estimates for the Holocene - HYDE 3.2. Earth System Science Data, 9(2): 927-953.

DOI

[32]
Klein Goldewijk K, Beusen A, Van Drecht G et al., 2011. The HYDE 3.1 spatially explicit database of human-induced global land-use change over the past 12,000 years. Global Ecology and Biogeography, 20(1): 73-86.

DOI

[33]
Klein Goldewijk K, Dekker S C, van Zanden J L, 2017. Per-capita estimations of long-term historical land use and the consequences for global change research. Journal of Land Use Science, 12(5): 313-337.

[34]
Klein Goldewijk K, Verburg P H, 2013. Uncertainties in global-scale reconstructions of historical land use: An illustration using the HYDE data set. Landscape Ecology, 28(5): 861-877.

DOI

[35]
Li B, Fang X, Ye Y et al., 2010. Accuracy assessment of global historical cropland datasets based on regional reconstructed historical data: A case study in Northeast China. Science China Earth Sciences, 53(11): 1689-1699.

DOI

[36]
Li K, He F, Zhang X, 2011. An approach to reconstructing spatial distribution of historical cropland with grid-boxes by utilizing MODIS land cover dataset: A case study of Yunnan Province in the Qing Dynasty. Geographical Research, 30(12): 2281-2288. (in Chinese)

[37]
Li L, 2007. Fighting Famine in North China. Stanford: Stanford University Press.

[38]
Li S, He F, Zhang X 2016. A spatially explicit reconstruction of cropland cover in China from 1661 to 1996. Regional Environmental Change, 16(2): 417-428.

DOI

[39]
Li S, He F, Zhang X et al., 2019a. Evaluation of global historical land use scenarios based on regional datasets on the Qinghai-Tibet Area. Science of the Total Environment, 657: 1615-1628.

DOI

[40]
Li Y, Ye Y, Zhang C et al., 2019b. A spatially explicit reconstruction of cropland based on expansion of polders in the Dongting Plain in China during 1750-1985. Regional Environmental Change, 19(8): 2507-2519.

DOI

[41]
Liu J, Zhang Z, Xu X et al., 2010. Spatial patterns and driving forces of land use change in China during the early 21st century. Journal of Geographical Sciences, 20(4): 483-494.

DOI

[42]
Liu L, 2015. The study of the agricultural land use in the Central Shaanxi Plain area from 1644 to 1949 [D]. Xi’an: Shaanxi Normal University. (in Chinese)

[43]
Luo J, Zhang Y, Liu F et al., 2014. Reconstruction of cropland spatial patterns for 1726 on Yellow River-Huangshui River Valley in northeast Qinghai-Tibet Plateau. Geographical Research, 33(7): 1285-1296. (in Chinese)

[44]
Ministry of Agriculture and Commerce (MAC), 1919. The Fifth Agricultural and Commercial Statistics Table. Shanghai: Shanghai Zhonghua Book Company. (in Chinese)

[45]
National Bureau of Statistics (NBS), 1989. Summary of Rural Economic Statistics by County in China. Beijing: China Statistics Press. (in Chinese)

[46]
Paudel B, Zhang Y, Li S et al., 2017. Spatiotemporal reconstruction of agricultural land cover in Nepal from 1970 to 2010. Regional Environmental Change, 17(8): 2349-2357.

DOI

[47]
Peng Y, 1990. History of Land Reclamation in the Qing Dynasty. Beijing: Agriculture Press. (in Chinese)

[48]
Phoenix Publishing House (PPH), 2007. Collection of Chinese Gazetteers (Shaanxi Volume). Nanjing, Phoenix Publishing House. (in Chinese)

[49]
Pongratz J, Raddatz T, Reick C H et al., 2009b. Radiative forcing from anthropogenic land cover change since A.D. 800. Geophysical Research Letters, 36(2): L02709.

[50]
Pongratz J, Reick C H, Houghton R A et al., 2014. Terminology as a key uncertainty in net land use and land cover change carbon flux estimates. Earth System Dynamics, 5(1): 177-195.

DOI

[51]
Pongratz J, Reick C H, Raddatz T et al., 2009a. Effects of anthropogenic land cover change on the carbon cycle of the last millennium. Global Biogeochemical Cycles, 23: GB4001.

[52]
Ramankutty N, Foley J A, 1999. Estimating historical changes in global land cover: Croplands from 1700 to 1992. Global Biogeochemical Cycles, 13(4): 997-1027.

DOI

[53]
Ramankutty N, Foley J A, 2010. ISLSCP II Historical Croplands Cover, 1700-1992. ISLSCP Initiative II Collection.

[54]
Ryavec K E, 2001. Land use/cover change in central Tibet, c. 1830-1990: Devising a GIS methodology to study a historical Tibetan land decrease. The Geographical Journal, 167(4): 342-357.

DOI

[55]
Tian H, Yang J, Xu R et al., 2019. Global soil nitrous oxide emissions since the preindustrial era estimated by an ensemble of terrestrial biosphere models: Magnitude, attribution, and uncertainty. Global Change Biology, 25(2): 640-659.

DOI

[56]
Tian Y, Li J, Ren Z, 2012. The crop land change and spatial pattern in Loess Plateau over past 300 years. Journal of Arid Land Resources and Environment, 26(2): 94-101. (in Chinese)

[57]
Twitchett D, Fairbank J K, 1980. The Cambridge History of China, Vol. 11. Cambridge University Press.

[58]
Wei X, Ye Y, Zhang Q et al., 2015. Methods for cropland reconstruction based on gazetteers in the Qing Dynasty (1644-1911): A case study in Zhili province, China. Applied Geography, 65: 82-92.

DOI

[59]
Wei X, Ye Y, Zhang Q et al., 2019. Reconstruction of cropland change in North China Plain Area over the past 300 years. Global and Planetary Change, 176: 60-70.

DOI

[60]
Xia M, 1992. Also talk about “Ding-Wu Disaster”. The Qing History Journal, (4): 83-91. (in Chinese)

[61]
Yang X, Jin X, Guo B et al., 2015. Research on reconstructing spatial distribution of historical cropland over 300 years in traditional cultivated regions of China. Global and Planetary Change, 128: 90-102.

DOI

[62]
Ye Y, Fang X, 2009. Land use change in Northeast China in the twentieth century: A note on sources, methods and patterns. Journal of Historical Geography, 35(2): 311-329.

DOI

[63]
Ye Y, Fang X, 2012. Expansion of cropland area and formation of the eastern farming-pastoral ecotone in northern China during the twentieth century. Regional Environmental Change, 12(4): 923-934.

DOI

[64]
Ye Y, Fang X, Ren Y et al., 2009. Cropland cover change in Northeast China during the past 300 years. Science in China Series D: Earth Sciences, 52(8): 1172-1182.

DOI

[65]
Yuan L, 1994. The History of Famine in Northwest China. Lanzhou: Gansu People’s Publishing House. (in Chinese)

[66]
Zhang D, Liang Y, 2010. A long lasting and extensive drought event over China in 1876-1878. Advances in Climate Change Research, 1(2): 91-99.

[67]
Zhang L, 2018. New and old abandoned cropland: Inventory and analysis of abandoned land in Shanxi Province after ‘Ding Wu Disaster’. Historical Geography, 38(2): 153-171. (in Chinese)

[68]
Zhang L, Jiang L, Zhang X, 2015. Spatially precise reconstruction of cropland areas in Heilongjiang Province, northeast China during 1900-1910. Journal of Geographical Sciences, 25(5): 592-602.

DOI

[69]
Zhang N, 2014. A comparative study of two great droughts in Guanzhong area, Shaanxi in 1900 and 1929 [D]. Xi’an: Shaanxi Normal University. (in Chinese)

[70]
Zhang X, He F, Li S, 2013. Reconstructed cropland in the mid-eleventh century in the traditional agricultural area of China: Implications of comparisons among datasets. Regional Environmental Change, 13(5): 969-977.

DOI

[71]
Zhao N, Hou X, 2012. Analysis of the severe drought in Shaanxi during 1928-1930 and its impact. Journal of Ningxia Teachers University (Social Science), 33(2): 87-90. (in Chinese)

[72]
Zheng L, 2001. The transition of planting structure in Guanzhong area after the drought between 1928-1930. Agricultural History of China, 20(1): 51-61. (in Chinese)

Outlines

/