Research Articles

Influence of the variation in rural population on farmland preservation in the rapid urbanization area of China

  • ZHANG Mingyu , 1 ,
  • CHEN Qiuxiao , 2, 1, * ,
  • ZHANG Kewei 1
Expand
  • 1. Department of Regional and Urban Planning, Zhejiang University, Hangzhou 310058, China
  • 2. School of Spatial Planning and Design, Zhejiang University City College, Hangzhou 310015, China
* Chen Qiuxiao, Professor, E-mail:

Zhang Mingyu (1990-), PhD and Associate Research Professor, specialized in rural development and urbanization. E-mail:

Received date: 2020-07-28

  Accepted date: 2021-03-04

  Online published: 2021-11-25

Supported by

National Key R&D Program of China(2018YFD1100302)

Copyright

Copyright reserved © 2021. Office of Journal of Geographical Sciences All articles published represent the opinions of the authors, and do not reflect the official policy of the Chinese Medical Association or the Editorial Board, unless this is clearly specified.

Abstract

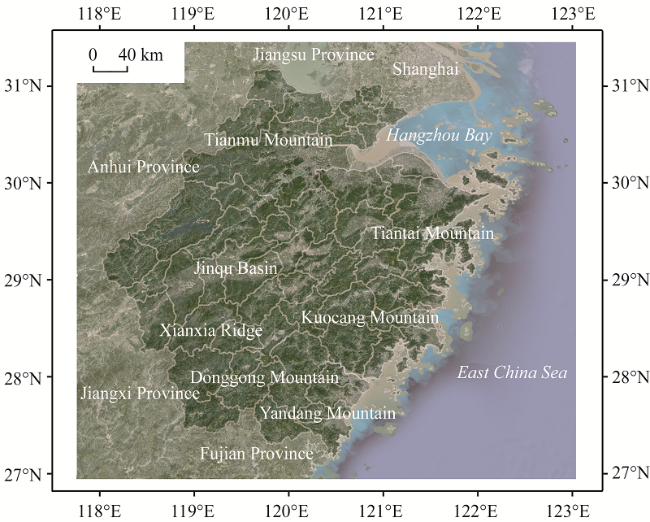
In the past 40 years, cultivated land has faced the continued anthropogenic interference, which has become a significant issue for cultivated land preservation during rapid urbanization. The purpose of this research was to reveal the spatio-temporal evolutionary characteristics of cultivated land and the correlation between rural population variation and farmland change in China. Fifty county-level administrative units in Zhejiang Province were selected as the study area wherein spatio-temporal evolution comparative analysis for every 5 years from 2000 to 2015 was conducted. This study used the pool method to estimate the impacts of the rural population variation, average slope, average elevation, rural residential disposable income, primary industry proportion, and road density on farmland utilization efficiency from the spatial perspective, which is represented by landscape metrics including the mean patch size, edge density, area weighted mean shape index, and area weighted mean patch fractal dimension. This study showed that the cultivated land landscape index continued to rise after 2000 and then started decreasing after 2010, indicating a reduction in human interference after 2010. The spatial variation of rural population of all county-level administrative units decreased from 2000 to 2010, and 62% of them began to increase after 2010. The regression analysis results showed that the spatial variation of rural population was significantly and negatively correlated with the cultivated land landscape while the rural residential disposable income, average slope and primary industry proportion were all significantly and positively related to the cultivated land landscape index. The results implied that the loss of the agricultural labor force and the difficulty of sloping farmlands adapting to mechanized farming were unconducive to farmland utilization efficiency improvement, and the increase in nonagricultural activities in rural areas would increase the difficulty of cultivated land preservation. Our analysis suggests that local governments should improve the production efficiency of fragmented land or strengthen the construction control of housing and facilities in rural areas according to their regional urbanization development situation.

Cite this article

ZHANG Mingyu , CHEN Qiuxiao , ZHANG Kewei . Influence of the variation in rural population on farmland preservation in the rapid urbanization area of China[J]. Journal of Geographical Sciences, 2021 , 31(9) : 1365 -1380 . DOI: 10.1007/s11442-021-1901-5

1 Introduction

In the rapid urbanization process of China, the total amount of farmland rapidly decreased by approximately 11.1 million hectares from 1998 to 2005. As China has a relatively low cultivated land area per capita (Chien, 2015), this loss of farmland has attracted increasing attention from policy makers and researchers. Previous studies have shown that the encroachment of cultivated land first occurred in the eastern coastal area of China and then gradually spread to the central and western inland regions (Zhong et al., 2011; Liu et al., 2014; Jiang et al., 2020a; Wang et al., 2020). Environmental pollution and ecological deterioration have also contributed to the decline of farmland productivity (Jiang et al., 2017; Han et al., 2020). As the basic resource of agriculture, cultivated land destruction has weakened the national economy’s sustainability, social stability, and ecological security (Yang et al., 2000; Skinner et al., 2001; Wu et al., 2017).
Since 1986, the Chinese government has gradually introduced the farmland preservation law system and proposed preservation targets in the Master Plan Outline of Land Use (2006-2020), however cultivated land protection is still under great pressure. Urbanization and industrialization, which are considered to be the main driving forces of cultivated land loss (Song, 2014; Xiao et al., 2018; Yu et al., 2019), are still rapidly developing, promoting the spread of construction land from 26.0 million hectares in 2006 to 31.8 million hectares in 2016. To retain the total amount of farmland, the central government of China released the “No net loss of cultivated land policy”, through which, land spatial distribution was adjusted as well as land boundaries to provide potential areas for construction land (Liu et al., 2017). Thus, the landscape alterations of cultivated land, such as land fragmentation or land marginalization (Liu et al., 2019; Wang et al., 2020), caused the reduction of cultivated land use efficiency by impacting the lands’ spatial utilization conditions (York et al., 2011; Sklenicka et al., 2016). In addition, the land consolidation system also ensured the adjustment of the farmland spatial distribution as a standard and legal administrative procedure, which further promoted cultivated landscape change and became a huge challenge for cultivated land protection, especially in the rapid urbanization areas after 2006. Therefore, it is necessary to pay more attention to the landscape variations of farmland.
In rapid urbanization and industrialization, there are various reasons for cultivated land landscape variations, which can be generalized into natural and anthropogenic factors. Natural factors include the external environment, such as the topography, natural disasters, and accessibility (Liu et al., 2019; Liang et al., 2020); and the conditions of the cultivated land, such as the land productivity and land degradation (Jiang et al., 2020b). Conversely, anthropogenic factors cover a wider range of factors that include both political and socio-economic factors. Regarding political factors, researchers have mainly focused on the impact of the household land allocation system on farmland spatial distribution and the influences of property inheritance and ownership reform (Sklenicka et al., 2008; Lu et al., 2011). In terms of socio-economic factors, population, industry, and investment are considered regardless of their scale or structural characteristics (Jiang et al., 2019; Zhang et al., 2020). These factors cumulatively lead to variations in cultivated land landscape in different topographic regions (Xiao et al., 2018; Liang et al., 2020). The above mentioned factors mostly include regional indicators to cover the overall situation of cities and villages in order to evaluate the impacts of anthropogenic activities on cultivated land. Nevertheless, due to the leading role of urban areas in all aspects of regional socio-economic development, indicators such as the population structure are often more representative of urban development. This makes previous analysis of anthropogenic factors conducted via regional census data unable to distinguish the impact of rural development on cultivated land landscapes. In China, the rural shrinkage has lasted approximately 20 years during rapid urbanization development (Liu et al., 2017; Li et al., 2019). Due to the differences in the job opportunities and living environments between cities and villages, a large number of the young and middle-aged people have moved to urban areas, resulting in an age structure imbalance in the rural population (Li et al., 2014). This population loss in “hollow villages” has led to agricultural labor shortages, which causes farmland to go uncultivated (Long et al., 2012; Zhang et al., 2019). A rural area population influx exists in parts of the northern and eastern coastal provinces in China. Here, migrant populations prefer to gather in villages surrounding megacities to promote the development of the rural housing market (Hao et al., 2011; Zeng et al., 2019). While it is clear that the population fluctuation in rural areas directly influences the economic development and land use of rural areas, it is logical to wonder how it will further affect the cultivated land landscape.
Therefore, the main goal of this work is to investigate the relationship between rural population change and farmland landscape from a topographic perspective and discuss the impacts of anthropogenic disturbance caused by rural population change on cultivated lands. Taking Zhejiang Province as the empirical study area, this study aims to help the local government formulate an eco-friendly rural development policy and propose more effective cultivated land protection measures.

2 Methods and materials

2.1 Study Area

Zhejiang Province is located in the southeastern coastal area of China (118°01°-123°10°E,27°02°-31°11°N), and its administrative area covers 105,500 km2. At the end of 2018, the population reached 57.37 million, and the cultivated area was 1.974 million hectares. Zhejiang has a subtropical monsoon climate with hot and rainy summers and sunny and cold winters. The topography and landform slope from the southwest to the northeast in a step-like manner. The urbanization rate in Zhejiang increased from 48.6% in 2000 to 65.8% in 2015. It is a typical rapid urbanization region in China and the relationship between rural population variation and cultivated land preservation varies, providing representative samples for this study.
In 2016, there were 89 county-level administrative units in the study area, 39 of which were municipal districts. Because all of the municipal district areas are considered urban areas, there are no relative rural data sources available. Therefore, this research predominantly considers the remaining 50 county-level administrative units, including 19 county-level cities and 31 counties (Figure 1), as the research samples.
Figure 1 Location of the study area (Zhejiang Province, China)

2.2 Data sources

The data used in this paper mainly include: (1) population data are grid data provided by the American Oak Ridge Laboratory, USA, covering four periods of population data in Zhejiang in 2000, 2005, 2010, and 2015; (2) land-use data are vector data provided by the Institute of Geographical Information, Chinese Academy of Sciences, also covering four periods of data in Zhejiang in 2000, 2005, 2010, and 2015; (3) administrative boundary data obtained from the Department of Natural Resources of Zhejiang Province, and it is limited to 2015; (4) census data including all the socio-economic data are obtained from the “Zhejiang Statistical Yearbook” of 2001, 2006, 2011, and 2016 (corresponding to the four respective year’s statistical data), which were all downloaded from the official website of the Zhejiang Statistics Bureau (http://tjj.zj.gov.cn/col/col1525563/index.html).

2.3 Methods

This study divided the research years into three stages: stage 1 (2000-2005), stage 2 (2005-2010), and stage 3 (2010-2015). In each stage, the variation data were the difference between the data of the first year and last year. Through a quantitative analysis of each stage, one can find the diachronic relationship between the independent and dependent variables, which provides a more accurate evaluation of the variation process and influence mechanisms.
2.3.1 Evaluation of cultivated land landscape
The landscape of cultivated land is a result of the complex interaction between physical, biological, and social factors. To evaluate the evolution of the cultivated land landscape more intuitively, scholars have conducted quantitative research by introducing the landscape metrics. The landscape metrics are multi-disciplinary tool that combines information theory, space theory, and penetration theory in the field of landscape ecology (Shannon et al., 1962; Mandelbrot, 1983; Tischendorf, 2001). The index can describe landscapes quantitatively, thereby allowing the data to be comparable at different scales or at different times. In addition, the landscape metrics can describe general characteristics using an evaluation indicator system, which can reflect human interference with the farmland landscape (O’Neill et al., 1988). With the support of the theoretical tools of the landscape metrics, many scholars have conducted in-depth researches on Chinese land landscapes (Zhou et al., 2015; Yu et al., 2020). Therefore, in this study, the landscape metrics was used as the basic method for cultivated land landscape evaluation.
The cultivated land landscape evaluation method herein comprises three steps: first, determine all the individual landscape evaluation indicators of each research unit; second, analyze the weight of every indicator; and third, calculate the comprehensive landscape metrics.
(1) Evaluation cultivated land landscape indicator
According to the research objectives of this study, landscape indicators should reflect the man-made effects on landscape features. Furthermore, they must have a strong independence to accurately estimate whether the landscape of the cultivated land is affected by the rural population spatial variation (RPSV). According to the baselines of cultivated land preservation, this study selected indictors in the landscape metrics that would affect cultivated land use efficiency from three perspectives: the fragmentation, availability and stability of cultivated land (Dan et al., 2018). Based on previous studies, four indictors were selected, namely, the mean patch size (MPS), edge density (ED), area weighted mean shape index (AWMSI), and area weighted mean patch fractal dimension (AWMPFD). The MPS and ED represent the degree of land fragmentation, the AWMSI evaluates the availability of cultivated land resources, and the AWMPFD measures the stability of cultivated lands (Pei et al., 2014, Yan et al., 2016). The MPS is the most basic spatial feature in the landscape metrics and has been widely used in previous research. A small MPS represents a smaller average land area of cultivated land, meaning that a unit with a larger MPS may have a lower possibility of anthropogenic interference to its farmland. The MPS can be expressed as follows:
MPSti = Ati / Nti
where Ati is the total scale of the cultivated land in unit i in stage t, and Nti is the number of cultivated patches in unit i in stage t.
The ED is used to analyze the shape of landscape patches by indicating the extent to which the patches are divided by boundaries. The ED highly corresponds to the likelihood of human interference. A unit with a larger ED is likely to have more extensive landscape segmentation. The ED is calculated as follows:
EDti = Eti / Ati
where Eti is the total perimeter of all patches of cultivated land in unit i in stage t.
The AWMSI is used when the shape of the patch is more irregular and complex and is more inconvenient for mechanical farming, irrigation, and fertilization. This index reflects a negative effect and will decrease as the patch area increases. Therefore, the area factor should be considered when using this indicator, which can be used as a weighted vector in the shape index measurement. The AWMSI is presented as follows:
$AWMSI_{it}=\text{ }\!\!~\!\!\text{ }\underset{s=1}{\overset{N}{\mathop \sum }}\,\left[ \left( \frac{0.25{{P}_{ist}}}{\sqrt{{{a}_{ist}}}} \right)\left( \frac{{{a}_{ist}}}{A} \right) \right]$
Where ${{P}_{ist}}$ is the perimeter of cultivated land patch s in unit i in stage t, and ${{a}_{ist}}$ is the land area of cultivated land patch s in unit i in stage t. The value of the AWMSI is between 0 and 1. A greater value indicates a higher likelihood of human activities interfering with a landscape patch.
Finally, the AWMPFD describes the complexity of the inlay geometry of the landscape patch. It is calculated using the following:
$AWMPFD_{it}\text{ }\!\!~\!\!\text{ }=\text{ }\!\!~\!\!\text{ }\underset{i=1}{\overset{N}{\mathop \sum }}\,\left[ \left( \frac{2\ln \left( 0.25{{P}_{ist}} \right)}{\ln {{a}_{ist}}} \right)\left( \frac{{{a}_{ist}}}{A} \right) \right]$
The theoretical value range of the AWMPFD is 1 to 2, where 1 represents the simplest square geometry patch and 2 represents the most complex shape with the same area. Therefore, a higher AWMPFD value corresponds to a more complex shape of the cultivated land and a lower possibility of human interference.
(2) Weight calculation method of cultivated land landscape indicators
Each landscape indicator has its own distinct meaning and attribute. Therefore, when integrating the indicators into a comprehensive index, it is necessary to assign reasonable weights to each indicator. The entropy method is a common method used to determine the weights because it makes the multitype indicators dimensionless.
For cultivated land landscape indicator j, the calculation of its standardized value Pij in unit i uses the gravity method as follows:
${{P}_{ij}}=\text{ }\!\!~\!\!\text{ }\frac{{{X}_{isj}}}{\mathop{\sum }_{i=1}^{N}{{X}_{isj}}}$
Where ${{X}_{isj}}$ is the statistical value of the cultivated land patch s in unit i for indicator j.
Equation (5) is used to calculate the entropy value ${{E}_{j}}$ of indicator j:
${{E}_{j}}=\text{ }\!\!~\!\!\text{ }-K\underset{i=1}{\overset{N}{\mathop \sum }}\,{{P}_{ij}}\ln {{P}_{ij}}$
where K = 1/ln m, and m is the total size of the cultivated land patch.
Finally, the weight of each indicator can be calculated as follows:
${{W}_{j}}=~\frac{1-{{E}_{j}}}{K-\mathop{\sum }^{}{{E}_{j}}}$
where Wj is the weight vector of indicator j.
(3) Summary statistics of the cultivated land landscape index
As the four indicators have positive or negative correlations with the impact of anthropogenic activities on cultivated land, the indicators must be converted to the same positive or negative consistency. Thus, in this study, the landscape indicators were transformed using a data normalization method to make the Landscape metrics a dimensionless value that is comparable between different stages and research units (Table 1). After normalization, the cultivated land landscape index was determined by using the weights of the four landscape indicators of the rural cultivated land in each unit.
Table 1 The weight of the cultivated land landscape indicators
Landscape indicator Unit Correlation with human interference Weight
MPS ha Negative 0.4624
ED km/ha Positive 0.1762
AWMSI - Negative 0.2806
AWMPFD - Negative 0.0808
2.3.2 Assessment of rural population spatial variation
Based on the Landscan and land-use data, rural grids can be chosen via data fusion in ArcGIS 10.5. Note that the grid in the overlapping part of the multidistrict is attributed to the unit that includes the largest proportion of the grids. For any research unit i, the grids located in the urban construction land are marked as urban grids, and the remaining grids are marked as rural grids. Note that with the acceleration of urbanization in Zhejiang, a large number of rural grids were transformed into urban grids in each 5-year stage. Considering that the transformation of rural areas into urban areas is also a development path for rural grids, this study uses the total number of rural grids Fit according to the number of rural grids in the starting year of each period.
The dynamic spatial variation of the rural area was used to compare the population changes in rural grids. For each grid, the population growth caused by population migration was taken into account as well as the population change caused by natural growth. Therefore, considering the natural population growth rate of the three stages, the rural population variation of a grid higher than the natural population growth is regarded as a rural grid with population inflow. Conversely, a grid with population outflow exists where the population variation is lower than the original population in the beginning year in this stage. The rest of the grids are subsequently regarded as non-change grids. Thus, the rural population spatial variation of unit i can be calculated as follows:
RPSVit = (RIit - RDit) / RTit
where RPSVit is the rural population spatial variation in unit i in stage t, RIit is the number of grids with population inflow in unit i in stage t, RDit is the number of grids with population outflow in unit i in stage t, and RTit is the total number of rural grids in unit i in stage t.
2.3.3 Regression analysis method
To obtain the appropriate regression model, this study utilized three regression methods, including the fixed effects model (FE), random effects model (RE), and pool model (POOL), to estimate the panel data of the cultivated land index and rural population spatial variation. Furthermore, the F test is used to distinguish the appropriateness of the FE model and POOL model. If the P value of the F test is less than 0.05, the FE model is better than the POOL model; otherwise, the pool model is more suitable. Similarly, the Hausman test is used to compare the FE model and RE model, and the BP test is used to compare the RE model and POOL model.
Because previous studies have shown that natural factors and socio-economic factors have significant influences on cultivated land landscapes, this study introduced control variables into the regression analysis. From the perspective of natural influences, topographic indicators play important roles (Liang et al., 2020). Therefore, this study calculated the average slope (AS) and average elevation (RE) based on digital terrain data. In addition, the economic indicators were also highly correlated with the cultivated land landscape (Jiang et al., 2019). We chose the rural residential disposable per capita income (RDI) and primary industry proportion (PIP) as the economic indicators to represent the impact of rural economic development. Previous studies also illustrated that the spatial pattern of roads would promote cultivated land fragmentation (Liu et al., 2019; Zhang et al., 2020). Thus, this study took road density (RD) as the transportation indicator.
As Table 2 shows, the average slope and average elevation of each research sample were nearly unchanged from 2005 to 2015. The minimum value of the average slope was 2.1° in Tongxiang, which is part of the Yangtze River Delta Plain; and the maximum value was 25.53° in Jingning, which is located in the Donggong Mountainous area. The average elevation of all research samples was 214.38 m while the minimum elevation was only 7.58 m. The average PIP gradually decreased from 2005 to 2010 and then remained stable from 2010 to 2015. Conversely, the average RD value rapidly increased from 0.99 km/km2 in 2005 to 2.78 km/km2 in 2015; and the average RDI also increased to 29177 yuan in 2015, which is almost 3.5 times that in 2005. Furthermore, the variation ranges of the RD and RDI were higher in 2015 than in 2005.
Table 2 Descriptive statistics of the control variables
Control variables Year Min. Max. Mean Standard deviation
Average slope (°) 2005, 2010, 2015 2.10 25.53 15.69 6.33
Average elevation (m) 2005, 2010, 2015 7.58 875.69 293.26 214.38
Primary industry
proportion (%)
2015 0.02 0.15 0.08 0.04
2010 0.02 0.20 0.09 0.04
2005 0.03 0.29 0.12 0.06
Road density (km/km2) 2015 0.46 2.78 1.13 0.47
2010 0.43 2.67 1.02 0.42
2005 0.22 0.99 0.51 0.20
Per capita rural
residential disposable
income (RMB yuan)
2015 12973.00 29177.00 20483.08 5508.01
2010 6010.00 15513.00 10273.64 3118.16
2005 2966.00 8542.00 5758.98 1788.75

3 Results

3.1 Spatio-temporal differentiation of cultivated land landscape index

Overall, the cultivated land landscape index of Zhejiang increased from 2005 to 2010. However, after 2010, the index became lower than the original value in 2005, as shown in Table 3. The results clearly showed that compared with the cultivated land landscape index (CLI) in stage 1 (2000-2005), arable land was affected more by human activities in stage 2 (2005-2010) and subsequently weakened. Similar to the overall variation, 36 research units had inverted V-shaped curves. Of the remaining 16 units, 9 units had a continuously decreasing CLI while three samples had a continuously increasing CLI.
Table 3 Descriptive statistics of cultivated land landscape index and rural population spatial variation
Indicator Amount Min. Max. Mean Standard deviation
RPSV in stage 1 50 -0.804 0.246 -0.468 0.271
RPSV in stage 2 50 -0.918 -0.293 -0.673 0.138
RPSV in stage 3 50 -0.854 0.986 0.185 0.596
CLI in stage 1 50 0.057 0.743 0.483 0.164
CLI in stage 2 50 0.099 0.781 0.503 0.173
CLI in stage 3 49 0.000 0.759 0.461 0.185

Note: RPSV is rural population spatial variation and CLI is cultivated land landscape index. The amount of CLI in stage 3 is 49 because of the cultivated land data missing in Zhuji.

The CLI of each research sample was found to be significantly different, regardless of the stages. Regarding the spatial distribution (Figure 2), the CLI in Zhejiang had the characteristic of a spatial agglomeration. Most of the research units with relatively higher CLIs existed in the mountainous areas, including the southwestern and western parts of Zhejiang. Conversely, the CLI of the plain area in northern Zhejiang is relatively lower. From the Jinhua-Quzhou Basin in the central region to the eastern coastal area of Zhejiang, the CLI of each unit displays a steady evolution.
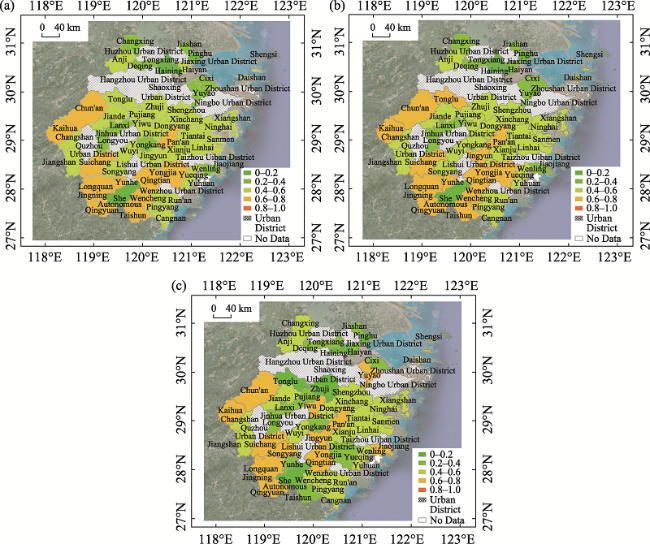
Figure 2 Cultivated land landscape index in the Zhejiang Province (a. spatial distribution of the CLI in stage 1; b. spatial distribution of the CLI in stage 2; c. spatial distribution of the CLI in stage 3)

3.2 Spatio-temporal differentiation of the RPSV

Based on the available data and Equation 6, the descriptive statistics of the RPSV of each research unit in Zhejiang are summarized in Table 2. In 2005, and 2010, the RPSV of each research unit was negative, showing an overall population decline in rural areas. The units with more population outflow were concentrated in the Hangzhou Bay, coastal, and Jinhua-Quzhou Basin areas. In 2015, approximately 36% of the research units were still experiencing a declining RPSV, but more than 60% had shown positive RPSV growth.
After 2000, there was a continuous decline in the RPSV concentrated in the mountainous area located in the Tianmu, Tiantai, and Tonggong mountains, which are all important ecological preservation zones (Figure 3). The units with a rising RPSV were mainly distributed in the northern plain, central basin, and eastern coastal areas, most of which existed around urban districts. Generally, the research units displayed regional spatial agglomeration in each stage. However, regarding diachronic spatial distribution changes, there was no specific spatial evolutionary process in Zhejiang.
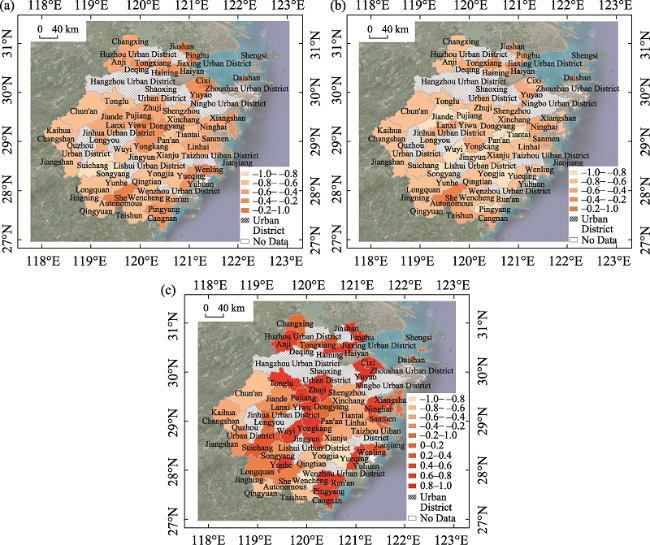
Figure 3 Spatial distribution of the rural population spatial variation in Zhejiang Province (a. Stage 1; b. Stage 2; c. Stage 3)

3.3 Regression analysis results

Using the CLI as the independent variable, this study analyzed the influences of the RVSV and control variables through three regression models. According to Table 4, the FE model did not pass the significance test (p>0.05) while the p values of the POOL model and the RE model were all equal to zero. Along with Table 4, the result of the BP test is not significant, and the p value was larger than 0.05, indicating that the POOL model is more suitable for these panel data than the RE model. Thus, the following analysis was based on the POOL model regression results.
Table 4 Results of the F test, BP test and Hausman test
Test method Related models Test results
F test FE model and POOL model F (46,94)=1.302, P=0.140
BP test RE model and POOL model χ²(1)=0.548, P=0.459
Hausman test FE model and RE model χ²(4)=4.586, P=0.332
As Table 5 shows, the RPSV was negatively and significantly related to the CLI. This means that the cultivated land in a research sample was more likely to have anthropogenic interference if the administrative unit had a lower rural population spatial variation. Among the control variables, RDI passed the significance test at the 0.1 significance level. The coefficient of RDI was greater than zero, illustrating that the impact of rural residential disposable income was positive. Furthermore, AS was also positively and significantly related to the CLI, as well as PIP. However, AE and RD were not significantly associated with the CLI because their coefficients did not pass the significance test.
Table 5 Results of the regression models
Variables POOL model FE model RE model
Intercept 0.117 (1.952*) 0.341 (3.600***) 0.109 (1.775*)
RPSV -0.075 (-2.687***) -0.061 (-1.882*) -0.073 (-2.655***)
RDI 0.000 (1.873*) 0.000 (0.508) 0.000 (1.699*)
AS 0.016 (4.216***) 0.050 (1.043) 0.016 (4.065***)
AE 0.000 (0.544) 0.583 (0.957) 0.000 (0.428)
RD -0.022 (-0.625) 0.000 (0.000***) -0.012 (-0.354)
PIP 0.420 (1.851*) 0.000 (0.000***) 0.421 (1.738*)
0.544 0.069 0.503
Adjust R² 0.525 -0.446 0.482
Test F (6140)=27.842, P=0.000 F (4,94)=1.750, P=0.145 χ²(6)=141.826, P=0.000

Note: *, **, and *** are significant at 0.1, 0.05, and 0.001, respectively; the number within () is the t value.

4 Discussion

From 2000 to 2010 (stages 1 and 2), most of the county-level administrative units in Zhejiang experienced rural population decreases, and there were more rural areas with a net population outflow than inflow. Furthermore, the average cultivated land landscape index exhibited an upward trend, increasing from 0.48 in 2005 to 0.50 in 2010. After 2010, more than 60% of the total county-level administrative units showed a significant change in their rural population flow trend. However, 19 counties showed spatial agglomeration features with negative RSPV values in stage 3. The main reason for this spatial pattern is the topography, which was also significantly related to the CLI in the POOL regression model. Combining Figures 2 and 4, the counties with relatively large average slopes tend to have more complex cultivated land landscapes. Farmers who lived in those mountainous counties always used the terrace system, which involved small pieces and were separated compared to the paddy fields in the plain areas, as the main method for cultivating land. Although the terrace system is the invention of ancient farmer wisdom, it is unable to adapt to modern large-scale agricultural cultivation, leading to relatively lower agricultural income in those counties (RDI).
Compared to the mountainous counties, the research samples with small average slopes experienced less population outflow. The main reason for this phenomenon was bottom-up industrialization. In those counties, small- and medium-sized enterprises (SMEs) played leading roles during the industrialization process (Zhou et al., 2013; Xiang et al., 2019). Similar to the industrial parks developed in urban districts, SMEs gathered rapidly in small towns, forming economic agglomeration areas by cooperating with professional markets. However, these massive economic agglomeration areas did not appear in every research unit but were rather concentrated in the northern and eastern coastal areas of Zhejiang, represented by the “Wenzhou mode” (Lin et al., 2019). Some studies suggested that SMEs provided many local nonagricultural jobs for rural residents, and a portion of these SMEs did not engage in agriculture, nor did they move to large cities. Instead, they chose to work in the industrial sector in the surrounding small towns and lived in the original rural area (Zhu, 2015). Although this could not completely reverse the outflow of the rural population, it could moderately reduce the outflow amount in stages 1 and 2. Because the main employment sector in rural areas has changed from agriculture to industry, cultivated land is no longer the most important means of production for rural residents. Rural residents preferred to transfer the use rights of unused farmland to agricultural companies or specialized agricultural households through the market-oriented land transfer system (Ye, 2015). For a specific cultivated land area, the concentration of main bodies of agricultural production would greatly improve the land-use efficiency while the standardized production mode of modern agriculture could also promote anthropogenic interference with the cultivated lands (Chen, 2019). For example, the natural spatial distribution of cultivated lands will be gathered, and the irregular shapes of original farmlands will be geometrized to adapt to large-scale mechanical farming. Therefore, this part of the counties, which are located in the coastal areas and basin areas in Zhejiang, was more likely to have a higher per capita rural residential income (RDI) and proportion of primary industry (PIP) and to have a relatively strong anthropogenic impact on cultivated lands.
Furthermore, some county-level units had a positive RPSV after 2010 (stage 3), and most of them aggregated around the metropolitan districts of Hangzhou, Ningbo, Wenzhou, and Jinhua-Yiwu metropolitan areas. Due to the urban function spillover effect, the industrial sectors in these counties have been further developed, providing more jobs for the local people to attract more migrant workers to return home for employment (Zhang et al., 2017). However, the rural areas in those counties become leisure tourism destinations for citizens who live in urban districts (Gao et al., 2017; Xu et al., 2018). Rural tourism has not only attracted the original outflow of registered rural residents to return and start their own businesses, but it has also absorbed the original agricultural labor force into the service industry (Gao et al., 2020). The emergence of leisure tourism in rural areas has further changed the employment structure of rural residents and improved the RDI; however, rural tourism development and rural construction land expansion has aggravated human disturbances to cultivated lands, especially some rural tourism facilities directly occupying cultivated lands.

5 Conclusion

It is a long-term task to preserve the cultivated lands in China. After the Chinese central government proposed a strict target amount of cultivated land preservation, how to improve the cultivated land utilization efficiency is a critical issue. Previous studies clearly illustrated that the spatial distribution and landscape features of lands were highly correlated with land use efficiency, and the influencing factors also varied. This study focused on the relationship between cultivated land landscape characteristics and rural population variation to explore human anthropogenic disturbances to cultivated land from a spatial perspective. Based on Landscan data, we evaluated the population spatial variation in rural areas to replace the population scale indicator to express the rural population changes in the research samples. The empirical evaluation results showed that the rural population of 50 county-level administrative units in Zhejiang decreased from 2000 to 2010 while 19 counties had more rural population inflow areas than outflow areas after 2010. Using the CLI indicator as the independent variable and five socio-economic factors as the control variables, the regression results of the POOL model showed that the RPSV had a significant and negative influence on the farmland Landscape metrics. The cultivated land in the research samples with a larger rural population variation seems to have relatively less anthropogenic disturbance. In addition, the rural residential disposal income, the average slope, and the proportion of primary industry were all positively and significantly related to the CLI.
The empirical results implied that the variation in the rural population does have a significant impact on cultivated land use efficiency. However, the reasons for this influence vary in different regions. For counties with more rural population outflow areas, the loss of the agricultural labor force and the difficulty of sloped farmlands adapting to mechanized farming were unconducive to land use efficiency improvement. However, the research samples with more rural population inflow areas also had to face the problem that the increase in nonagricultural production activities in rural areas would increase the difficulty of cultivated land protection. Thus, local governments must pay more attention to farmland utilization efficiency improvements adapted to their own developmental conditions. For the former counties mentioned above, the key point of land protection is how to improve the production efficiency of fragmented land through modern agricultural techniques, thereby reducing the amount of abandoned farmland. For the latter counties mentioned above, local governments should strengthen the construction control of housing and facilities in rural areas.
Our study still has some limitations that provide potential directions for future research. First, previous studies have made considerable achievements regarding the impact of land systems on cultivated land preservation (Wu et al., 2017; Wang et al., 2010). However, it is difficult to incorporate political indicators into our empirical regression model because such types of basic data are difficult to obtain. Future studies focused on the influence of politics on cultivated lands could use some specific protection policies as the events and apply the difference-in-differences method to analyze the actual impacts of preservation policy. Second, this study focused on cultivated land preservation from a topographic perspective, regardless of the productive ability or pollution of the land. Although each of those research fields was fully studied, future works could pay attention to the comprehensive capacity of cultivated lands considering the spatial characteristics and quality of the land.
[1]
Chen C R, 2019. Untitled land, occupational choice, and agricultural productivity. American Economic Journal: Macroeconomics, 9(4): 91-121.

[2]
Chien S S, 2015. Local farmland loss and preservation in China: A perspective of quota territorialization. Land Use Policy, 49: 65-74.

DOI

[3]
Gao C L, Cheng L, 2020. Tourism-driven rural spatial restructuring in the metropolitan fringe: An empirical observation. Land Use Policy, 95: 104609.

DOI

[4]
Gao J, Wu B, 2017. Revitalizing traditional villages through rural tourism: A case study of Yuanjia Village, Shaanxi Province, China. Tourism Management, 63: 223-233.

DOI

[5]
Han H B, Zhang X Y, 2020. Exploring environmental efficiency and total factor productivity of cultivated land use in China. Science of The Total Environment, 726: 138434.

DOI

[6]
Hao P, Sliuzas R, Geertman S, 2011. The development and redevelopment of urban villages in Shenzhen. Habitat International, 35(2): 214-224.

DOI

[7]
Jiang G H, Zhang R J, Ma W Q et al., 2017 Cultivated land productivity potential improvement in land consolidation schemes in Shenyang, China: Assessment and policy implications. Land Use Policy, 68: 80-88.

DOI

[8]
Jiang L, Guo S, Wang G et al., 2020a. Changes in agricultural land requirements for food provision in China 2003-2011: A comparison between urban and rural residents. Science of the Total Environment, 725: 138293.

DOI

[9]
Jiang P H, Li M C, Liang C, 2020b. Dynamic response of agricultural productivity to landscape structure changes and its policy implications of Chinese farmland conservation. Resources Conservation and Recycling, 156: 104724.

DOI

[10]
Jiang P H, Li M C, Lv J C, 2019. The causes of farmland landscape structural changes in different geographical environments. Science of The Total Environment, 685: 667-680.

DOI

[11]
Li Y H, Westlund H, Liu Y S, 2019. Why some rural areas decline while some others not: An overview of rural evolution in the world. Journal of Rural Studies, 68: 135-143.

DOI

[12]
Li Y R, Liu Y S, Long H L et al., 2014. Community-based rural residential land consolidation and allocation can help to revitalize hollowed villages in traditional agricultural areas of China: Evidence from Dancheng County, Henan Province. Land Use Policy, 39: 188-198.

DOI

[13]
Liang X Y, Li Y B, Ran C H et al., 2020. Study on the transformed farmland landscape in rural areas of southwest China: A case study of Chongqing. Journal of Rural Studies, 76: 272-285.

DOI

[14]
Lin S N, Li Z G, 2019. City profile: Wenzhou - A model city of transitional China. Cities, 95: 102393.

DOI

[15]
Liu J, Jin X B, Xu W Y et al., 2019. Influential factors and classification of cultivated land fragmentation, and implications for future land consolidation: A case study of Jiangsu Province in eastern China. Land Use Policy, 88: 104185.

DOI

[16]
Liu L, Xu X, Chen X, 2014. Assessing the impact of urban expansion on potential crop yield in China during 1990-2010. Food Security, (7): 33-43.

[17]
Liu X W, Zhao C L, Song W, 2017. Review of the evolution of cultivated land protection policies in the period following China’s reform and liberalization. Land Use Policy, 67: 660-669.

DOI

[18]
Liu Z, Liu S H, Jin H R et al., 2017. Rural population change in China: Spatial differences, driving forces and policy implications. Journal of Rural Studies, 51: 189-197.

DOI

[19]
Long H L, Li Y R, Liu Y S et al., 2012. Accelerated restructuring in rural China fueled by ‘increasing vs. decreasing balance’ land-use policy for dealing with hollowed villages. Land Use Policy, 29(1): 11-22.

DOI

[20]
Lu X, Huang X J, Zhong T Y et al., 2011. Review on the research of farmland fragmentation in China. Journal of Natural Resources, 26: 530-540. (in Chinese)

[21]
Mandelbrot B, 1983. The Fractal Geometry of Nature. New York: W. H. Freeman and Co., 460.

[22]
O’Neill R V, Krummel J R, Gardner R H et al., 1988. Indices of landscape pattern. Landscape Ecology, 1: 153-162.

DOI

[23]
Pei H, Wei Y, Wang X et al., 2014. Method of cultivated land landscape ecological security evaluation and its application. Transactions of the CSAE, China, 30(9): 212-219. (in Chinese)

[24]
Shannon C E, Weaver W, 1962. The Mathematical Theory of Communication. Urbana: University of Illinois Press, IL. I25.

[25]
Skinner W K, Kuhn G R, Joseph A E, 2001. Agricultural land protection in China: A case study of local governance in Zhejiang Province. Land Use Policy, 18(4): 329-340.

DOI

[26]
Sklenicka P, 2016. Classification of farmland ownership fragmentation as a cause of land degradation: A review on typology, consequences, and remedies. Land Use Policy, 57: 694-701.

DOI

[27]
Sklenicka P, Salek M, 2008. Ownership and soil quality as sources of agricultural land fragmentation in highly fragmented ownership patterns. Landscape Ecology, 23: 299-311.

DOI

[28]
Song W, 2014. Decoupling cultivated land loss by construction occupation from economic growth in Beijing. Habitat International, 43: 198-205.

DOI

[29]
Tischendorf L, 2001. Can landscape indices predict ecological processes consistently? Landscape Ecology, 16: 235-254.

DOI

[30]
Wang H, Tao R, Wang L L et al., 2010. Farmland preservation and land development rights trading in Zhejiang, China. Habitat International, 34(4): 454-463.

DOI

[31]
Wang X, Xin L, Tan M et al., 2020. Impact of spatiotemporal change of cultivated land on food-water relations in China during 1990-2015. Science of The Total Environment, 716: 137119.

DOI

[32]
Wang Y H, Li X B, Xin L J et al., 2020. Farmland marginalization and its drivers in mountainous areas of China. Science of The Total Environment, 719: 135132.

DOI

[33]
Wu Y Z, Shan L P, Guo Z et al., 2017. Cultivated land protection policies in China facing 2030: Dynamic balance system versus basic farmland zoning. Habitat International, 69: 126-138.

DOI

[34]
Xiang D, Chen J K, Tripe D et al., 2019. Family firms, sustainable innovation and financing cost: Evidence from Chinese hi-tech small and medium-sized enterprises. Technological Forecasting and Social Change, 144: 499-511.

DOI

[35]
Xiao R, Liu Y, Huang X, 2018. Exploring the driving forces of farmland loss under rapid urbanization using binary logistic regression and spatial regression: A case study of Shanghai and Hangzhou Bay. Ecological Indicators, 95: 455-467.

DOI

[36]
Xu H G, Huang X Y, Zhang Q F, 2018. Tourism development and local borders in ancient villages in China. Journal of Destination Marketing & Management, 9: 330-339.

[37]
Yan F, Zhang S, Kuang W et al., 2016. Comparison of cultivated landscape changes under different management modes: A case study in Sanjiang Plain. Sustainability, 8(10): 16.

DOI

[38]
Yang H, Li X B, 2000. Cultivated land and food supply in China. Land Use Policy, 17(2): 73-88.

DOI

[39]
Ye J Z, 2015. Land transfer and the pursuit of agricultural modernization in China. Journal of Agrarian Change, 15(3): 314-337.

DOI

[40]
York A M, Shrestha M, Boone C G et al., 2011. Land fragmentation under rapid urbanization: A cross-site analysis of southwestern cities. Urban Ecosystems, 14(3): 429-455.

DOI

[41]
Yu D, Wang D Y, Lin W B et al., 2018. Decreased landscape ecological security of peri-urban cultivated land following rapid urbanization: An impediment to sustainable agriculture. Sustainability, 10: 394.

DOI

[42]
Yu M, Yang Y J, Chen F et al., 2019. Response of agricultural multifunctionality to farmland loss under rapidly urbanizing processes in Yangtze River Delta, China. Science of The Total Environment, 666: 1-11.

DOI

[43]
Yu X W, Zhuo Y, Liu H et al., 2020. Degree of desertification based on normalized landscape index of sandy lands in Inner Mongolia, China. Global Ecology and Conservation, 23: e01132.

DOI

[44]
Zeng H, Yu X F, Zhang J F, 2019. Urban village demolition, migrant workers' rental costs and housing choices: Evidence from Hangzhou, China. Cities, 94: 70-79.

DOI

[45]
Zhang R J, Jiang G H, Zhang Q, 2019. Does urbanization always lead to rural hollowing? Assessing the spatio-temporal variations in this relationship at the county level in China 2000-2015. Journal of Cleaner Production, 220: 9-22.

DOI

[46]
Zhang T, Zhu Y, Lin L Y, 2017. The residential location choices of returned migrant workers in the context of local urbanization: A case study of Yongcheng City in Henan Province. Economic Geography, 37(4): 84-91. (in Chinese)

[47]
Zhang X Y, Cai Z L, Li G E et al., 2020. Assessment of determinants of cultivated land fragmentation and its impacts on rural income. Science of Surveying and Mapping, 45: 134-141. (in Chinese)

[48]
Zhong T Y, Huang X J, Zhang X Y et al., 2011. Temporal and spatial variability of agricultural land loss in relation to policy and accessibility in a low hilly region of southeast China. Land Use Policy, 28: 762-769.

DOI

[49]
Zhou J H, Yan Z, Wang Y, 2013. Improving quality and safety of aquatic products: A case study of self-inspection behavior from export-oriented aquatic enterprises in Zhejiang Province, China. Food Control, 33(2): 528-535.

DOI

[50]
Zhou Z X, Li J, 2015. The correlation analysis on the landscape pattern index and hydrological processes in the Yanhe watershed, China. Journal of Hydrology, 524: 417-426.

DOI

[51]
Zhu Y, 2015. In situ urbanization in China: Processes, contributing factors, and policy implications. Background paper for the World Migration Report 2015: Migrants and Cities: New Partnerships to Manage Mobility. IOM, Geneva.

Outlines

/