
Journal of Geographical Sciences >
Recent signal and impact of wet-to-dry climatic shift in Xinjiang, China
|
Yao Junqiang (1987-), Associate Professor, specialized in climate change and water cycle. E-mail: yaojq1987@126.com; yaojq@idm.cn |
Received date: 2021-05-06
Accepted date: 2021-07-16
Online published: 2021-11-25
Supported by
National Key Research and Development Program of China(2019YFA0606902)
National Natural Science Foundation of China(41975146)
National Natural Science Foundation of China(41971023)
Copyright
The Xinjiang region of China is among the most sensitive regions to global warming. Based on the meteorological and hydrological observation data, the regional wet-to-dry climate regime shifts in Xinjiang were analyzed and the impacts of climatic shift on the eco-hydrological environment of Xinjiang were assessed in this study. The results showed that temperature and precipitation in Xinjiang have increased since the mid-1980s, showing a warming-wetting trend. However, drought frequency and severity significantly increased after 1997. The climate of Xinjiang experienced an obvious shift from a warm-wet to a warm-dry regime in 1997. Since the beginning of the 21st century, extreme temperatures and the number of high temperature days have significantly increased, the start date of high temperature has advanced, and the end date of high temperature has delayed in Xinjiang. In addition, the intensity and frequency of extreme precipitation have significantly increased. Consequently, regional ecology and water resources have been impacted by climatic shift and extreme climate in Xinjiang. In response, satellite-based normalized difference vegetation index showed that, since the 1980s, most regions of Xinjiang experienced a greening trend and vegetation browning after 1997. The soil moisture in Xinjiang has significantly decreased since the late 1990s, resulting in adverse ecological effects. Moreover, the response of river runoff to climatic shift is complex and controlled by the proportion of snowmelt to the runoff. Runoff originating from the Tianshan Mountains showed a positive response to the regional wet-to-dry shift, whereas that originating from the Kunlun Mountains showed no obvious response. Both climatic shift and increased climate extremes in Xinjiang have led to intensification of drought and aggravation of instability of water circulation systems and ecosystem. This study provides a scientific basis to meet the challenges of water resource utilization and ecological risk management in the Xinjiang region of China.
Key words: climatic shift; wet-to-dry; water resources; drought; Xinjiang
YAO Junqiang , MAO Weiyi , CHEN Jing , DILINUER Tuoliewubieke . Recent signal and impact of wet-to-dry climatic shift in Xinjiang, China[J]. Journal of Geographical Sciences, 2021 , 31(9) : 1283 -1298 . DOI: 10.1007/s11442-021-1898-9
Table 1 Drought classifications of SPEI |
| Category | Index value |
|---|---|
| Extremely wet | SPEI≥2 |
| Moderately wet | 1.5≤SPEI<1.99 |
| Slightly wet | 1≤SPEI<1.49 |
| Near normal | -0.99<SPEI<0.99 |
| Mild drought | -1.49<SPEI≤-1 |
| Moderate drought | -1.99<SPEI≤-1.5 |
| Extreme drought | SPEI≤-2 |
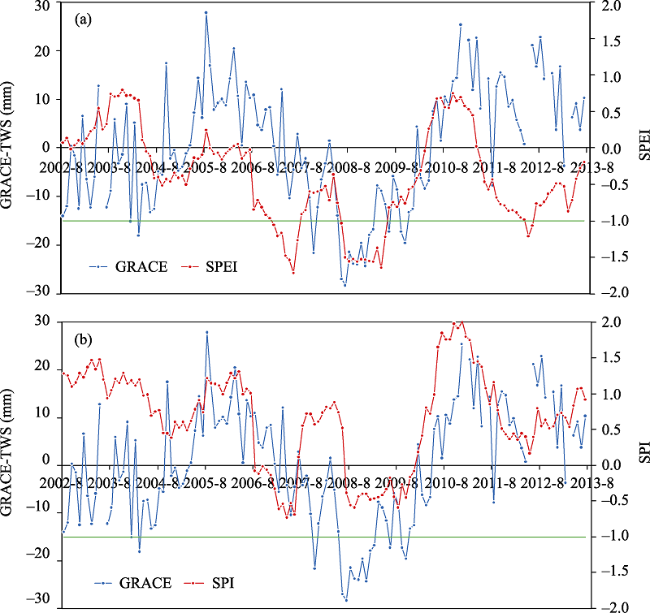
Figure 1 Comparison of the GRACE-TWS and 12-month SPI (a) and SPEI (b) over Xinjiang, China (The green line represents the SPEI or SPI value that was -1, and a threshold value of -1 was used to determine drought condition) |
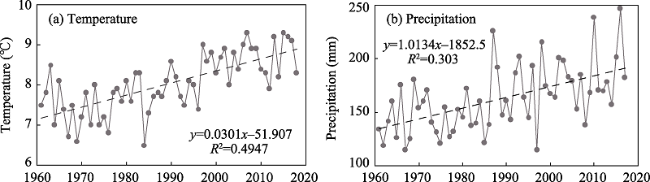
Figure 2 Changes of mean annual temperature (a) and annual total precipitation (b) during 1961-2018 over Xinjiang, China |
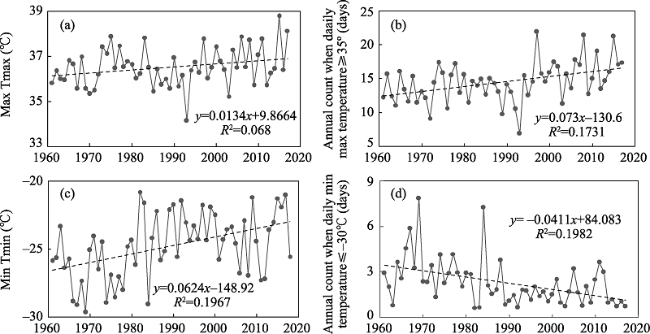
Figure 3 Changes of the Max Tmax (a. ℃), annual count when daily max temperature ≥35℃ (b. days), Min Tmin (c. ℃), annual count when daily minimum temperature ≤-30℃ (d. days) during 1961-2018 over Xinjiang, China |
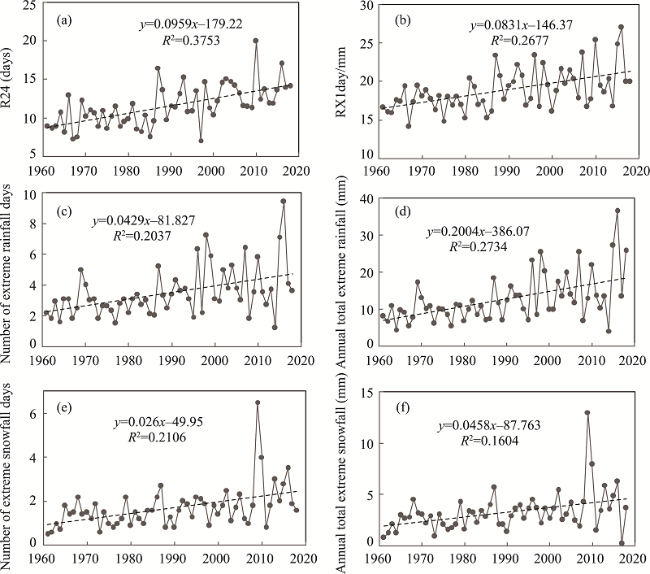
Figure 4 Changes of the R24 (a. days), RX1day (b. mm), number of extreme rainfall days (c. days), annual total extreme rainfall (d. mm), number of extreme snowfall days (e. days), and annual total extreme snowfall (f. mm) during 1961-2018 over Xinjiang, China |
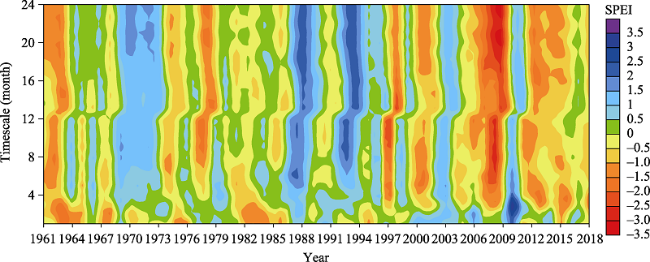
Figure 5 Hovmoller-type diagrams for the temporal variability of the SPEI at different timescales (1 to 24 months) during 1961-2018 over Xinjiang, China |
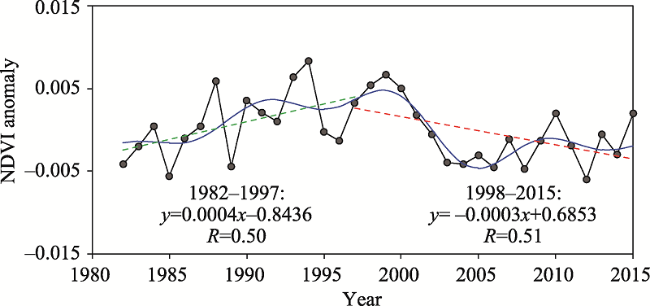
Figure 6 Temporal variation of the average NDVI over Xinjiang from 1982 to 2015 (The dotted represents the trends of different periods. Blue line represents the lowpass filter result) |
Table 2 Mean value and tendency of soil moisture at each depth (0-50 cm) over Xinjiang from 1961 to 2010 |
| Depth (cm) | 0-50 | 0-10 | 10-20 | 20-30 | 30-40 | 40-50 |
|---|---|---|---|---|---|---|
| Mean value (%) | 11.3 | 9.5 | 10.7 | 11.5 | 12.0 | 12.9 |
| Trend (%/10a) | -3.8 | -3.6 | -4.0 | -3.5 | -3.0 | -2.3 |
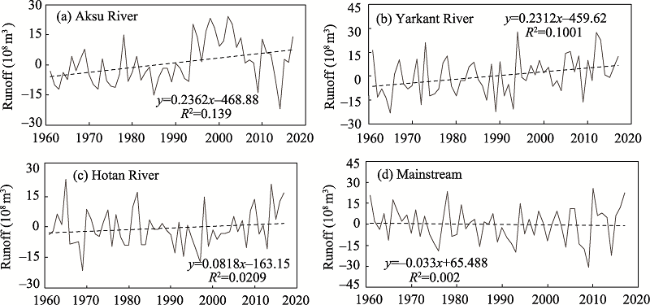
Figure 7 Changes of the annual runoff anomaly over the Tarim River Basin during 1961-2017 (a. Aksu River; b. Hotan River; c. Yarkant River; d. Mainstream) |
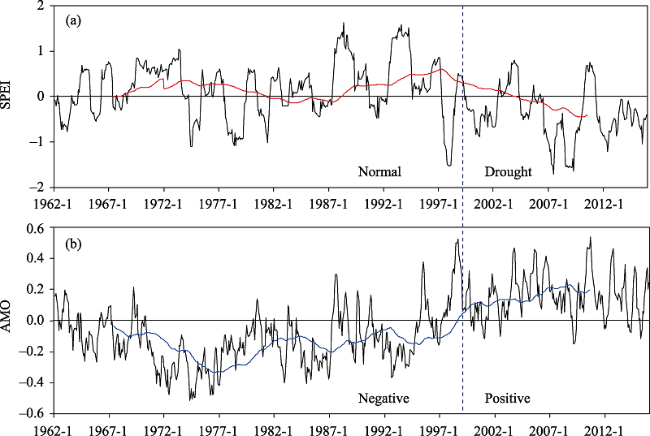
Figure 8 Relationship between the 12-month SPEI (a. red line indicates the 121-month smoothed SPEI index) and the Atlantic Multidecadal Oscillation (AMO) index (b. blue line indicates the 121-month smoothed AMO index) for 1962-2015 |
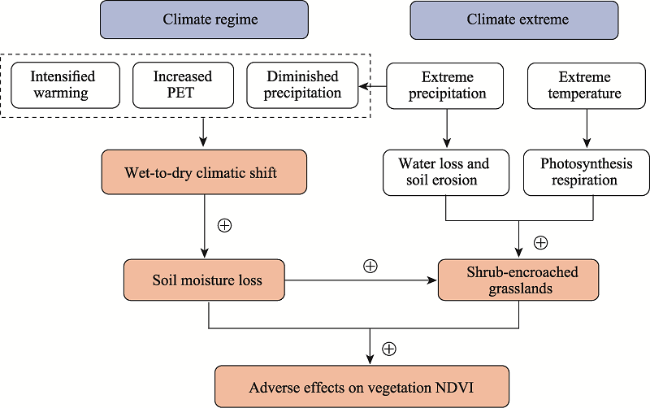
Figure 9 Schematic representation of processes for impacts of climatic regime shift and climate extreme on vegetation growth change in Xinjiang. Circled symbols of ‘+’ represent a positive sign of impact, respectively. |
| [1] |
|
| [2] |
|
| [3] |
|
| [4] |
|
| [5] |
|
| [6] |
|
| [7] |
|
| [8] |
|
| [9] |
|
| [10] |
|
| [11] |
|
| [12] |
|
| [13] |
|
| [14] |
|
| [15] |
|
| [16] |
|
| [17] |
|
| [18] |
|
| [19] |
|
| [20] |
|
| [21] |
|
| [22] |
|
| [23] |
|
| [24] |
|
| [25] |
|
| [26] |
|
| [27] |
|
| [28] |
|
| [29] |
|
| [30] |
|
| [31] |
|
| [32] |
|
| [33] |
|
| [34] |
|
| [35] |
|
| [36] |
|
| [37] |
|
| [38] |
|
| [39] |
|
| [40] |
|
| [41] |
|
/
| 〈 |
|
〉 |