Research Articles

Intensified risk to ecosystem productivity under climate change in the arid/humid transition zone in northern China

  • YIN Yunhe , 1 ,
  • DENG Haoyu 1 ,
  • MA Danyang 2 ,
  • WU Shaohong , 1, 3, *
Expand
  • 1. Key Laboratory of Land Surface Pattern and Simulation, Institute of Geographic Sciences and Natural Resources Research, CAS, Beijing 100101, China
  • 2. Henan Province Development and Reform Commission, Zhengzhou 450018, China
  • 3. University of Chinese Academy of Sciences, Beijing 100049, China
* Wu Shaohong (1961-), Professor, specialized in physical geography. E-mail:

Yin Yunhe (1979-), Professor, specialized in climate change impact and risk. E-mail:

Received date: 2020-09-22

  Accepted date: 2021-05-31

  Online published: 2021-11-25

Supported by

National Key R&D Program of China(2018YFC1508805)

The Strategic Priority Research Program of Chinese Academy of Sciences(XDA20020202)

The Strategic Priority Research Program of Chinese Academy of Sciences(XDA19040304)

Copyright

Copyright reserved © 2021. Office of Journal of Geographical Sciences All articles published represent the opinions of the authors, and do not reflect the official policy of the Chinese Medical Association or the Editorial Board, unless this is clearly specified.

Abstract

Assessing the climate change risk faced by the ecosystems in the arid/humid transition zone (AHTZ) in northern China holds scientific significance to climate change adaptation. We simulated the net primary productivity (NPP) for four representative concentration pathways (RCPs) using an improved Lund-Potsdam-Jena model. Then a method was established based on the NPP to identify the climate change risk level. From the midterm period (2041-2070) to the long-term period (2071-2099), the risks indicated by the negative anomaly and the downward trend of the NPP gradually extended and increased. The higher the scenario emissions, the more serious the risk. In particular, under the RCP8.5 scenario, during 2071-2099, the total risk area would be 81.85%, that of the high-risk area would reach 54.71%. In this high-risk area, the NPP anomaly would reach -96.00±46.95 gC·m-2·a-1, and the rate of change of the NPP would reach -3.56±3.40 gC·m-2·a-1. The eastern plain of the AHTZ and the eastern grasslands of Inner Mongolia are expected to become the main risk concentration areas. Our results indicated that the management of future climate change risks requires the consideration of the synergistic effects of warming and intensified drying on the ecosystem.

Cite this article

YIN Yunhe , DENG Haoyu , MA Danyang , WU Shaohong . Intensified risk to ecosystem productivity under climate change in the arid/humid transition zone in northern China[J]. Journal of Geographical Sciences, 2021 , 31(9) : 1261 -1282 . DOI: 10.1007/s11442-021-1897-x

1 Introduction

The problem of climate change, which is characterized by global warming, is becoming increasingly prominent. Climate change risk is a severe challenge facing the development of human society (Wei et al., 2014; Qin, 2015; Urban, 2015; Ding, 2018), especially the problems caused by systemic risks and sudden events (Liu et al., 2019). The terrestrial ecosystem is a life support system that human society depends on for survival and development. It plays an irreplaceable role in maintaining global ecological security and in protecting the Earth's ecological environment. In the context of global warming, the key climatic conditions that drive ecosystem response vary (Diffenbaugh et al., 2013; IPCC, 2013). The types, composition, distribution, phenological periods, productivity, and carbon pools of ecosystems are all significantly affected by climate change (Seddon et al., 2016; Piao et al., 2017; Richardson et al., 2018). Under the future scenario that the temperature and the frequency of extreme climate events continue to increase, climate change may intensify the potential risks to the carbon storage, biodiversity, water resources, and production functions of ecosystems (IPCC, 2014; Asmus et al., 2019; Xu et al., 2019; Chen et al., 2020).
Although the characteristics of future climate change are uncertain, the impact of climate change on vegetation productivity and the associated risks have received widespread attention. In the risk assessment of the vegetation response to climate change, the loss of ecosystem net primary productivity (NPP) is a key indicator that reflects the comprehensive impact of key climate variables on the structure and function of the ecosystem. The NPP reflects the growth status of the vegetation and the ability of vegetation to fix and convert photosynthetic products (Yu et al., 2013), and thus, it is an important factor in ecological processes and ecosystem carbon cycles (Steffen et al., 1998; Wu et al., 2011). Rising temperatures are likely to increase the NPP of forests in high-latitude and alpine regions (Andreu-Hayles et al., 2011), while the increase in the reference evapotranspiration caused by warming and the lack of soil water may reduce the NPP of tropical forests (Fung et al., 2005). Climate change, especially extreme weather events, may cause increased tree mortality or large-scale forest death, thereby reducing the forest NPP (Allen et al., 2010; Littell et al., 2010). Under future climate change scenarios, large-scale forest death may occur in the global cold-temperate transition zone as a result of high temperatures and drought stress (Heyder et al., 2011). Warming and drought events may reduce the NPP of tropical and subtropical forests, and it may even reduce the NPP of global terrestrial ecosystems under higher emission scenarios (Pan et al., 2014; Gang et al., 2017). By incorporating comprehensive indicators such as the NPP and moisture into the risk assessment, it has been found that the high-risk areas of China’s ecosystem would be distributed primarily in the Qinghai-Tibet Plateau and would extend from the Qinghai-Tibet Plateau to northeastern China by the end of the 21st century (Yin et al., 2016). Climate change risk research on existing ecosystems has made important progress in terms of index selection and threshold discrimination, but most studies have ignored the role of key index trends in climate change risk assessment.
The arid/humid transition zone (AHTZ) refers to the transition zone between the humid region to the arid region (Wang et al., 2017). It is located in the marginal area of the East Asian monsoon zone in China and is also the main distribution area of the agro-pastoral transition zone, which is sensitive to climate fluctuations (Zhang et al., 1997; Lin et al., 2012). The ecosystems in this climate transition zone have become unstable in response to human and natural disturbances. Research on the interactions between climate and ecology in the transition zone is extremely important for understanding global changes (Fu, 1992). The typical natural vegetation types distributed in the AHTZ are mainly forest grasslands in the sub-humid areas and grasslands and meadow grasslands in the semi-arid areas (Zheng, 2008). As a result of global warming, the AHTZ has suffered more severe natural disasters, and the risks of land degradation and desertification also have increased (Reynolds et al., 2007; Mao et al., 2015). Therefore, the AHTZ is a climatic and ecological transition region where the response of the vegetation to global change is sensitive and complex, and it is unique in terms of its climate change response and risk research.
This study used multi-model and multi-scenario climate data to assess the future climate change risks of ecosystem productivity in the AHTZ in northern China. The results of this research improved our understanding of the interactions between vegetation and climate and provided an important basis for accurately predicting climate change risks and possible future changes in terrestrial ecosystems. The results also provided a scientific basis for formulating regional adaptation strategies to respond to climate change, strengthening ecological restoration and protection, and promoting sustainable development.

2 Materials and methods

2.1 Study area

In this study, we used the ratio of the annual reference evapotranspiration (ETO), which was determined using the Penman-Monteith method (Yin et al., 2018b), to the annual precipitation (P) to calculate the aridity index (AI). Because of the significant differentiation of the plateau alpine land surface system, this study focuses on the other regions of China besides the Tibetan Alpine zone, according to the eco-geographical regionalization of China (Zheng, 2008). Then, we used the AI as an indicator to measure the regional moisture conditions and to divide the regions in China based on their climatic humidity (Wu et al., 2005; Zheng, 2008). On the basis of the multiannual mean value of the AI during 1982-2010, we selected the continuous distribution area of the sub-humid (1.0 ≤ AI < 1.5) and semi-arid regions (1.5 ≤ AI < 4.0) in northern China as the AHTZ study area (98.87-128.04°E, 33.04- 53.29°N) (Figure 1).
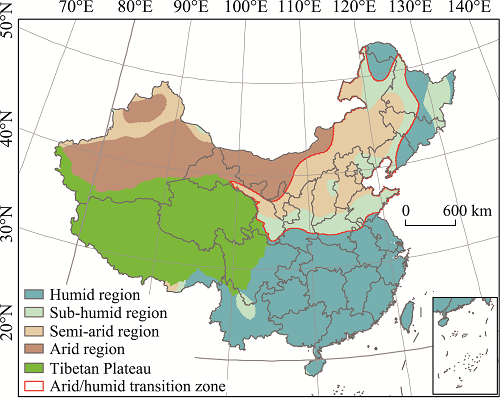
Figure 1 Location of the arid/humid transition zone in northern China
The total area of the study area is approximately 196.75 × 10⁴ km2, and the altitude of most of the area is less than 1500 m, accounting for 20.71% of China’s land area. The AHTZ extends from the Greater Hinggan Mountains to the east of the Qinghai-Tibet Plateau and the north of the Qinling Mountains-Huaihe River. The roughly NE-SW trending AHTZ covers the eastern Inner Mongolia Plateau, the Loess Plateau, the Songnen Plains, and the northern part of the North China Plain. From the coast to the inland area, the temperature zones gradually change from a warm temperate zone to a mid-temperate zone, and the degree of humidity gradually decreases. The northern agriculture-pastoral transition zone, located at the southeastern edge of the Inner Mongolia Plateau and the northern part of the Loess Plateau, has a typical temperate semi-arid continental monsoon climate, with large variations in the interannual precipitation.

2.2 Climate projections

Multimodel ensemble (MME) projections and climate change scenario analysis are effective methods to predict the future situations of ecosystems and their responses to global changes. In this study, we used the multi-model datasets for five general circulation models (GCMs) (i.e., the HadGEM2-ES, IPSL-CM5A-LR, GFDL-ESM2M, MIROC-ESMCHEM, and NorESM1- M models) from the Coupled Model Intercomparison Project Phase 5 (CMIP5). The data were provided by the ISI-MIP (Taylor et al., 2012; Warszawski et al., 2014). The model output results were downscaled and bias-corrected by the Inter-Sectoral Impact Model Intercomparison Project (ISI-MIP) with a spatial resolution of 0.5° × 0.5°. The climate variables simulated by the models included the mean temperature, maximum temperature, minimum temperature, precipitation, shortwave radiation, wind speed, and relative humidity. In this study, we used the MME means of the five GCMs and assumed the models to be independent and to have been given equal weights. The MME method usually provides better results than the individual models in the simulations of climates, globally or regionally (Pierce et al., 2009; Zhao et al., 2014). Studies have shown that the MME means of climatic factors such as temperature and precipitation are similar to observed values (Yin et al., 2015), and thus, the model results can be used to predict the risk of future climate change in the ATHZ. We adopted two time periods for the future risk assessment: a midterm period (2041-2070) and a long-term period (2071-2099) (Thibeault et al., 2014).
We used representative concentration pathway (RCP) 2.6, RCP4.5, RCP6.0, and RCP8.5 as the climate change scenarios. These four emission scenarios represented radiative forcing levels of 2.6, 4.5, 6.0, and 8.5 W/m2 in 2100, respectively. It can be seen that the radiative forcing under the RCP8.5 scenario, which was approximately equivalent to an atmospheric CO2 concentration reaching 1370 ppm in 2100, was higher than those under the other three scenarios (Moss et al., 2010).

2.3 Climate change risk classification

2.3.1 Risk evaluation indicators and classification standards
When using risk analysis methods to describe and characterize the impact of future climate change, it is necessary to identify the boundaries beyond which climate change will be considered unacceptable, that is, the dangerous climate change level proposed by the United Nations Framework Convention on Climate Change (Dessai et al., 2004; Lorenzoni et al., 2005). Determining an appropriate threshold as a risk assessment standard is a basic requirement in the risk analysis of climate change impacts. The risk standard used in this study considered two main aspects. Based on the work of Scholze et al. (2006) and Heyder et al. (2011), we took the abnormal change in the NPP below the average value minus several standard deviations and used the multiple relationships between the anomaly and standard deviation as the basis of the risk classification; we also considered the trend of the change in the NPP during the evaluation period.
First, the NPP anomalies in the future midterm and long-term periods relative to the baseline period (1981-2010) were calculated:
$\hat{x}={\bar{x}}'-\bar{x},$
Where $\hat{x}$ is the anomaly in the future period (midterm or long-term); ${\bar{x}}'$ is the multiannual mean value in the future period (midterm or long-term); and $\bar{x}$ is the multiannual mean value in the baseline period.
The term climate change risk refers to a combination of the possibility and degree of the adverse effects of climate system change on a risk-bearing body (i.e., possible loss) (Wu, 2011). Therefore, we defined a positive anomaly as no risk and defined a negative anomaly as risky. For each pixel with a negative anomaly, we calculated the standard deviation of the NPP sequence in the reference period. If the absolute value of the negative anomaly was 0 to 0.5 times, 0.5 to 1.0 times, or greater than 1.0 times of the standard deviation, the risk was judged to be low, medium, and high, respectively. The change was fitted using the least squares method, and the nonparametric Mann-Kendall trend detection method was used to test the significance (Sneyers, 1990).
The standard deviation calculation formula is as follows:
$\text{ }\!\!\delta\!\!\text{ }=\sqrt{\frac{\mathop{\sum }_{i=1}^{n}{{({{x}_{i}}-\bar{x})}^{2}}}{n-1}},$
where δ is the standard deviation of the reference period for a certain pixel; xi is the NPP value of the ith year; and n is the total number of years in the baseline period (n = 30).
The equation for calculating the multiple α of the negative anomaly value and the standard deviation of the baseline period is as follows:
$\text{ }\!\!\alpha\!\!\text{ }=\frac{|{{x}_{i}}-\left. {\bar{x}} \right|}{\delta }.$
In addition, for pixels with a significant (p < 0.05) decrease in NPP during the evaluation period, the risk level was increased by one level.
2.3.2 NPP simulation based on the Lund-Potsdam-Jena model
The Lund-Potsdam-Jena dynamic global vegetation model (LPJ-DGVM) is a dynamic global vegetation model based on physiological and ecological processes. The model is driven by inputting monthly climate data, atmospheric CO2 concentration data, and soil texture data to calculate the nutrient cycle and carbon-water flux between the plants, soil, and atmosphere and the carbon storage, photosynthesis intensity, and vegetation pattern dynamics. It is an effective tool for simulating the structural and functional dynamics of terrestrial ecosystems and for predicting the potential responses of ecosystems to climate change (Sitch et al., 2003). The LPJ model adopts a simplified Farquhar photosynthesis scheme (Collatz et al., 1991; Collatz et al., 1992), of which the photosynthetic rate (And) is a function of the photosynthetic active radiation absorbed by the vegetation, the temperature, the day length, and the canopy conductance. The model contains 10 plant functional types. For each functional type, the total primary productivity is calculated based on the coupling between the carbon and water, and the remaining part after subtracting the maintenance respiration and growth respiration is the NPP.
In this study, we used the LPJ model, of which the ETO module and the forest fire module have been improved to estimate the ecosystem NPP (Yin et al., 2018a). Among these modules, the ETO module used the FAO56-Penman-Monteith model, which takes into account the minimum and maximum temperatures, relative humidity, wind speed, and radiation (Allen et al., 1998; Yin et al., 2008). The forest fire module introduces a linear relationship between the combustible load and the probability of fire occurrence to better reflect how the availability of fuel affects fire occurrence (Arora et al., 2005).
The LPJ model assumes that all of the land types are bare land before the simulation. Therefore, before using the model to simulate ecosystem productivity, it is necessary to repeatedly run the model with climate data during an observation period to ensure that the carbon pool and vegetation cover reach equilibrium (Sitch et al., 2003; Yin et al., 2018a). Therefore, this study first cyclically used climate data for 1981-2010 to drive the model and to run it for 1,000 years. Then, the climate data for 2011-2099 was used to simulate the future changes in ecosystem productivity.

2.4 Sensitive factors of climate change risk

In a complex geographic system composed of multiple elements, the change in one element will inevitably affect changes in the other elements. Partial correlation analysis is often used to study the response of vegetation to climate variables (Zhang et al., 2011; Mu et al., 2013). In this study, we used partial correlation coefficients and their significances to assess the sensitive factors of climate change risk. Before calculating the partial correlation coefficient of variable x and variable y, its simple correlation coefficient rxy was calculated using the following equation:
${{r}_{xy}}\text{=}\frac{\mathop{\sum }_{i=1}^{n}\left[ \left( {{x}_{i}}-\bar{x} \right)\left( {{y}_{i}}-\bar{y} \right) \right]}{\sqrt{\mathop{\sum }_{i=1}^{n}{{\left( {{x}_{i}}-\bar{x} \right)}^{2}}\mathop{\sum }_{i=1}^{n}{{\left( {{y}_{i}}-\bar{y} \right)}^{2}}}},$
where xi and yi are the x value and y value in the ith year, respectively; n is the number of samples; $\bar{x}$ is the mean value of x; and $\bar{y}$ is the mean value of y. After fixing the independent variable z, the partial correlation coefficient rxy,z between the dependent variable x and the independent variable y was calculated as follows:
${{r}_{xy,z}}\text{=}\frac{{{r}_{xy}}-{{r}_{xz}}{{r}_{yz}}}{\sqrt{\left( 1-r_{xz}^{2} \right)}\sqrt{1-r_{yz}^{2}}}.$
We used the t-test method to test the significance of the partial correlation coefficient. The statistical formula is given as follows:
$t\text{=}\frac{{{r}_{xy,z}}\sqrt{n-m-1}}{\sqrt{1-r_{xy,z}^{2}}},$
where rxy,z is the partial correlation coefficient; n is the number of samples; and m is the number of independent variables.

3 Results

3.1 Projections of future climate change in the AHTZ

Figure 2 shows the anomaly changes in the regional mean temperature in the AHTZ predicted by the multi-model means in the 21st century relative to those during 1981-2010. In general, the temperature of the four emission scenarios showed an upward trend, but there were differences in the magnitude of change among different scenarios. The temperature increased by about 1℃ in 2020 relative to the baseline period. And after 2030, the difference among the scenarios became increasingly larger over time. Specifically, the temperature anomaly under the RCP2.6 scenario basically would not exceed 2℃ and would remain stable in the second half of the 21st century. Under the RCP4.5 scenario, the anomaly value would exceed 2℃ in the middle of the 21st century, and the change would stabilize and reach about 3℃ after 2060-2070. Under the RCP6.0 and RCP8.5 scenarios, the temperature continuously increased. The temperature of the RCP6.0 scenario changed from lower than that of RCP4.5 before 2070 to higher than that of RCP4.5 after 2070, and the temperature increase was close to 4℃ by the end of the 21st century. Under the RCP8.5 scenario, the temperature anomaly was always higher than in all of the other scenarios starting around 2035. As shown in Figure 2, at the end of the 21st century, the temperature in the AHTZ would increase by 1.58℃, 2.99℃, 3.85℃, and 6.02℃ relative to the baseline period under the RCP2.6, RCP4.5, RCP6.0, and RCP8.5 scenarios, respectively.
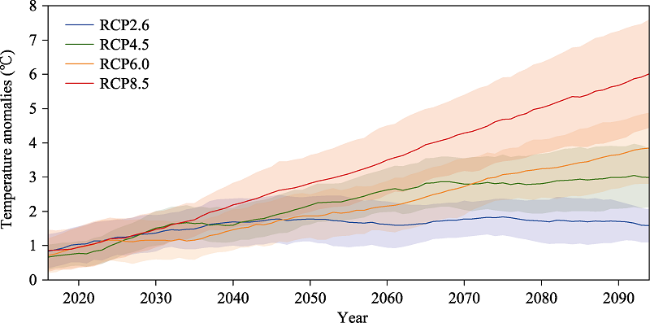
Figure 2 Regional mean temperature anomalies in the AHTZ displayed as anomalies during the 21st century (relative to 1981-2010) (Yin et al., 2018a). Solid lines indicate the ensemble means of five GCMs under the RCP scenarios. The shading indicates one standard deviation of the ensemble means. The time series were smoothed using an 11-year running mean.
Figure 3 shows the projected deviations in the precipitation (P) over the AHTZ in the midterm and long-term periods in the 21st century relative to the baseline period. In the midterm period in the 21st century, under the RCP2.6, RCP4.5, RCP6.0, and RCP8.5 scenarios, the P anomalies over the AHTZ would be 8.91%, 8.46%, 3.22%, and 10.23%, respectively. Among them, the changes in the P pattern under the RCP2.6 and RCP4.5 scenarios were relatively similar, with an increase of more than 10% in the eastern part of the study area, especially in the Bohai Rim Area, and a relatively small increase on the Loess Plateau (i.e., between 4% and 6%). Under the RCP6.0 scenario, the overall P change in the AHTZ would be relatively small. The increase in most areas would not exceed 4% relative to the baseline period, and even the P would decrease on the Loess Plateau. The increase in P was the largest under the RCP8.5 scenario, and the higher values were distributed in the southern part of the study area, reaching more than 12% in the northern part of northern China. In the long-term period in the 21st century, except for the fact that the high P area of the RCP4.5 scenario would move south toward the North China Plain and the Loess Plateau, the patterns of the other scenarios were similar to those of the midterm period. The P patterns in the AHTZ under the four scenarios increased further in the long-term period, with the average percentage deviations becoming 9.19%, 10.54%, 9.21%, and 17.51%, respectively.
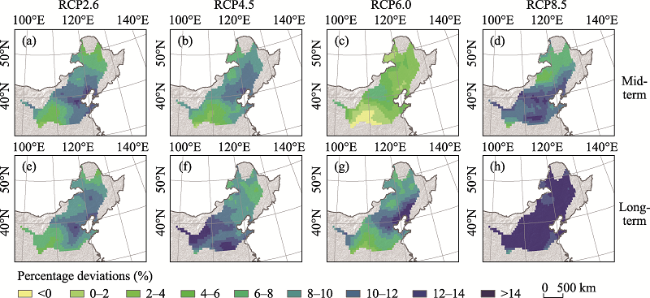
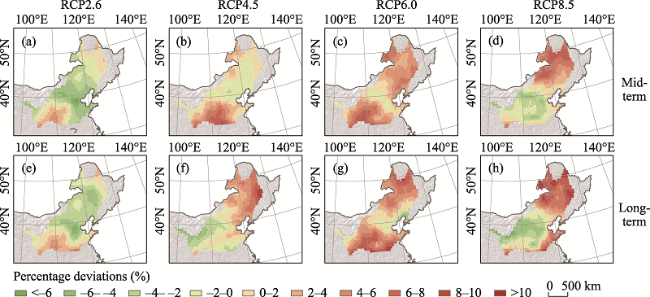
Figure 3 Percentage deviations in precipitation over the AHTZ under the (a, e) RCP2.6, (b, f) RCP4.5, (c, g) RCP6.0, and (d, h) RCP8.5 scenarios for 2041-2070 (top) and 2071-2099 (bottom) relative to 1981-2010
Figure 4 shows the spatial distribution of the percentage deviations in the reference evapotranspiration (ETO) estimates with respect to the baseline period. The results showed that the ETO would increase in the future under all four scenarios. In the midterm period in the 21st century, under the RCP8.5 scenario, which had the highest increase in greenhouse gas concentrations, the increase in the ETO was the largest, especially at the northern edge of the AHTZ where the increase exceeded 15%. The ETO changes under the RCP2.6 and RCP6.0 scenarios were similar, and the percentage deviations were less than 6% in southeastern Inner Mongolia and in the eastern part of northern China and 6-10% in other regions. The increase in the ETO under the RCP4.5 scenario was higher than the levels of the RCP2.6 and RCP6.0 scenarios, and the area that experienced a significant increase was located in the southern part of the North China Plain. Under these different scenarios, the regional average percentage deviations of the ETO in the midterm in the 21st century would be 6.56% (RCP2.6), 9.93% (RCP4.5), 7.35% (RCP6.0), and 12.14% (RCP8.5). Compared with P, the spatial differences in the ETO changes were slightly smaller. In the long-term period in the 21st century, except for the fact that the high ETO area of the RCP4.5 scenario moved north toward the eastern part of the Northeast China Plain, the patterns of the other scenarios were similar to those of the midterm period. Under the scenarios of RCP2.6, RCP4.5, RCP6.0, and RCP8.5, the ETO in the AHTZ increased further in the long-term period, with average percentage deviations of 7.42%, 12.02%, 13.68%, and 20.17%, respectively.
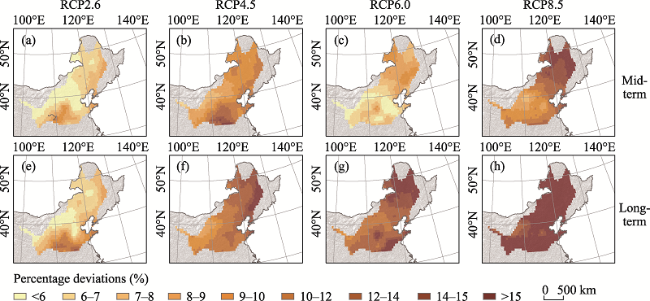
Figure 4 Percentage deviations from the reference evapotranspiration over the AHTZ under the (a, e) RCP2.6, (b, f) RCP4.5, (c, g) RCP6.0, and (d, h) RCP8.5 scenarios for 2041-2070 (top) and 2071-2099 (bottom) relative to 1981-2010
A negative anomaly in the AI represented an increase in the degree of humidity, and a positive anomaly indicated an increase in the degree of drought. Figure 5 shows the spatial distributions of the AI anomalies during 2041-2070 and 2071-2099 relative to 1981-2010. We observed significant differences in the regional patterns of the AI changes under the four scenarios. In the midterm period of the 21st century, the average percentage deviations in the AHTZ under the scenarios of RCP4.5, RCP6.0, and RCP8.5 would be 1.53%, 4.07%, and 2.03%, respectively, showing a certain overall trend of aridification. Only under the RCP2.6 scenario would the percentage deviation of the AI be -1.79%, which was slightly lower than that of the base period, and the central region tended to be humid. Under the RCP6.0 scenario, an increase in the ETO in the northern part of the AHTZ was higher than the increase in P, which led to an increase in the AI. Moreover, the increase in the AI in the south, especially on the Loess Plateau, reached more than 10%, which was due to the combined effects of the increased ETO and the decreased P. Under the RCP8.5 scenario, the northern part of the AHTZ would experience a strong drying trend, and the increase in P in the southern region would exceed the increase in the ETO, causing a decrease in the AI and thereby alleviating the impact of the aridification. In the long-term period, under the RCP4.5 scenario, because of the northward movement of the high ETO areas and the southward movement of the high P areas, the AI anomalies of the Loess Plateau would become negative, whereas those in the Northeast China Plain would increase significantly. In the other scenarios, the spatial distributions of the AI anomalies remained similar to those of the midterm patterns. In terms of the regional average, the AHTZ was drier in the long-term period than in the midterm period. The average percentage deviations in the AI under the scenarios of RCP2.6, RCP4.5, RCP6.0, and RCP8.5 increased to -1.29%, 1.87%, 4.38%, and 2.70%, respectively.
Figure 5 Percentage deviations in the aridity index over the AHTZ under the (a, e) RCP2.6, (b, f) RCP4.5, (c, g) RCP6.0, and (d, h) RCP8.5 scenarios for 2041-2070 (top) and 2071-2099 (bottom) relative to 1981-2010

3.2 Spatio-temporal characteristics of the climate change risk of the NPP in the AHTZ

Both the future rates of variation of the NPP anomaly in the AHTZ relative to the baseline period (1981-2010) exhibited spatial distribution characteristics that were significantly different for the different emission scenarios. For the midterm period, the NPP negative anomalies mainly appeared in the northern part of the Northeast China Plain, the northern part of the Loess Plateau, and the central part of the North China Plain under the RCP2.6 scenario, and the spatial distribution of the negative NPP anomalies expanded as the emission scenarios became more severe. During this 30-year period, the NPP in the central part of the Northeast China Plain decreased significantly (p <0.05) under the scenarios of RCP2.6 and RCP6.0, and the NPP in the eastern Inner Mongolia grasslands, the Loess Plateau, and the North China Plain also decreased significantly under the scenarios of RCP4.5 and RCP6.0. Compared with 2041-2070, the negative NPP anomaly during 2071-2099 expanded into the North China Plain and the Loess Plateau, but it almost disappeared in the Northeast China Plain under the RCP2.6 scenario; it expanded and strengthened in the Northeast China Plain and disappeared in the southern Loess Plateau under the RCP4.5 scenario; and it expanded and strengthened under both the scenarios of RCP6.0 and RCP8.5. During the long-term 30-year period, the significant negative changes in the NPP mainly occurred on the Loess Plateau under all of the scenarios, in the North China Plain under the scenarios of RCP6.0 and RCP8.5, and in the Northeast China Plain under the RCP8.5 scenario.
According to the results of this risk assessment, the scope and extent of the future climate change risks gradually expanded and increased under the scenarios of RCP2.6, RCP4.5, RCP6.0, and RCP8.5 (Figure 6). Under the low-emission scenario (RCP2.6), the NPP risk area during 2041-2070 would be small, and the low-risk areas would be distributed primarily across the north-central part of the Northeast China Plain, the northern part of the Loess Plateau, and the central part of the North China Plain. As the emission concentrations strengthened, not only would the risk areas in the Northeast China Plain and the North China Plain expand, but also the grasslands in eastern Inner Mongolia would face additional risks under the medium- to high-emission scenarios. Under the scenarios of RCP2.6, RCP4.5, RCP6.0, and RCP8.5, the NPP risk areas accounted for 29.45%, 49.97%, 72.22%, and 60.72% of the AHTZ, respectively (Table 1). The proportions of different risk-level areas followed the order of low risk > medium risk > high risk. Among the four scenarios, the RCP2.6 scenario had the highest proportion of low-risk areas, whereas the scenarios of RCP6.0 and RCP8.5 had the highest proportions of medium- and high-risk areas, respectively. The high-risk areas mainly were distributed in the northern and eastern parts of the AHTZ. All of the low-, medium-, and high-risk areas would be largest under the RCP6.0 scenario. Compared with the RCP6.0 scenario, although the proportion of the total risk area under the RCP8.5 scenario was slightly lower, the reduction was mainly in the low- and medium-risk areas, and the high-risk area did not change significantly. The main area where the risk of the RCP8.5 scenario would be lower than that of RCP6.0 was distributed on the Loess Plateau. And the risk of the Loess Plateau under the RCP8.5 scenario may also be lower than that under the RCP4.5 scenario.
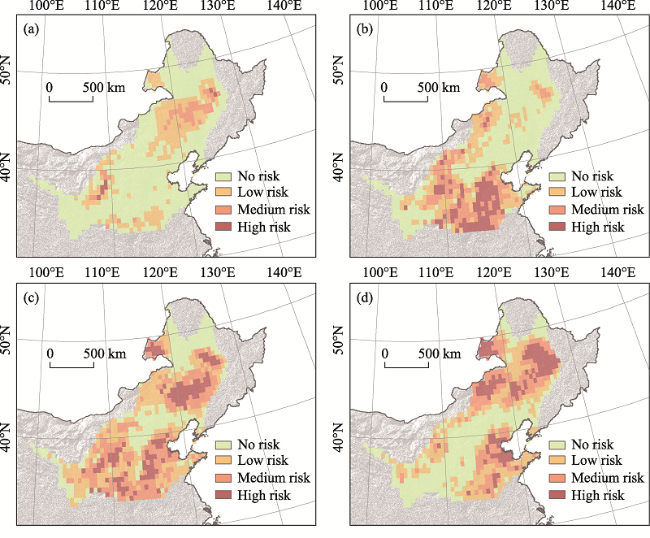
Figure 6 Spatial distributions of the risk in the AHTZ under the scenarios of (a) RCP2.6, (b) RCP4.5, (c) RCP6.0, and (d) RCP8.5 during 2041-2070
Table 1 Proportion of the risk area (%) in the AHTZ under different RCP scenarios during 2041-2070
Risk levels RCP2.6 RCP4.5 RCP6.0 RCP8.5
Low 23.15 23.71 31.04 27.40
Medium 5.46 14.88 26.62 19.22
High 0.84 11.39 14.57 14.11
Total 29.45 49.97 72.22 60.72
Compared with the 2041-2070 period, the spatial pattern of the NPP risk in the AHTZ during 2071-2099 changed significantly (Figure 7)—that is, under the scenarios of RCP2.6, RCP4.5, RCP6.0, and RCP8.5, the total risk area accounted for 26.29%, 50.56%, 72.13%, and 81.85%, of the study area, respectively (Table 2). Among these areas, the total risk ratio decreased under the RCP2.6 scenario and remained almost unchanged under the RCP4.5 and RCP6.0 scenarios, but risks in some areas would change. The medium- and low-risk areas in the middle of the North China Plain under the RCP2.6 scenario, the medium- and high-risk areas in the Northeast China Plain under the RCP4.5 scenario, and the high-risk areas in the Loess Plateau and the North China Plain under the RCP6.0 scenario all would expand. The total risk ratio of the RCP8.5 scenario increased by more than 21% compared with the 2041-2070 period. This mainly was due to the transformation of some of the low- and medium-risk areas into high-risk areas and to the significant expansion of the high-risk areas. Under the RCP8.5 scenario, the proportion of areas with different levels of risk changed to a structure of high risk > (medium risk + low risk). The proportion of high-risk areas reached 54.71%, and the distribution range spread to cover almost the entire eastern plain of the AHTZ and the grassland area of eastern Inner Mongolia.
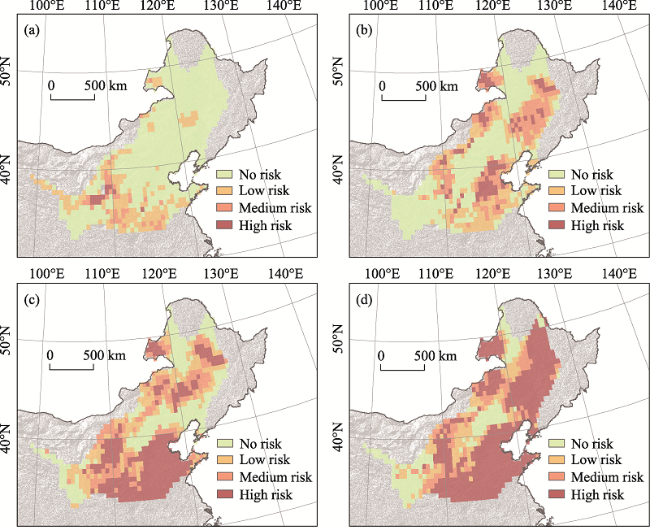
Figure 7 Spatial distributions of the risk in the AHTZ under the scenarios of (a) RCP2.6, (b) RCP4.5, (c) RCP6.0, and (d) RCP8.5 during 2071-2099
Table 2 Proportion of the risk area (%) in the AHTZ under different RCP scenarios during 2071-2099
Risk levels RCP2.6 RCP4.5 RCP6.0 RCP8.5
Low 19.77 22.16 20.54 14.28
Medium 4.77 18.83 18.68 12.86
High 1.75 9.58 32.92 54.71
Total 26.29 50.56 72.13 81.85

3.3 Characteristics of the NPP changes of each climate change risk level

In the mid-and long-term periods under each scenario, the average NPP anomaly was inversely proportional to the severity of the climate change risk, that is, the low-risk areas had the highest anomaly and the high-risk areas had the lowest anomaly (Figure 8). Only in the midterm period under the RCP2.6 scenario and the long-term period under the RCP8.5 scenario was the NPP anomaly in the low-risk area positive (Figures 8a and 8d). This indicated that the low-risk areas in these two cases likely were determined based on the decreasing trend of the NPP (Figures 9a and 9d). Under the scenarios of RCP2.6 and RCP4.5, in the high-risk area, the NPP anomaly would be higher on average in the long-term period than in the midterm period, indicating that the NPP would have undergone an increase-based change, and the anomaly risk would decrease. Under the RCP6.0 scenario, NPP anomaly would be significantly lower in the long-term period than in the midterm period, and the NPP anomaly in the high-risk area would decrease from -45.80±13.23 gC•m-2•a-1 to -81.91±23.34 gC•m-2•a-1, indicating that the risk anomaly would be higher in long-term period. In both the midterm and long-term periods, the NPP anomaly in the high-risk area under the RCP8.5 scenario was the lowest among the four scenarios, reaching -69.80±21.95 gC•m-2•a-1 and -96.00±46.95 gC•m-2•a-1, respectively. That is, in the case of the high-risk area, the risk level of the NPP anomaly under the RCP8.5 scenario was the highest.
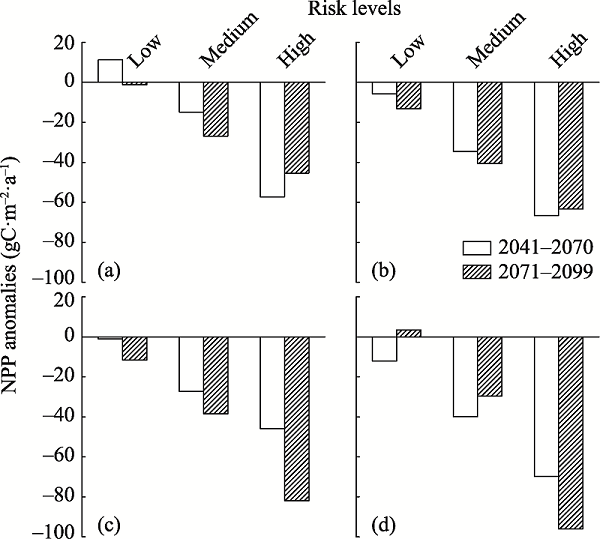
Figure 8 NPP Anomalies of each risk level in the AHTZ under the scenarios of (a) RCP2.6, (b) RCP4.5, (c) RCP6.0, and (d) RCP8.5 relative to 1981-2010
Except for the high-risk area in the midterm period under the RCP2.6 scenario and the long-term period under the RCP4.5 scenario, the rate of change of the NPP under each scenario basically increased with increasing risk level (i.e., low-risk level < medium-risk level < high-risk level) (Figure 9). In the midterm period, although under the RCP2.6 scenario, most of the areas had low-risk levels, the rate of decrease of the NPP in the medium- and low-risk areas was faster than under the other three scenarios. Specifically, the average rate of decrease of the NPP in the low-risk areas was -2.13± 2.01 gC•m-2•a-1 and that in the medium-risk areas reached -2.92±1.62 gC•m-2•a-1, indicating that the risk of the significantly reduced NPP was high. Moreover, under the RCP6.0 scenario, which had the largest risk area, the rate of decrease of the NPP also was faster overall, and the rate of decrease in the high-risk area (up to -3.55±1.32 gC•m-2•a-1) was faster than under the other three scenarios.
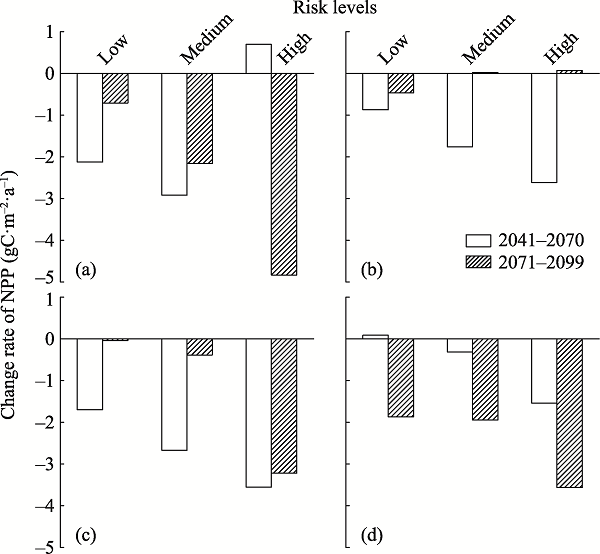
Figure 9 NPP Trends of each risk level in the AHTZ under the scenarios of (a) RCP2.6, (b) RCP4.5, (c) RCP6.0, and (d) RCP8.5
From the midterm period to the long-term period, the change in the NPP of the high-risk areas under the RCP2.6 scenario changed from the fastest increase to the fastest decrease, reaching -4.83±1.30 gC•m-2•a-1. In the long-term period, the change in the NPP in each risk level area was not significant under the RCP4.5 scenario, and it was basically within ± 0.5 gC•m-2•a-1. Moreover, under the RCP6.0 scenario, only the NPP in the high-risk area maintained a significant decreasing trend (-3.22±2.52 gC•m-2•a-1). Under the RCP8.5 scenario, the negative NPP trend in the risk areas was significant. The trend of the NPP in the low-risk areas changed from an increasing trend to a significantly decreasing trend, and the decrease in the NPP at the medium- and high-risk levels doubled. Among them, the decreasing NPP trend in the high-risk areas was as high as -3.56±3.40 gC•m-2•a-1. Therefore, under the RCP8.5 scenario, from the midterm period to the long-term period, not only would the high-risk level expand substantially, but also the downward trend of the NPP would become more significant.

3.4 Sensitive factors of climate change risk

By calculating changes in future climate elements relative to the base period (1981-2010) under the RCP8.5 scenario and calculating the partial correlation coefficients between NPP and T, P, and AI in the future periods, we explored the sensitive factors of the climate change risk in the AHTZ. The T anomalies and P anomalies in the AHTZ all were positive (Figures 10-11), and the long-term period (2071-2099) anomalies were greater than the midterm period (2041-2070). From the midterm period to the long-term period, the regional average T anomalies increased from 3.23℃ to 5.36℃, and the P anomalies increased from 10.35% to 17.63%. In terms of their spatial distributions, the T anomalies in the northern part of the AHTZ were higher than those in the southern part of the AHTZ, whereas the pattern of the P anomalies had the opposite distribution. The AI anomalies mainly were positive in the northeast region and mainly were negative in the southwest region. The regional average AI anomalies were 2.12% and 3.60% in the midterm and long-term periods, respectively.
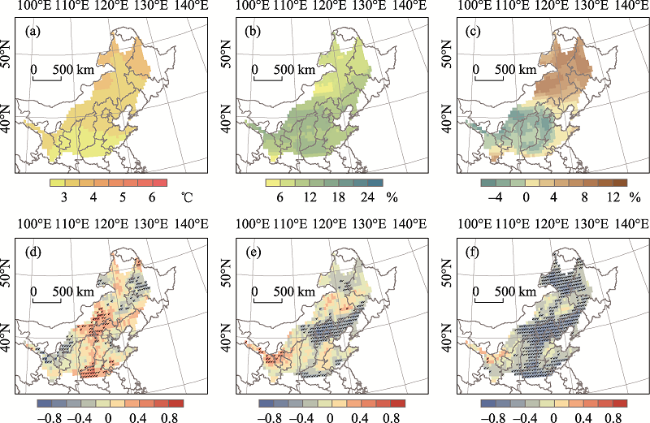
Figure 10 Anomalies (upper row) in the climatic factors during 2041-2070 relative to the baseline period under the RCP8.5 scenario and their partial correlation coefficients (bottom row) with NPP in the AHTZ. Note that the shaded area indicates the statistical significance (p <0.05): (a, d) temperature, (b, e) precipitation, and (c, f) aridity index.
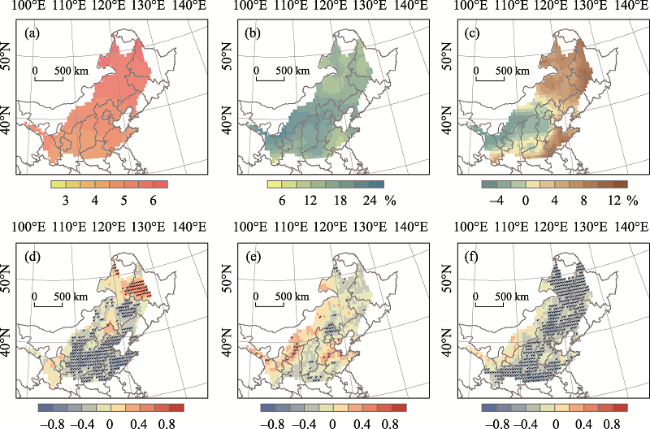
Figure 11 Anomalies in the climatic factors during 2071-2099 relative to the baseline period under the RCP8.5 scenario and their partial correlation coefficients with NPP in the AHTZ. Note that the shaded area indicates the statistical significance (p <0.05): (a, d) temperature, (b, e) precipitation, and (c, f) aridity index.
In the midterm period, we found a negative correlation between P and NPP in most areas. A significant negative correlation occurred in 19.93% of the study area, but mainly was distributed in the area from the southern part of northeastern China to the northern part of northern China. The significant positive correlation covered only 2.48% of the study area. The areas with positive and negative partial correlations between NPP and T were equivalent, with a significant positive correlation (9.32%) concentrated in the southeastern part of the Inner Mongolia Plateau and the central part of the North China Plain and a significant negative correlation (9.79%) distributed in the northern part of the Northeast China Plain and the western part of the Loess Plateau. In the long-term period, the correlation between NPP and P was significantly weaker overall, and the area with a significant correlation decreased from 22.41% during the midterm period to 7.19% during the long-term period. From the midterm period to the long-term period, the proportion of the area with a significant correlation between T and NPP increased significantly, reaching 42.57%. Specifically, the significant negative correlation occupied a large area in the central and southern parts of the AHTZ, accounting for 36.08% of the study area, and only a small part of the northern Northeast China Plain had a significant positive correlation.
The NPP in most areas was negatively correlated with the AI, and the significant negative correlation was distributed from north to south in the study area, accounting for 56.25% (2041-2070) and 55.19% (2071-2099) of the study area. In the long-term period, the AI at the eastern edge of the AHTZ increased by more than 12% relative to the baseline period. The future increase in drought events in these areas may inhibit vegetation growth. In general, under the RCP8.5 scenario, the P changes in the AHTZ could mainly have a negative impact on vegetation growth, but this negative impact may be reduced as P increases. Furthermore, the effect of the change in T on the vegetation may gradually become a predominantly negative impact, and the range of influence would significantly expand with increasing T. The AI may be the dominant factor affecting the vegetation changes in the AHTZ in the future, and the risk of a decrease in the NPP in the AHTZ in the future may be mainly caused by aridification.

4 Discussion

The uncertainty in the climate change risk assessment of the ecosystem mainly comes from the climate scenario data, the physiological mechanism description, the parameters of the ecological model, and the sensitivity of the vegetation response to climate. An ecological model is an important tool for ecosystem productivity simulation and prediction. In this study, we used the improved LPJ model to simulate the total potential vegetation NPP in China during the baseline period (1981-2010). The result was 3.61±0.13 Gt C•a-1, which was in line with other studies (Mao et al., 2010; Yuan et al., 2014; Pan et al., 2015). Spatially, with the transition in vegetation type from forest to grassland, the multi-year average NPP decreased from southeast to northwest. Besides, by comparing the NPP data of this study with the NPP observation data for China obtained from the Global Primary Production Data Initiative database (Olson et al., 2013), we found that the average relative error between the two was 9.94%. These results showed that the LPJ model had a good ability to simulate the NPP of the Chinese ecosystem. In addition, the LPJ model is a moderately complex global vegetation dynamics model. It has multiscale (medium, large, and global) applicability because the vegetation functional type is used as the basic unit of vegetation type (Che et al., 2013), which has facilitated the popularization and application of the risk assessment method used in this study in other regions and on other scales.
Under the combined effects of future climate change and human activities, the vegetation growth conditions may become increasingly unstable. The sensitivity of vegetation to different climatic factors and the key climatic factors and thresholds that control vegetation changes may change (Wang et al., 2014; Nielsen et al., 2015; Huang et al., 2016). According to the results of current methodological assessments, the climate change risks vary with ecosystem type. The risks for both the agricultural land in the east and the grasslands in Inner Mongolia would be higher than those of the woodland in the northeast, and the risks for these three ecological types would be more serious than those for the forest and grassland in the interlaced zone of agriculture, forestry, and pasture land. The noted differences may be related to the structures of the ecosystems. The compositions and functions of the forest grassland and forest ecosystems are more complex than those of the agricultural land and grassland, so they could be more stable under the influence of climate change (Loreau et al., 2013). The results of this study found that the risk of NPP of the Loess Plateau under the RCP8.5 scenario may be lower than that under the RCP4.5 and RCP6.0 scenarios in the midterm (2041-2070) (Figure 6). This is probably the result of different humidity conditions under different scenarios in the mid-term. Compared with the RCP4.5 and RCP6.0 scenarios, the Loess Plateau under the RCP8.5 scenario may have more precipitation and a more humid climate (Figures 3 and 5). And the humidification trend is likely to favor the NPP increase in most parts of the Loess Plateau (Figures 10b and 10e). The positive response of NPP of the Loess Plateau to greater water conditions has also been reported in other studies (Ramakrishna R et al., 2003; Wang et al., 2016; Yang et al., 2017). In the long-term (2071-2099), the risk of NPP of the Loess Plateau under the RCP8.5 scenario would be significantly higher than that in the mid-term (Figure 7d), though the anomalies of precipitation would still be positive and the anomalies of AI would still be negative (Figures 11b and 11c). This may be because that warming could increase both photosynthesis and respiration (Heimann et al., 2008), and there would be significant warming in the long-term under the RCP8.5 scenario. Thus the increase in respiration caused by the warming in the long-term (around 4℃, Figure 11a) was projected to exceed the increase in photosynthesis, which was manifested as a significant negative correlation between temperature increase and NPP changes (Figure 11d). Similar to our results, Yu et al. (2020) suggested that moderate warming (1.5℃) under the RCP4.5 scenario would be beneficial to the increase in NPP, but further warming (2℃) may lead to a decrease in NPP. Therefore it is necessary to prepare for the management and adaptation of the climate change risk faced by the ecosystem, though a moderate climate change may have a positive influence.
The risk identification standard used in this study integrated the change in the NPP and the multiple relationships between the range of change and its natural variability. It was characterized by the standard deviation from the baseline period and emphasized the negative impact of future climate warming on ecosystem productivity. In recent years, important progress has been made in climate change risk assessment research. Climate change may damage the structure and functions of ecosystems. Ecosystem risk assessment under climate change usually requires screening the key attributes of the ecosystem as a response indicator to climate change and the use of its unacceptable critical loss as the threshold of the impact of climate change on the ecosystem (Warszawski et al., 2013; Piontek et al., 2014). For example, given reference thresholds based on key climate variables and impact models, the risks can be assessed bottom-up based on the conditional probability of exceeding the threshold (Jones et al., 2011). The natural variability of the NPP can be used to estimate the risk loss and to visually display the regional spatial information that exceeds key thresholds, which facilitates the corresponding analysis of predicted future climate element changes (Minnen et al., 2002). With the multi-models under multi-scenarios, the climate threshold could be defined by the mean and standard deviation of the climate variables in the baseline period, and the risk could be characterized by counting the proportion of the number of climate changes that exceeded the threshold (Scholze et al., 2006). When this method is used, however, it can be easy to conceptually confuse the possibility of risk with the level of risk. In recent years, studies have used the amount of change in the future estimated value relative to the past long-term average to describe changes in the state of the ecosystem. The standard deviation of the state of the variable in the past period often has been used to characterize the natural fluctuations in the ecosystem. When the degree of change in the ecosystem exceeds the natural fluctuation range, the ecosystem attribute is considered to have reached an unacceptable critical value (Heyder et al., 2011; Xu et al., 2014; Yin et al., 2016). Therefore, the quantitative identification of risk thresholds should be the focus and acknowledged difficulty of future research on climate change risk analysis. Furthermore, it also will be necessary to fully consider the elasticity and resilience of the ecosystem when facing external pressures.

5 Conclusions

The changes in the NPP of an ecosystem reflect the comprehensive impact of the climatic variations on the structure and process of the ecosystem, especially the carbon balance. Based on the multi-scenario data from the CMIP5 climate models, this study predicted and analyzed the characteristics of future changes in the main climatic elements in the AHTZ in China. After improving the potential evapotranspiration module and the forest fire module of the LPJ model, we carried out the NPP simulation. By characterizing the risk level using the magnitude of the future negative NPP anomaly relative to the natural interannual variability and the rate of change of the NPP, this study assessed the climate change risks faced by the NPP in the AHTZ ecosystem under four different climate change scenarios. The main conclusions of this study are as follows.
(1) Under the future climate change scenarios, the T and ETO in the study area may increase, and the P may exhibit a fluctuating increase. There would be regional differences in the humidity changes under different scenarios. The AI would increase relative to the baseline period (1981-2010) under the RCP6.0 and RCP8.5 scenarios, indicating that under the mid-to-high emission scenarios, in the 21st century, most of the regions are likely to experience some degree of aridification.
(2) In the future, the areas in which the ecosystem productivity is at risk due to climate change in the AHTZ are likely to expand in the midterm (2041-2070) and long-term (2071- 2099) periods. The risk levels are likely to increase, and the risk would be more serious under the high-emission scenarios. The total area of the NPP risk under different scenarios in the long-term period would be between 26.29% (RCP2.6) and 81.85% (RCP8.5). The high-risk areas are likely to increase under most of the scenarios. In particular, under the RCP8.5 scenario, the high-risk area may expand from 14.11% in 2041-2070 to 54.71% in 2071- 2099. Meanwhile, the NPP anomaly in the high-risk area may decrease from -69.80± 21.95 gC•m-2•a-1 to -96.00±46.95 gC•m-2•a-1, and the rate of decrease of the NPP may accelerate from -1.53±1.91 gC•m-2•a-1 to -3.56±3.40 gC•m-2•a-1.
(3) The eastern plain of the AHTZ and the eastern grasslands of Inner Mongolia are expected to become the main risk concentration areas. The future vegetation growth in these areas may be adversely affected by climate change. Increased warming and increasing dryness are likely to be important drivers of future climate change risks. Under the RCP8.5 scenario, the estimated NPP changes may be affected primarily by the synergistic effects of T and AI, and the significant negative correlation areas in the midterm and long-term periods would be 36.08% and 55.19%, respectively. Under the future scenarios, we estimated that the productivity of the ecosystem may decrease, and disaster risks such as droughts and floods could be combined. Not only is the local natural ecosystem at risk, but also local agricultural and animal husbandry activities likely face a serious threat.
[1]
Allen C D, Macalady A K, Chenchouni H et al., 2010. A global overview of drought and heat-induced tree mortality reveals emerging climate change risks for forests. Forest Ecology & Management, 259(4): 660-684.

[2]
Allen R G, Pereira L S, Raes D et al., 1998. Crop Evapotranspiration: Guidelines for Computing Crop Water Requirements. United Nations Food and Agriculture Organization, Rome.

[3]
Andreu-Hayles L, D’Arrigo R, Anchukaitis K J et al., 2011. Varying boreal forest response to Arctic environmental change at the Firth River, Alaska. Environmental Research Letters, 6(4): 045503.

DOI

[4]
Arora V K, Boer G J, 2005. Fire as an interactive component of dynamic vegetation models. Journal of Geophysical Research, 110(G2): 149-167.

[5]
Asmus M L, Nicolodi J O, Anello L S et al., 2019. The risk to lose ecosystem services due to climate change: A South American case. Ecological Engineering, 130: 233-241.

DOI

[6]
Che M L, Chen B Z, Wang Y et al., 2013. Review of dynamic global vegetation models (DGVMs). Chinese Journal of Applied Ecology, 25(1): 263-271. (in Chinese)

[7]
Chen Y N, Zhang X Q, Fang G H et al., 2020. Potential risks and challenges of climate change in the arid region of northwestern China. Regional Sustainability, 1(1): 20-30.

DOI

[8]
Collatz G J, Ball J T, Grivet C et al., 1991. Physiological and environmental regulation of stomatal conductance, photosynthesis and transpiration: A model that includes a laminar boundary layer. Elsevier, 54(2-4): 107-136.

[9]
Collatz G J, Ribas-Carbo M, Berry J, 1992. Coupled photosynthesis-stomatal conductance model for leaves of C4 plants. Functional Plant Biology, 19(5): 519-538.

DOI

[10]
Dessai S, Adger W N, Hulme M et al., 2004. Defining and experiencing dangerous climate change. Climatic Change, 64(1/2): 11-25.

DOI

[11]
Diffenbaugh N S, Field C B, 2013. Changes in ecologically critical terrestrial climate conditions. Science, 341(6145): 486-492.

DOI PMID

[12]
Ding Y H, 2018. Sustainable management and action in China under the increasing risks of global climate change. Engineering, 4(3): 12-21.

[13]
Fu C, 1992. Transitional Climate Zones and Biome Boundaries: A Case Study from China. New York: Springer.

[14]
Fung I Y, Doney S C, Lindsay K et al., 2005. Evolution of carbon sinks in a changing climate. Proceedings of the National Academy of Sciences of the United States of America, 102(32): 11201-11206.

[15]
Gang C C, Zhang Y Z, Wang Z Q et al., 2017. Modeling the dynamics of distribution, extent, and NPP of global terrestrial ecosystems in response to future climate change. Global and Planetary Change, 148: 153-165.

DOI

[16]
Heimann M, Reichstein M, 2008. Terrestrial ecosystem carbon dynamics and climate feedbacks. Nature, 451(7176): 289-292.

DOI

[17]
Heyder U, Schaphoff S, Gerten D et al., 2011. Risk of severe climate change impact on the terrestrial biosphere. Environmental Research Letters, 6(3): 034036.

DOI

[18]
Huang L, He B, Chen A F et al., 2016. Drought dominates the interannual variability in global terrestrial net primary production by controlling semi-arid ecosystems. Scientific Reports, 6(1): 24639.

DOI

[19]
IPCC, 2013. Climate Change 2013: The Physical Science Basis. Contribution of Working Group I to the Fifth Assessment Report of the Intergovernmental Panel on Climate Change. Cambridge, United Kingdom and New York, USA: Cambridge University Press.

[20]
IPCC, 2014. Climate Change 2014: Impacts, Adaptation, and Vulnerability. Part A: Global and Sectoral Aspects. Contribution of Working Group II to the Fifth Assessment Report of the Intergovernmental Panel on Climate Change. Cambridge, UK: Cambridge University Press.

[21]
Jones R N, Preston B L, 2011. Adaptation and risk management. Wiley Interdiplinary Reviews: Climate Change, 2(2): 296-308.

[22]
Lin X, Qian W H, 2012. Review of the global monsoon and monsoon marginal zones. Advances in Earth Science, 27(1): 26-34. (in Chinese)

[23]
Littell J S, Oneil E E, Mckenzie D et al., 2010. Forest ecosystems, disturbance, and climatic change in Washington State, USA. Climatic Change, 102(1): 129-158.

DOI

[24]
Liu Y H, Wang W T, 2019. The new situation of global climate governance and China’s green development strategy. China Sustainability Tribune, 18(Suppl.1): 16-21. (in Chinese)

[25]
Loreau M, De Mazancourt C, Duffy E, 2013. Biodiversity and ecosystem stability: A synthesis of underlying mechanisms. Ecology Letters, 16(Suppl.1): 106-115.

DOI

[26]
Lorenzoni I, Pidgeon N F, O'Connor R E, 2005. Dangerous climate change: The role for risk research. Risk Analysis, 25(6): 1387-1398.

PMID

[27]
Mao J F, Dan L, Wang B et al., 2010. Simulation and evaluation of terrestrial ecosystem NPP with M-SDGVM over continental China. Advances in Atmospheric Sciences, 27(2): 427-442.

DOI

[28]
Mao J F, Fu W T, Shi X Y et al., 2015. Disentangling climatic and anthropogenic controls on global terrestrial evapotranspiration trends. Environmental Research Letters, 10(9): 094008.

DOI

[29]
Minnen J G V, Onigkeit J, Alcamo J, 2002. Critical climate change as an approach to assess climate change impacts in Europe: Development and application. Environmental Science & Policy, 5(4): 335-347.

[30]
Moss R H, Edmonds J A, Hibbard K A et al., 2010. The next generation of scenarios for climate change research and assessment. Nature, 463(7282): 747-756.

DOI

[31]
Mu S J, Li J L, Zhou W et al., 2013. Spatial-temporal distribution of net primary productivity and its relationship with climate factors in Inner Mongolia from 2001 to 2010. Acta Ecologica Sinica, 33(12): 3752-3764. (in Chinese)

DOI

[32]
Nielsen U N, Ball B A, 2015. Impacts of altered precipitation regimes on soil communities and biogeochemistry in arid and semi-arid ecosystems. Global Change Biology, 21(4): 1407-1421-1407-1421.

[33]
Olson R J, Scurlock J M O, Prince S D et al., 2013. NPP Multi-Biome: Global Primary Production Data Initiative Products, R2. ORNL Distributed Active Archive Center, Oak Ridge, Tennessee, USA.

[34]
Pan S F, Tian H Q, Dangal S R S et al., 2014. Complex spatiotemporal responses of global terrestrial primary production to climate change and increasing atmospheric CO2 in the 21st century. Plos One, 9(11): e112810.

DOI

[35]
Pan S F, Tian H Q, Lu C Q et al., 2015. Net primary production of major plant functional types in China: Vegetation classification and ecosystem simulation. Acta Ecologica Sinica, 35(2): 28-36. (in Chinese)

DOI

[36]
Piao S, Liu Z, Wang T et al., 2017. Weakening temperature control on the interannual variations of spring carbon uptake across northern lands. Nature Climate Change, 7(5): 359-363.

DOI

[37]
Pierce D W, Barnett T P, Santer B D et al., 2009. Selecting global climate models for regional climate change studies. Proceedings of the National Academy of Sciences of the United States of America, 106(21): 8441-8446.

DOI PMID

[38]
Piontek F, Müller C, Pugh T A et al., 2014. Multisectoral climate impact hotspots in a warming world. Proceedings of the National Academy of Sciences of the United States of America, 111(9): 3233-3238.

[39]
Qin D H, 2015. China’s National Assessment Report on Extreme Climate Events and Disaster Risk Management and Adaptation. Beijing: Science Press. (in Chinese)

[40]
Ramakrishna R N, Charles D K, Hirofumi H et al., 2003. Climate-driven increases in global terrestrial net primary production from 1982 to 1999. Science, 300(5625): 1560-1563.

PMID

[41]
Reynolds J F, Smith D M S, Lambin E F et al., 2007. Global desertification: Building a science for dryland development. Science, 316(5826): 847-851.

PMID

[42]
Richardson A D, Hufkens K, Milliman T et al., 2018. Ecosystem warming extends vegetation activity but heightens vulnerability to cold temperatures. Nature, 560(7718): 368-371.

DOI

[43]
Scholze M, Knorr W, Arnell N W et al., 2006. A climate-change risk analysis for world ecosystems. Proceedings of the National Academy of Sciences of the United States of America, 103(35): 13116-13120.

PMID

[44]
Seddon A W, Macias-Fauria M, Long P R et al., 2016. Sensitivity of global terrestrial ecosystems to climate variability. Nature, 531(7593): 229-232.

DOI

[45]
Sitch S S B, Ic. P, Arneth A et al., 2003. Evaluation of ecosystem dynamics, plant geography and terrestrial carbon cycling in the LPJ dynamic global vegetation model. Global Change Biology, 9(2): 161-185.

DOI

[46]
Sneyers R, 1990. On the statistical analysis of series of observations. Journal of Biological Chemistry, 258(22): 13680-13684.

DOI

[47]
Steffen W, Noble I, Canadell J et al., 1998. The terrestrial carbon cycle: Implications for the Kyoto Protocol. Science, 280(5368): 1393-1394.

DOI

[48]
Taylor K E, Stouffer R J, Meehl G A, 2012. An overview of CMIP5 and the experiment design. Bulletin of the American Meteorological Society, 93(4): 485-498.

DOI

[49]
Thibeault J M, Seth A, 2014. Changing climate extremes in the Northeast United States: Observations and projections from CMIP5. Climatic Change, 127(2): 273-287.

DOI

[50]
Urban M C, 2015. Accelerating extinction risk from climate change. Science, 348(6234): 571-573.

DOI PMID

[51]
Wang C, Wang X B, Liu D W et al., 2014. Aridity threshold in controlling ecosystem nitrogen cycling in arid and semi-arid grasslands. Nature Communications, 5(1): 1-8.

[52]
Wang H, Liu G H, Li Z et al., 2016. Impacts of climate change on net primary productivity in arid and semiarid regions of China. Chinese Geographical Science, 26(1): 35-47.

DOI

[53]
Wang L, Chen W, Huang G et al., 2017. Changes of the transitional climate zone in East Asia: Past and future. Climate Dynamics, 49(4): 1463-1477.

DOI

[54]
Warszawski L, Frieler K, Huber V et al., 2014. The Inter-Sectoral Impact Model Intercomparison Project (ISI-MIP): Project framework. Proceedings of the National Academy of Sciences of the United States of America, 111(9): 3228-3232.

DOI PMID

[55]
Warszawski L, Friend A, Ostberg S et al., 2013. A multi-model analysis of risk of ecosystem shifts under climate change. Environmental Research Letters, 8(4): 044018.

DOI

[56]
Wei Y M, Yuan X C, Wu G et al., 2014. Climate change risk management: A bibliometric analysis based on Web of Science. Bulletin of National Natural Science Foundation of China, 28(5): 347-356. (in Chinese)

[57]
Wu S H, 2011. Integrated Risk Governance. Beijing: Science Press. (in Chinese)

[58]
Wu S H, Yin Y H, Zheng D et al., 2005. Aridity/humidity status of land surface in China during the last three decades. Science in China, 48(9): 1510-1518.

[59]
Wu Z T, Dijkstra P, Koch G W et al., 2011. Responses of terrestrial ecosystems to temperature and precipitation change: A meta-analysis of experimental manipulation. Global Change Biology, 17(2): 927-942.

DOI

[60]
Xu C G, McDowell N G, Fisher R A et al., 2019. Increasing impacts of extreme droughts on vegetation productivity under climate change. Nature Climate Change, 9(12): 948-953.

DOI

[61]
Xu M J, Wen X F, Wang H M et al., 2014. Effects of climatic factors and ecosystem responses on the inter-annual variability of evapotranspiration in a coniferous plantation in subtropical China. Plos One, 9(1): e85593.

DOI

[62]
Yang J, Zhang X, Luo Z et al., 2017. Nonlinear variations of net primary productivity and its relationship with climate and vegetation phenology, China. Forest, 8(10): 361.

DOI

[63]
Yin Y H, Ma D Y, Wu S H, 2018a. Climate change risk to forests in China associated with warming. Scientific Reports, 8(1): 1-13.

[64]
Yin Y H, Ma D Y, Wu S H, 2018b. Nonlinear changes in aridity due to precipitation and evapotranspiration in China from 1961 to 2015. Climate Research, 74(3): 263-281.

DOI

[65]
Yin Y H, Ma D Y, Wu S H et al., 2015. Projections of aridity and its regional variability over China in the mid-21st century. International Journal of Climatology, 35(14): 4387-4398.

DOI

[66]
Yin Y H, Wu S H, Zheng D et al., 2008. Radiation calibration of FAO56 Penman-Monteith model to estimate reference crop evapotranspiration in China. Agricultural Water Management, 95(1): 77-84.

DOI

[67]
Yin Y Y, Tang Q H, Wang L X et al., 2016. Risk and contributing factors of ecosystem shifts over naturally vegetated land under climate change in China. Scientific Reports, 20905.

[68]
Yu G R, He N P, Wang Q F, 2013. Carbon Budget and Carbon Sink of Ecosystems in China: Theoretical Basic and Comprehensive Assessment. Beijing: Science Press.

[69]
Yu L, Gu F, Huang M et al., 2020. Impacts of 1.5°C and 2°C global warming on net primary productivity and carbon balance in China’s terrestrial ecosystems. Sustainability, 12(7): 2849.

DOI

[70]
Yuan Q Z, Wu S H, Zhao D S et al., 2014. Modeling net primary productivity of the terrestrial ecosystem in China from 1961 to 2005. Journal of Geographical Sciences, 24(1): 3-17.

DOI

[71]
Zhang G L, Xu X L, Zhou C P et al., 2011. Responses of vegetation changes to climatic variations in Hulun Buir grassland in past 30 years. Acta Geographica Sinica, 66(1): 47-58. (in Chinese)

[72]
Zhang L S, Fang X Q, Ren G Y et al., 1997. Environmental changes in the north China farming-grazing transitional zone. Earth Science Frontiers (China University of Geosciences, Beijing), 4(1/2): 131-140. (in Chinese)

[73]
Zhao T B, Chen L, Ma Z G, 2014. Simulation of historical and projected climate change in arid and semiarid areas by CMIP5 models. Science Bulletin, 59(4): 412-429. (in Chinese)

[74]
Zheng D, 2008. Ecogeographical Regionalization Research of China. Beijing: The Commercial Press. (in Chinese)

Outlines

/