
Journal of Geographical Sciences >
China's agricultural land use change and its underlying drivers: A literature review
Received date: 2020-09-22
Accepted date: 2021-03-09
Online published: 2021-10-25
Supported by
National Key Research and Development Program of China(2017YFE0104600)
National Natural Science Foundation of China(41930757)
Understanding the manifestations and underlying drivers of agricultural land use change in China is of great importance for both domestic and global food security. However, little is known about the holistic pattern of agricultural land use change across China, especially from the perspective of intensity since the evidence has been gathered mainly through case studies at local levels. This study conducts a systemic review of agricultural land use change and its underlying drivers in China by aggregating 169 relevant case studies from 123 publications. The cases related to intensification and disintensification, which are the two types of agricultural land use change, are generally equal, accounting for 50% of the total number of cases. Intensification and disintensification can be further divided into the same three categories: expansion/contraction of agricultural land, changes in agricultural land use activities and changes in land management intensity. Demographic, economic, technological, and institutional drivers, together with location factors, are frequently noted as significant underlying drivers, while sociocultural drivers and farm(er) characteristics are less frequently recognized. Finally, three major land use change trajectories are summarized mainly concerning rising labor costs and the concomitant increase in off-farm employment, the ecological improvement policy, and advances in agricultural technology.
Key words: agricultural land; land use intensity; driving forces; aggregate analysis; China
WANG Xue , LI Xiubin . China's agricultural land use change and its underlying drivers: A literature review[J]. Journal of Geographical Sciences, 2021 , 31(8) : 1222 -1242 . DOI: 10.1007/s11442-021-1894-0
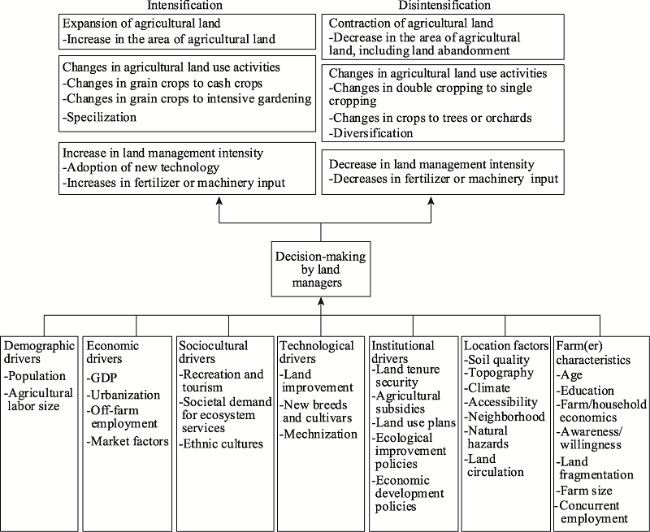
Figure 1 Framework of agricultural land use change and the underlying drivers |
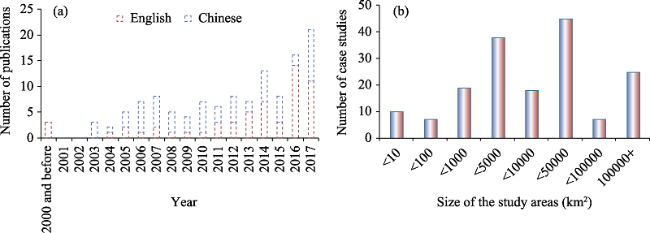
Figure 2 Changes in the number of publications over time (a) and the number of case studies grouped by study area size (b) |
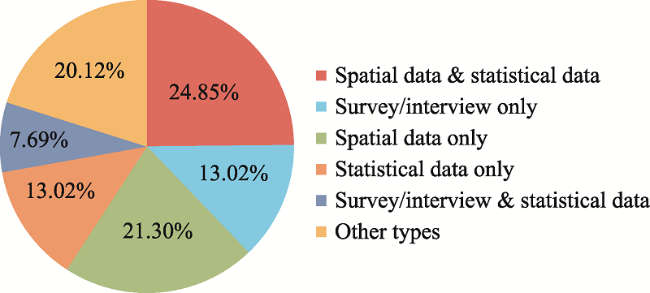
Figure 3 Proportions of different case study groups, categorized by data sources |
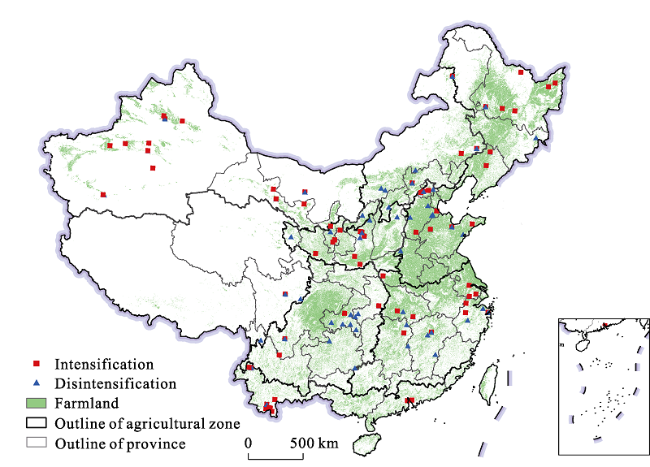
Figure 4 Locations of the case studies and their types of agricultural land use change(Note: Geometric centers of the study areas are presented for case studies. YRR, the Middle-Lower Reaches of the Yangtze River Region; HHH, the Huang-Huai-Hai Region; GXR, the Gansu-Xinjiang Region; LPR, the Loess Plateau Region; SWR, the Southwest China Region; SER, the Southeast China Region; NER, the Northeast China Region; IMR, the Inner Mongolia-Great Wall Region; TPR, the Qinghai-Tibet Plateau Region.) |
Table 1 Proportions of case studies and agricultural land in nine agricultural regions |
| Region | Proportion of case studies (%) | Proportion of agricultural land (%) | ||
|---|---|---|---|---|
| Int | Dis | Total | ||
| YRR | 7.69 | 10.06 | 17.75 | 18.65 |
| HHH | 7.69 | 8.88 | 16.57 | 16.89 |
| GXR | 11.24 | 4.14 | 15.38 | 6.09 |
| LPR | 6.51 | 7.10 | 13.61 | 8.73 |
| SWR | 2.37 | 8.88 | 11.24 | 16.57 |
| SER | 6.51 | 2.37 | 8.88 | 6.31 |
| NER | 5.92 | 1.78 | 7.69 | 17.62 |
| IMR | 1.78 | 4.14 | 5.92 | 8.39 |
| TPR | 0.59 | 2.37 | 2.96 | 0.76 |
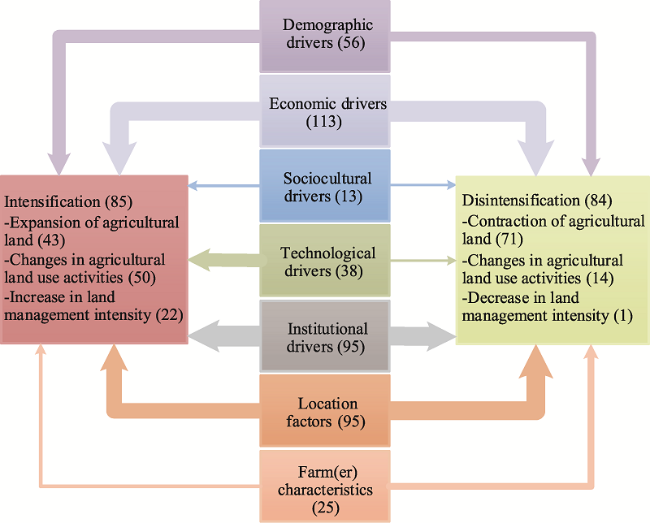
Figure 5 Underlying drivers and their impacts on agricultural land use change(Note: With respect to manifestations of agricultural land change, the number in the parentheses refers to the number of the case studies reported. In terms of underlying drivers, the number in the parentheses refers to the frequency with which a driver is related to a manifestation of change, and the width of the line is drawn proportional to this number.) |
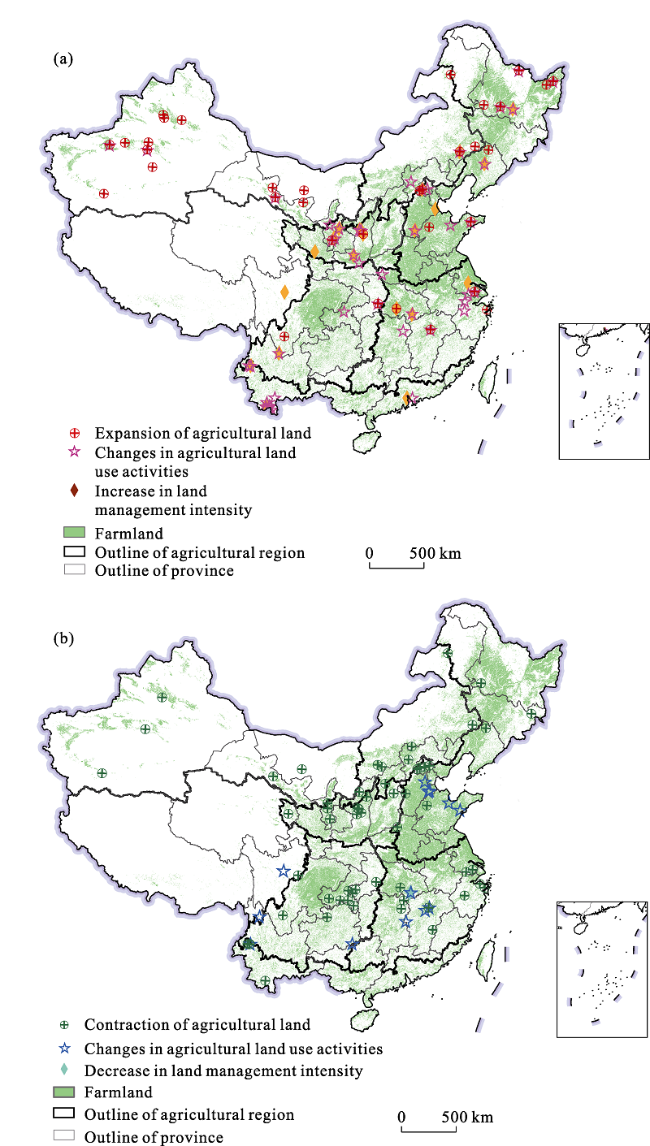
Figure 6 Locations of the case studies for three categories of intensification (a) and disintensification (b) of agricultural land(Note: The geometric centers are presented for case studies with multiple areas or large areas.) |
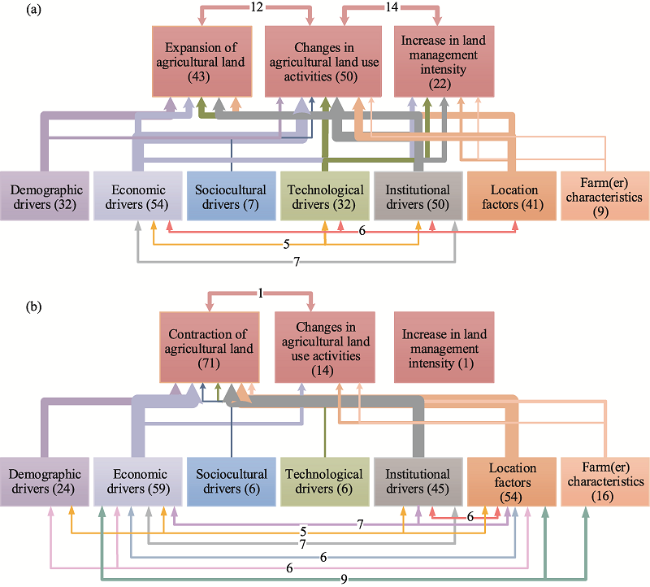
Figure 7 Manifestations and underlying drivers of intensification (a) and disintensification (b) of agricultural land(Note: With respect to manifestations of intensification/disintensification, the number in the parentheses refers to the number of the case studies reported. In terms of underlying drivers, the number in the parentheses refers to the frequency of a driver that is related to a manifestation of change, and the width of the line is drawn proportional to this number. The number on the arrow refers to the cooccurrence frequency of manifestations or underlying drivers within one case. Here, only drivers or cooccurrences that were reported in no less than 5% of the cases are shown.) |
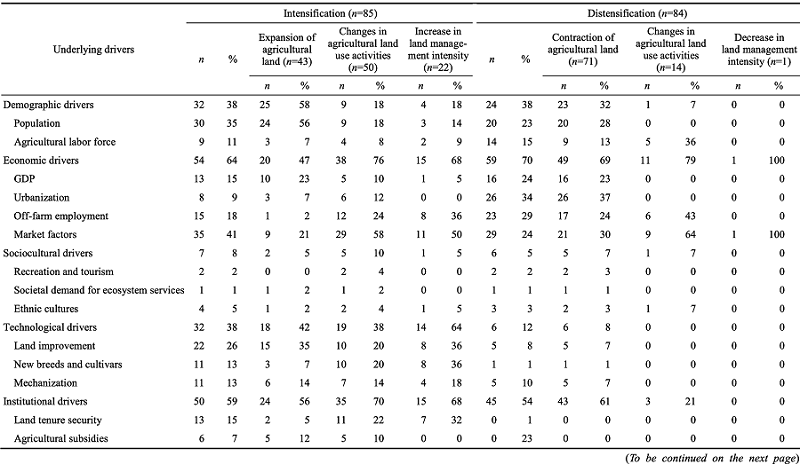
Table 2 Frequencies of the manifestations of intensification/disintensification of agricultural land and the related underlying drivers |
 |
| [1] |
|
| [2] |
|
| [3] |
|
| [4] |
|
| [5] |
|
| [6] |
|
| [7] |
|
| [8] |
|
| [9] |
|
| [10] |
|
| [11] |
|
| [12] |
|
| [13] |
|
| [14] |
|
| [15] |
|
| [16] |
|
| [17] |
|
| [18] |
|
| [19] |
|
| [20] |
|
| [21] |
|
| [22] |
|
| [23] |
|
| [24] |
|
| [25] |
|
| [26] |
|
| [27] |
|
| [28] |
|
| [29] |
|
| [30] |
|
| [31] |
|
| [32] |
|
| [33] |
|
| [34] |
|
| [35] |
|
| [36] |
|
| [37] |
Ministry of Agriculture of China MAC, 2014. Bulletin of the cultivated land quality grade. http://www.moa.gov.cn/govpublic/ZZYGLS/201412/t20141217_4297895.htm. available at: in Chinese)
|
| [38] |
|
| [39] |
|
| [40] |
|
| [41] |
SFC, 2018. China Forestry Development Report 2017. Beijing: China Forestry Publishing House. (in Chinese)
|
| [42] |
|
| [43] |
|
| [44] |
|
| [45] |
|
| [46] |
|
| [47] |
|
| [48] |
|
| [49] |
|
| [50] |
|
| [51] |
|
| [52] |
|
| [53] |
|
| [54] |
|
| [55] |
|
| [56] |
|
| [57] |
|
| [58] |
|
| [59] |
|
| [60] |
|
| [61] |
|
| [62] |
|
| [63] |
|
| [64] |
|
| [65] |
|
| [66] |
|
| [67] |
|
| [68] |
|
| [69] |
|
| [70] |
|
| [71] |
|
| [72] |
|
| [73] |
|
| [74] |
|
| [75] |
|
| [76] |
|
| [77] |
|
| [78] |
|
| [79] |
|
/
| 〈 |
|
〉 |