Regular Articles

Dead shrub patches as ecosystem engineers in degraded drylands

  • Ilan STAVI , 1, 2 ,
  • Eli ZAADY 3 ,
  • Alexander GUSAROV 1 ,
  • Hezi YIZHAQ 4
Expand
  • 1. Dead Sea and Arava Science Center, Yotvata 88820, Israel
  • 2. Eilat Campus, Ben-Gurion University of the Negev, Eilat 88100, Israel
  • 3. Department of Natural Resources, Agricultural Research Organization, Gilat Research Center, 85280 Negev, Israel
  • 4. Department of Solar Energy and Environmental Physics, Blaustein Institutes for Desert Research, Ben- Gurion University of the Negev, Sede Boqer Campus 84990, Israel

Ilan STAVI, E-mail address:

Received date: 2020-12-31

  Accepted date: 2021-03-16

  Online published: 2021-10-25

Abstract

A long-term drought has led to the mass mortality of shrubs in the semi-arid Israeli Negev. The most impacted shrub species is the Noaea mucronata (Forssk.) Asch. and Schweinf. In a four-year study, we found that herbaceous vegetation growth was greater in the dead shrub patches than in the surrounding inter-patch biocrusted spaces, suggesting that the dead shrub patches encompass improved micro-habitats. However, unexpectedly, the soil moisture in the dead shrub patches was consistently lower than that of the inter-patch biocrusted spaces. At the same time, soil quality in the dead shrub patches was higher than that in the inter-patch spaces. Therefore, it seems that the overall better soil conditions in the dead patches overcome the scarcity of soil-water, supporting increased herbaceous productivity. For explaining the discrepancy between herbaceous vegetation and soil-water, we formulated a conceptual framework, which highlights the key factors that regulate soil-water dynamics in this dryland ecosystem. We demonstrate that herbaceous vegetation is facilitated in the dead shrub patches by a legacy effect that takes place long after the shrubs have died. The dead shrub patches encompass a unique form of ecosystem engineering. The study high- lights the complex and unpredicted impacts of prolonged droughts on dryland ecosystems.

Cite this article

Ilan STAVI , Eli ZAADY , Alexander GUSAROV , Hezi YIZHAQ . Dead shrub patches as ecosystem engineers in degraded drylands[J]. Journal of Geographical Sciences, 2021 , 31(8) : 1187 -1204 . DOI: 10.1007/s11442-021-1892-2

1 Introduction

Ecosystem engineering is defined as the non-trophic modulation of landscapes, which is imposed by a few key species of animals, plants, or microorganisms (Gilad et al., 2004). Ecosystem engineers are organisms that either directly or indirectly regulate the productivity of other organisms by controlling their resource availability or by modifying their habitat conditions (Jones et al., 1994). Engineering may involve the physical structure of an organism (e.g., a shrub canopy), or structures made by an organism (e.g., a soil mound associated with a shrub patch). The feedbacks between the biotic and abiotic components determine ecosystem functioning (Jones et al., 1997).
Water is the major limiting factor for primary productivity in drylands (Rodriguez-Iturbe et al., 1999; von Hardenberg et al., 2010; Asbjornsen et al., 2011). In arid and semi-arid regions, the spatio-temporal complexity of precipitation does not allow vegetation to fully cover the hillslopes. Instead, water-limited environments are usually characterized by mosaic-patterned vegetation (Aguiar and Sala, 1999; Deblauwe et al., 2012; Merino-Martín et al., 2012). These vegetal patterns are considered two-phase ecosystems encompassing two distinct microhabitats: woody vegetation patches, and inter-patch spaces that consist of biocrusts (Weber et al., 2016), herbaceous vegetation, and bare soil (Rodriguez-Iturbe et al., 1999; von Hardenberg et al., 2010). During rainstorms - due to differences in water infiltrability between these two types of microhabitats - a relatively large share of raindrops falling on the inter-patch biocrusted spaces do not infiltrate the soil on-site, but flow downslope overland, until reaching a permeable woody vegetation patch (Aguiar and Sala, 1999; von Hardenberg et al., 2010). These source-sink dynamics increase the availability of water for the shrubs, allowing their survival and productivity under the erratic climatic conditions that define drylands (Barbier et al., 2013).
Many studies stress that the flexibility and resilience of such vegetation patterns allow the cover of woody patches to increase during relatively moist episodes, and decrease during relatively dry episodes (e.g., Deblauwe et al., 2012). Several types of vegetation patterns have been described, such as stripes, strands, stipples, gaps, and spirals (Ludwig et al., 1999; Fernandez-Oto et al., 2019). For most of these patterns, the woody vegetation patches were reported to act as sinks for overland water flow and associated suspended and dissolved materials that originate in the source inter-patch biocrusted spaces (Zaady et al., 1996a; Aguiar and Sala, 1999; Asbjornsen et al., 2011; Merino-Martín et al., 2012). Over time, the woody vegetation patches become fertility islands (Garner and Steinberger, 1989; Noble et al., 2001), with considerably improved soil conditions compared to those of the inter-patch spaces (Ludwig et al., 1999; 2005).
In the semi-arid northwestern Negev of Israel, mass mortality of shrubs has been documented, predominantly for the Noaea mucronata (Forssk.) Asch. and Schweinf. The mass mortality event occurred during the long-term drought episode the region has been experiencing since the end of the 20th century (Shachak, 2011; Zaady et al., 2012). However, recent studies in the region showed that this mortality is confined to hillslopes defined with a thick soil layer (> 1 m depth), lacking stones throughout the soil profile and on its surface (Yizhaq et al., 2017; Stavi et al., 2018; 2019). Recent observations in these hillslopes suggest much greater productivity of herbaceous vegetation in the dead shrub patches than in the surrounding, inter-patch biocrusted spaces. The objective of this study was, therefore, to assess whether the difference in herbaceous vegetation cover is related to better soil-water conditions and improved soil quality in the dead shrub patches. The study hypothesis was that greater soil moisture content and better soil quality in the dead shrub patches increases herbaceous vegetation growth.

2 Materials and methods

2.1 Regional settings

The study was conducted in the semi-arid northwestern Negev, Israel, in the Sayeret Shaked Long Term Ecological Research (LTER) station (31°270N, 34°650E; 187 m a.s.l.) (Figure 1). The lithology is comprised of chalk of the Eocene and Plio-Pleistocene eolianites, the topography is characterized by rolling hills, and the soil is sandy loam to loamy sand calcic xerosol. The study was carried out in a ~20 ha land unit, which has been fenced since the late 20th century to prevent livestock access into the LTER area.
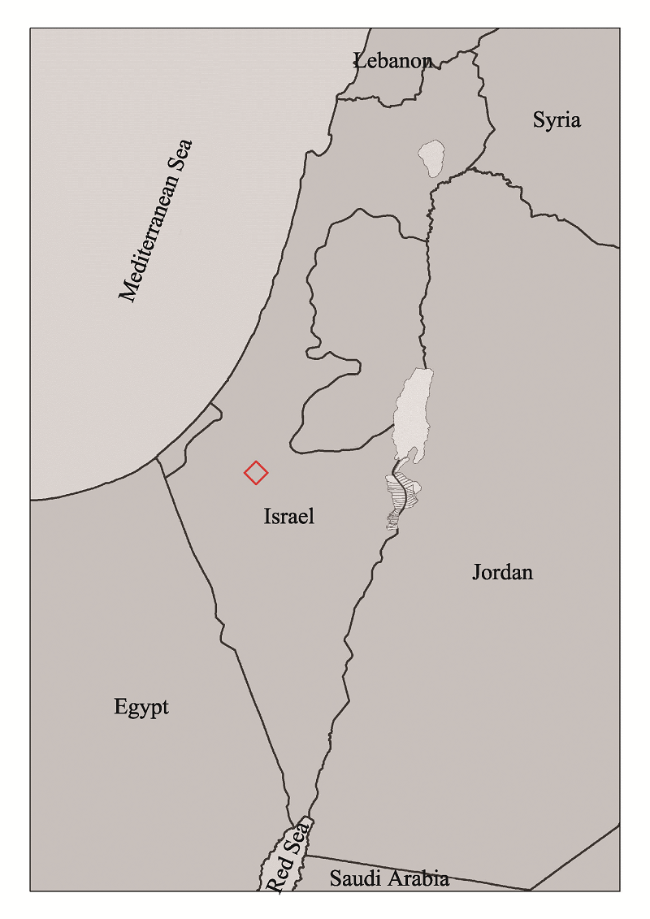
Figure 1 Map of Israel, with an asterisk marking the study site
While some of the hills have a thick and non-stony soil layer (> 1 m depth), other hills are very stony and have a very thin soil layer (~10 cm). In the latter hillslopes, the vegetation community comprises a wide range of thriving, shrubby vegetation species. At the same time, in the hillslop- es with a thick soil-layer, N. mucronate, the predominant shrub species, exhibits high mortality rates (Stavi et al., 2018; 2019). In these hillslopes, herbaceous vegetation productivity in the dead shrub patches was found to be much greater than in the surroun- ding inter-patch spaces (Figure 2).
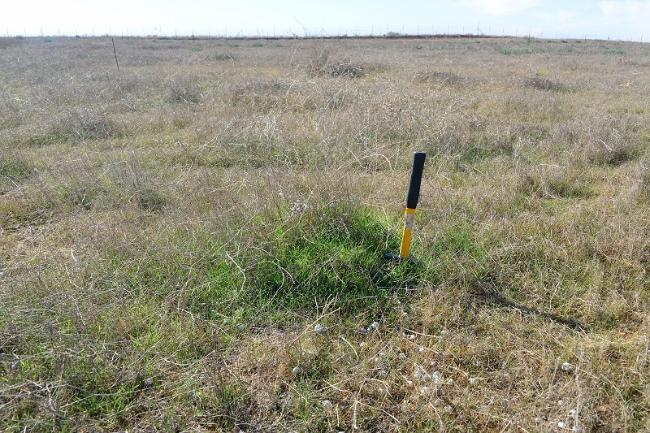
Figure 2 A dead shrub patch, with a hammer at the patch's right edge.

Note the considerably greater biomass of fresh herbaceous vegetation in the patch (the picture's center) than that in the inter-patch space (the picture's margins). Picture was taken in February 2018.

The study was conducted during four consecutive rainy seasons between 2016/17 and 2019/20. Cumulative precipitation was 71 mm in 2016/17, 154 mm in 2017/18, 56 mm in 2018/19, and 110 mm in 2019/20, whereas the long-term average annual precipitation is 150 mm.

2.2 Data collection and laboratory work

Five 100 m2 (10 × 10 m) plots were delineated in hillslopes with a thick soil layer, with similar incline (4º-6º) and orientation (30º-60º), and with a distance of at least 50 m between two adjacent plots. In each plot, three N. mucronata shrubs were randomly selected for the study, all of them dead and at an advanced stage of decay. The very few and sparse living shrubs negated the quantitative assessment of the impact of shrub vitality on the studied variables.
In autumn 2016, we sampled the soil of three dead shrub patches and their nearby inter- patch biocrusted space per plot. In each sampling spot, soil was sampled in two depths (0-5 and 5-10 cm). The number of samples (n) was therefore 5 (plots) × 3 (replicates) × 2 (microhabitats) × 2 (depths) = 60. Soil samples were put in plastic bags and taken to the laboratory to assess their properties.
The laboratory analyses included the determination of: (1) texture (by the hydrometer method: Bouyoucos, 1962); (2) bulk density (the core method) (Grossman and Reinsch, 2002); (3) aggregate stability (using an aggregate stability apparatus: Eijkelkamp®, Giesbeek, the Netherlands); (4) clay dispersion index (by putting an aggregate of 3-5 mm diameter on a plate with distilled water, and observing the rate of cloudiness (milkiness) after 10 min and after 120 min. Scores for clay dispersion index ranged between 0 for no cloudiness, 1 for slight cloudiness, 2 for moderate cloudiness, 3 for strong cloudiness, and 4 for complete cloudiness of the aggregate's clays (modified from: USDA-NRCS EFH NOTICE 210-WI-62); (5) calcium carbonate (Loeppert and Suarez, 1996); (6) pH (in a 1:1 solution ratio) (McLean, 1982); (7) electrical conductivity (in a 1:1 solution ratio) (Richards, 1954); (8) total organic matter (by the loss-on-ignition method (Nelson and Sommers, 1996) after fumigation with diluted hydrochloric acid (Harris et al., 2000). The results were then divided by 1.724 to calculate for total organic carbon); and (9) labile organic carbon (by the mild potassium permanganate oxidation method) (Weil et al., 2003). Then, data of total organic carbon and labile organic carbon allowed the calculation of carbon lability (labile organic carbon/non-labile organic carbon (%/%)) (Blair et al., 1995). Further, for ammonium (N-NH4) and nitrite (N-NO2) determination, soil samples were dried at 65°C for 24-48 h, extracted in 1 M KCl (15-g in 60 mL, for 60 min), filtered, and stored at -20°C until laboratory analysis. N-NH4 was assessed by the Nessler method, and N-NO2 by the sulfanilamide method (Sher et al., 2012).
Additionally, we used a custom-made measuring device to determine the microtopographic transect of both the catenary and lateral axes of each dead shrub patch and its vicinity. The device comprises a 1-m ruler, attached to adjustable tripods and equipped with 100 equally spaced free-falling rods. When measuring, we ensured that each rod touched the ground. For each shrub, the microtopography of the two axes, centered at the shrub's trunk, was assessed. Pictures were analyzed in the laboratory on 1-mm-resolution tiled paper. The number of transects analyzed (n) was 5 plots × 6 shrubs × 2 axes = 60.
During the rainy seasons of four consecutive years (2016/17-2019/20), we monitored the soil moisture content monthly along the lateral axis (perpendicular to the slope) of each shrub and its vicinity. In each plot, three shrub patches and their vicinities were assessed. Measurements were conducted using a 2-m ruler, which was laid down on the ground, centered at the shrub's trunk. Then, the volumetric soil moisture was measured using a TDR (Spectrum Technologies©) with 7.6 cm (3") rods, at 20-cm intervals along the ruler's transect. This yielded 11 soil moisture data points per transect. Longer rods were not used due to soil hardness, and to prevent excessive ground disturbance. The number of transects for the TDR measurements (n) for each monthly monitoring set was 3 shrubs × 5 plots = 15. Soil samples sealed in plastic bags were assessed in the laboratory to calibrate the field-monitored volumetric moisture content data against oven-dried (105ºC for 24 h) results.
Herbaceous aboveground biomass was recorded at the peak of the growing season for each of these four years. In each plot, the herbaceous aboveground biomass was harvested from a 0.04 m2 (0.2 × 0.2 m square) area within the dead shrub patch, and from an additional square at a lateral distance of 1-m from the patch. The harvested biomass was taken to the laboratory, where it was dried in an oven set to 65ºC for 48 h, to assess its dry weight. The number of biomass samples (n) was 3 sites × 2 microhabitats × 5 plots = 30.

2.3 Data analysis

Data analysis was conducted separately for each of the studied variables. Analysis of variance (ANOVA) was conducted with the GLM procedure of SAS (SAS Institute, 1990) to study the effect of microhabitat and depth on the measured soil properties. Factors in the model were microhabitat (1 df), plot (4 df), depth (1 df), and the interaction microhabitat × depth (1 df). Statistically significant interactions were further analyzed with the GLM's SLICE command. Separation of means was implemented by Tukey's HSD at the 0.05 probability level. Pearson correlation coefficients were calculated to assess the relations between each pair of properties. Data were assessed for normal distribution before statistical analysis.
For the microtopographic transects, the height (cm) of each rod along each transect was referenced relative to the lowest rod in each transect, which was defined as the reference level. Then, for each of the 30 transects, the referenced heights obtained from the 100 rods were grouped and mean and standard errors were calculated. Separate calculations were performed for the catenary and lateral microtopographic transects.
The soil moisture content data were normalized relative to the highest value in each transect. Then, for each of the 11 data points, normalized TDR values obtained from the 15 transects were grouped. Variance was analyzed by SAS Software (SAS Institute, 1990), to assess the measuring-point effect (along the 2-m transect) on the normalized volumetric moisture content.
For the herbaceous aboveground biomass, data was separately analyzed for each of the studied years. Statistical analysis was performed by the SAS Software t-test tool (SAS Institute, 1990) to analyze the effect of microhabitat (shrub patch vs. inter-patch space) on herbaceous vegetation biomass.

3 Results

3.1 Soil properties

The two microhabitats exhibited a similar soil mechanical composition - both being sandy loam. Bulk density, clay dispersion index, calcium carbonate content, and pH were statistically and 13%, 43%, 7%, and 6% lower, respectively, in the dead shrub patches than in the inter-patch biocrusted spaces. Aggregate stability, total organic carbon concentration, labile organic carbon, carbon lability, N-NH4, and electrical conductivity were statistically and 75%, 56%, fourfold, over two orders of magnitude, over fivefold, and over twofold greater, respectively, in the dead shrub patches than these in the inter-patch biocrusted spaces. Content of N-NO2 was not significantly affected by microhabitat (Table 1).
Table 1 Microhabitat effect on soil properties
P value Shrub patch Inter-shrub space
Clay (%) 0.7412 16.0 a (0.4) 16.2 a (0.6)
Silt (%) 0.486 17.2 a (0.6) 18.0 a (0.9)
Sand (%) 0.3346 66.8 a (0.7) 65.8 a (0.7)
Texture class - Sandy loam Sandy loam
Bulk density (g/cm3) < 0.0001 1.46 b (0.02) 1.68 a (0.01)
Aggregate stability (%) < 0.0001 69.9 a (2.4) 39.9 b (1.6)
Clay dispersion index < 0.0001 1.3 b (0.1) 2.3 a (0.2)
Total organic carbon (g/kg) < 0.0001 16.9 a (0.6) 10.8 b (0.3)
Labile organic carbon (mg/kg) < 0.0001 359.9 a (20.9) 90.4 b (14.8)
Carbon lability (%/%) < 0.0001 0.021301 a (0.000852) 0.000773 b (0.001116)
N-NH4+ (mg kg-1) < 0.0001 8.27 a (1.45) 1.46 b (0.69)
N-NO2- (mg kg-1) 0.5780 0.065 a (0.005) 0.076 a (0.022)
Calcium carbonate (%) 0.0196 12.2 b (0.2) 13.1 a (0.3)
pH < 0.0001 7.4 b (0.1) 7.9 a (0.1)
Electrical conductivity (µS/cm) < 0.0001 997.5 a (73.3) 461.8 b (34.9)

Notes: Bold P value indicates a significant effect. Means within the same row followed by a different letter differ at the 0.05 probability level according to Tukey's HSD. Numbers within parentheses are standard error of the means.

Soil mechanical composition is sandy loam in the two depths. Bulk density, N-NO2, and pH were statistically and 3%, 47%, and 6% lower, respectively, in the upper than in the lower soil depth. Aggregate stability, total organic carbon concentration, labile organic carbon, carbon lability, N-NH4, and electrical conductivity were statistically and 24%, 25%, 70%, one order of magnitude, twofold, and 47% greater, respectively, in the upper than in the lower soil layer. The clay dispersion index and calcium carbonate content of the two depths were not statistically different (Table 2).
Table 2 Depth effect on soil properties
P value 0-5 cm 5-10 cm
Clay (%) 0.4477 15.8 a (0.4) 16.4 a (0.6)
Silt (%) 0.3488 18.1 a (0.8) 17.1 a (0.7)
Sand (%) 0.6496 66.1 a (0.7) 66.6 a (0.7)
Texture class - Sandy loam Sandy loam
Bulk density (g/cm3) 0.036 1.54 b (0.03) 1.59 a (0.02)
Aggregate stability (%) < 0.0001 62.4 a (3.4) 47.5 b (2.6)
Clay dispersion index 0.5072 1.7 a (0.2) 1.9 a (0.2)
Total organic carbon (g/kg) < 0.0001 15.4 a (0.8) 12.3 b (0.5)
Labile organic carbon (mg/kg) < 0.0001 284.0 a (31.7) 166.4 b (25.7)
Carbon lability (%/%) 0.0004 0.01679014 a (0.0014439) 0.00773081 b (0.0016049)
N-NH4+ (mg kg-1) < 0.0001 6.69 a (1.71) 3.05 b (1.22)
N-NO2- (mg kg-1) 0.0400 0.049 b (0.006) 0.093 a (0.019)
Calcium carbonate (%) 0.1709 12.4 a (0.2) 12.9 a (0.3)
pH < 0.0001 7.4 b (0.1) 7.9 a (0.1)
Electrical conductivity (µS/cm) < 0.0001 956.0 a (81.2) 503.3 b (37.7)

Notes: Bold P value indicates a significant effect. Means within the same row followed by a different letter differ at the 0.05 probability level according to Tukey's HSD. Numbers within parentheses are standard error of the means.

The effect of the interaction between microhabitat and depth was significant for some soil properties. Bulk density was the lowest in the upper layer of the dead shrub patches, intermediate in the lower layer of the dead shrub patches, and the greatest in the two layers of the inter-patch spaces. Aggregate stability was the highest in the upper layer of the dead shrub patches, the second highest in the lower layer of the dead shrub patches, the second lowest in the upper layer of the inter-patch spaces, and the lowest for the lower layer of the inter-patch spaces. Trends of total organic carbon and electrical conductivity were similar to those of aggregate stability (Table 3).
Table 3 Effect of the interaction between microhabitat and depth on soil properties
Bulk density
(g/cm3)
Aggregate
stability (%)
Total organic
carbon (g/kg)
Electrical conductivity
(µS/cm)
P value 0.0154 0.0091 0.0033 0.001
Shrub patch × 0-5 cm 1.40 c (0.03) 80.2 a (2.3) 19.2 a (0.7) 1310.5 a (86.2)
Shrub patch × 5-10 cm 1.51 b (0.03) 59.6 b (1.9) 14.6 b (0.5) 684.6 b (29.6)
Inter-shrub space x 0-5 cm 1.68 a (0.01) 44.6 c (2.5) 11.6 c (0.4) 601.6 b (44.0)
Inter-shrub space × 5-10 cm 1.68 a (0.01) 35.3 d (1.3) 10.0 c (0.2) 321.4 c (17.7)

Notes: Bold P value indicates a significant effect. Means within the same column followed by a different letter differ at the 0.05 probability level according to Tukey's HSD. Numbers within parentheses are standard error of the means.

3.2 Microtopographic transect

Considerable differences in mean surface elevation (H) were recorded along the 1-m transect of the catenary axis. The mean lowest elevation (the reference zero level) was found at the edge of the downslope transect, while the mean highest elevation was next to the shrub's trunk, and ranged between 10.41-10.88 cm above the reference level. The mean elevation of the upslope transect's edge was slightly higher (0.19 cm) than that of the downslope edge. Similarly, for the lateral axis, considerable differences in mean surface elevation were recorded along the transect. A similar mean elevation was recorded for the two transect edges, defining both as the reference level. The mean highest elevation was next to the shrub trunk, and ranged between 13.70-14.34 cm above the reference level (Figure 3).
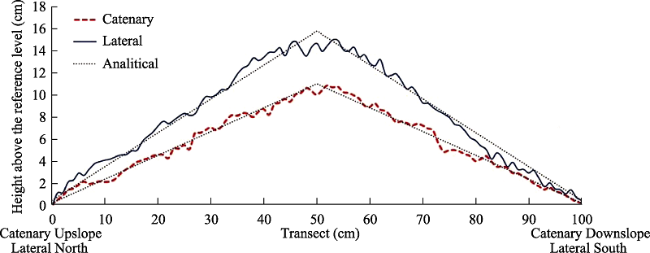
Figure 3 Microtopographic transects of mean catenary and lateral axes of dead shrub patches and their vicinities
A simple linear regression analysis (least square method) provides an analytical expression for mean surface evaluation as a function of distance from the shrub's trunk (Equation 1).
$H = Hmax - k * Abs (c - c0)$
where H is the calculated mean elevation above the reference level, Hmax is the maximum mean value of transect elevation, and Abs (c - c0) is the distance from the shrub's trunk, located at the coordinate c0=50 cm on the transect axis.
The maximum mean Hmax and transect slope coefficient (k), are presented in Table 4.
Table 4 Analytical model parameters for the catenary+lateral transects
Hmax (cm) k R2
Catenary transect 11 -0.22 0.888
Lateral transect 15.8 -0.31 0.828

Notes: Hmax - the maximum mean value of transect height; k - transect slope coefficient; R2 - coefficient of determination.

3.3 Soil moisture content distribution

Soil moisture data were obtained for a total of 23 monthly rainy-season sets: five for 2016/17, seven for 2017/18, five for 2018/19, and six for 2019/20. The maximal range of volumetric moisture content during these rainy seasons ranged between 8.9% during relatively dry episodes and 27.9% following heavy rainstorms.
For the entire set of the four consecutive rainy seasons, the mean normalized volumetric moisture content was significantly affected by location along the 2-m length lateral axis. Overall, means at the center were slightly lower than in the adjacent sections (80 and 120 cm along the transect), and significantly lower than those in the remaining sections along the transect, forming a wide-edged V-shaped pattern of soil-water content (Figure 4).
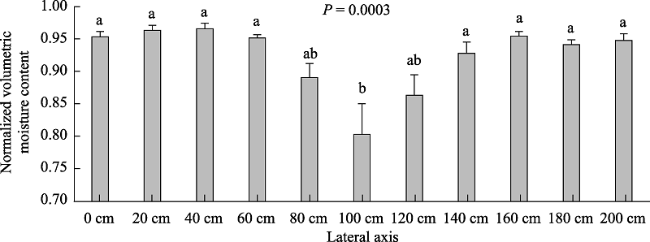
Figure 4 Mean normalized volumetric moisture content distribution along 2-m length lateral axis, during the rainy seasons of four consecutive years (2016/17 through 2019/20).

Notes: the dead shrub's trunk is located in the axis' center (the 100 cm point). Error bars represent standard error of the means. Bars with different letters, differ at the 0.05 probability level according to Tukey's HSD.

3.4 Herbaceous aboveground biomass

For the 2016/17, 2017/18, and 2019/20 growing seasons, mean herbaceous aboveground biomass in the shrubby patches was significantly (P < 0.0001) greater than that in the inter-patch spaces. In the 2018/19 growing season, herbaceous vegetation was extremely sparse (due to scant and late precipitation), and was therefore not harvested for measurements (Figure 5).
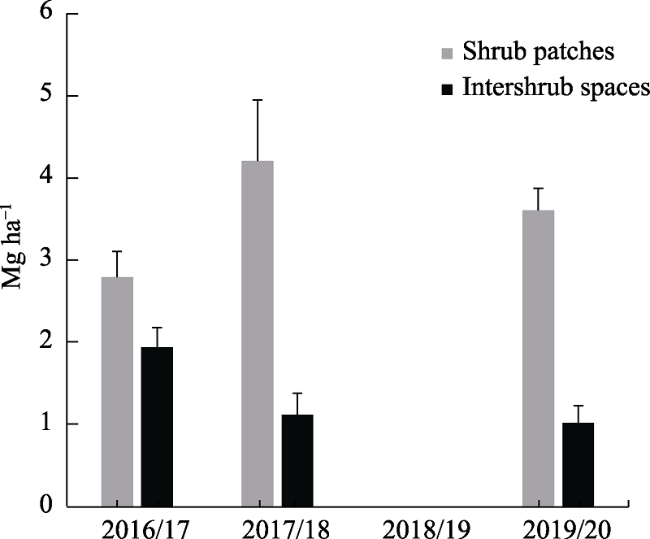
Figure 5 Mean herbaceous vegetation aboveground biomass in shrubby patches and adjacent intershrub spaces, according to growing season.

Notes: error bars represent standard error of the means.

4 Discussion

4.1 Soil quality

The overall better habitat conditions in the dead shrub patches than those of the inter-patch biocrusted spaces are clearly demonstrated by the studied soil properties. Specifically, this is revealed by the significantly higher concentrations of total organic carbon and labile organic carbon, and the higher carbon lability in the shrubby patches. Also, the dead shrub patches exhibit improved physical properties - including bulk density, aggregate stability, and clay dispersion index. These effects accord with studies that showed that organic residues that accumulate in soil stimulate microbial biomass (Diedhiou-Sall et al., 2013) that excrete metabolites (polysaccharides), gluing soil particles together, binding them into water-stable macroaggregates (Chotte, 2005), and decreasing clay dispersion (Oades, 1984). The significant (P < 0.0001) and strongly positive (r = 0.92) correlation between total organic carbon and aggregate stability demonstrates this effect. Also, the significant (P < 0.0001) and negative (r = -0.51) correlation between aggregate stability and clay dispersion further exemplifies this effect.
The moderate content of calcium carbonate in soil of both microhabitats is expected to allow macroaggregation processes (Amézketa, 1999), while not adversely affecting microbial activity (Bashan and Vazquez, 2000) or macronutrient availability for vegetation (Bhargavarami Reddy et al., 2013). Regardless, the significant (P < 0.0001) and strongly negative (r = -0.84) correlations between total organic carbon and pH highlight the stronger buffering of soil alkalinity by the higher organic carbon concentration in the shrubby patches than in the inter-patch biocrusted spaces. This concurs with other studies, which reported that due to weakly acidic functional groups such as carboxyl and phenol, organic matter acts as a pH buffer (Aitken, 1992; Bloom, 2000). Since nutrient availability is negatively affected by high alkalinity conditions (Miller, 2016), the somewhat lower pH in the shrubby patches improves the chemical quality of their soil. At the same time, the significant (P < 0.0001) and strongly positive (r = 0.86) correlations between total organic carbon and electrical conductivity highlight the potentially adverse impact of the high concentration of organic carbon in increasing the soil salinity of the shrubby patches. This effect could be attributed to the attraction of cations by the electro-static forces imposed by the organic residues (Ketterings et al., 2007). Yet, it seems that the adverse effect of high soil salinity in the dead shrub patches is offset by the overall soil quality - as revealed by the other soil properties - supporting higher productivity of herbaceous vegetation in the shrub patches than in the inter-patch spaces.
Assessing soil-nitrogen dynamics in relation to patchiness is necessary for understanding geo-ecosystem functioning in drylands (Whitford, 2002; Zaady, 2005). Plant growth, microbial activity, and nitrogen cycling in drylands peak during short periods of high soil moisture following rainstorms. The nitrogen that accumulates in both microhabitats originates from different sources, including fresh annual plant litter, biological nitrogen fixation, aeolian deposition, overland water flow from the inter-patch biocrusted spaces, and snail excretions (Zaady, 2005), providing the soil with inorganic nitrogen as NH4+ through mineralization. Decomposition and nitrification of organic matter is a two-step microbial process: ammonia-oxidizing microorganisms convert NH4+ to N-NO2 and finally to nitrate (N-NO3). This is the primary process governing the fate of available ammonia in the soil. Sher et al. (2012) reported that in drylands, the potential of ammonia oxidation is the highest during winter. Specifically, they suggested that the soil under dead shrubs is richer in ammonia-oxidizers than soil in inter-patch biocrusted spaces (Sher et al., 2013).
As expected, upper soil layers exhibit better quality than lower layers. This trend applies for bulk density, aggregate stability, total organic carbon, labile organic carbon, carbon lability, N-NH4, and pH. The depth effect revealed an opposite trend for soil N-NO2 content and electrical conductivity. N-NO2 increases with depth because of nitrifiers, which oxidize N-NH4 to N-NO2, and to N-NO3. The last two anions are transported down the soil profile by the soil-water solution. The depth effect for electrical conductivity is attributed to the greater concentration of organic carbon in upper soil layer than in lower layer. Overall, the interactions between microhabitat and depth reveal that the highest soil quality is found in upper soil layers of the shrubby patches and the lowest soil quality in the lower soil layers of the inter-patch spaces, with an opposite trend for electrical conductivity.

4.2 Soil-water dynamics

The consistently lower soil moisture in the dead shrub patches compared to the surrounding inter-patch spaces is highly unexpected and contrary to the greater herbaceous vegetation biomass. This effect can be explained by the combination of the following factors:
(1) Raindrop interception: The greater cover of herbaceous aboveground biomass in the shrubby patches is expected to increase raindrop interception - i.e., raindrops are intercepted by vegetation canopy and evaporate before reaching the ground (Rodriguez-Iturbe et al., 1999), thus less water reaches the soil. This concurs with previous studies, which demonstrated the crucial role of herbaceous vegetation in intercepting raindrops and thus regulating soil-water dynamics (e.g., Ffolliott and Brooks, 2009; Iwara et al., 2018). Yet, the characteristic wide-edged V-shaped pattern of soil-water content along the 2-m transects was also recorded early in the season, before germination of herbaceous vegetation, questioning the relative magnitude of this effect. While raindrops may also be intercepted by residues of the shrub litter cover, the hydrophobic nature of plant-litter (Cesarano et al., 2016) limits raindrop interception by this material.
(2) Transpiration and evaporation: The vigorous herbaceous vegetation growth in the shrubby patches is expected to increase water loss through transpiration. This accords with previous studies that stressed high soil moisture loss through transpiration by herbaceous vegetation in drylands (e.g., Rodriguez-Iturbe et al., 1999; Ffolliott and Brooks, 2009). Yet, like the interception effect, plant cover cannot explain the low soil moisture along the 2-m transects before germination of herbaceous vegetation, questioning the magnitude of this process. At the same time, the relatively heavy shading of the soil surface by the dense cover of herbaceous aboveground biomass (coupled with the sparse cover of shrub litter) in the shrubby patches reduces the intensity of solar heating, lowering the soil temperature (see: Tiedmann and Klemmedson, 1977), and minimizing the loss of soil-water through evaporation (Ffolliott and Brooks, 2009).
(3) Specific effect of the snail-shell cover: A previous study in the same site demonstrated that dead N. mucronata shrubs are colonized by Trochoidea seetzinii snails, which feed on their decaying shoots (Zaady, 2005). The abundant shells of dead snails covering the ground around decaying shrub patches also plays a role in regulating the soil-water cycle in this microhabitat. Throughout the study site, we observed a high shell cover in the dead shrub patches, ranging between 30%-70%. The empty snail shells are positioned at various angles; their opening may be facing upwards, downwards, or sidewards. It seems that the rainwater lost through evaporation from the empty space of upward-opening shells is mitigated by raindrops that flow on the surface of downward- or sideward-facing shells, which easily infiltrate into the soil beneath them. Assuming the shells are positioned randomly, downward- and sideward-facing shells are more common than upward-facing shells. Therefore, the shells' net effect on the soil-water content is still questionable. Additionally, the shells shade the ground, reducing the loss of soil-water through evaporation.
(4) Hydraulic lift: Deep-rooted plants can access water from relatively deep soil layers and exude that water in upper, drier soil layers through hydraulic lift (Horton and Hart, 1998). The resultant increased moisture content in the upper soil layer may then be exploited by herbaceous vegetation (Horton and Hart, 1998; Kizito et al., 2006) that grows in the woody patches. With shrub mortality, hydraulic lift ceases and the moisture content in the patches' upper soil layer is expected to decrease. It should be stressed that at that stage, we have no data to support this track for the N. mucronata shrubs. Yet, while hydraulic lift is a mechanism that possibly takes place in live shrub patches, it is certainly absent in dead shrub patches.
(5) Micro-topography: Soil mounds, found to be associated with the shrubby patches, may promote runoff generation from the central top of the mound to its lower-lying perimeter. This spatial redistribution of water can decrease the soil moisture content at the mound's center, while increasing it at its perimeter. However, this effect is regulated by the considerable surface roughness in the shrubby patches, caused by the dense cover of herbaceous vegetation, litter, and snail shells, which reduce the hydraulic conductivity between the center and perimeter of the patch.
Simultaneously, a set of mechanisms regulate the soil-water dynamics in the inter-patch spaces. A strong determinant of these mechanisms is the cover of biological crusts, which are prevalent in the open spaces across the study region (Shachak, 2011; Yizhaq et al., 2017; Stavi et al., 2018). Particularly, it has been shown that biological crusts determine the infiltration capacity of rainwater to the soil. This effect can be either positive or negative, depending on the prevailing biotic and physical conditions. Among these conditions, the most prominent are the: (1) biological crust's community composition (i.e., the composition of cyanobacteria, lichen, and moss) (Chamizo et al., 2012); (2) soil texture (a positive effect in relatively fine-textured soils, vs. a negative effect in relatively coarse-textured soils) (Warren, 2003); and (3) regional climatic conditions (a positive effect in semi-arid regions, vs. a negative effect in drier regions) (Belnap, 2006). One way or another, some of the rainwater is intercepted by biological crusts, and is lost to the atmosphere through evaporation. Another fraction infiltrates into the soil and is lost through transpiration by the biological crusts (Belnap et al., 2003). At the same time, biological crusts tend to decrease the loss of soil-water through evaporation (Baskin and Baskin, 2014). Further, biological crusts are known to add moisture to the soil by dew condensation (Bu et al., 2015), which is utilized as a water source that supports the growth of the crusts themselves (Kidron et al., 2002).
In addition to the direct impact on the hydrological cycle by controlling the soil-water input and output, biological crusts also indirectly affect its dynamics by regulating herbaceous vegetation. First, biological crusts were reported to facilitate seed entrapment, preventing their removal from the ecosystem by wind or overland water flow (Chambers and MacMahon, 1994). Second, biological crusts were reported to affect the germination rate of herbaceous vegetation (Chambers and MacMahon, 1994; Su et al., 2007). The latter effect can be either positive or negative (Chambers and MacMahon, 1994; Song et al., 2017), and its direction and magnitude mostly depend on the composition of the biological crust's community (Su et al., 2007; Song et al., 2017) and the morphology of the herbaceous plants' seed (Chambers and MacMahon, 1994; Song et al., 2017). The resultant herbaceous vegetation cover regulates the soil-water dynamics in the inter-patch spaces through its effects on interception, infiltration, transpiration, evaporation, and runoff redistribution.

5 General implications and conclusions

Long-term droughts have led to the mass mortality of shrubs in deep-soils and non-stony hillslopes, resulting in vegetation transition from a sparse shrubland mixed with herbaceous vegetation to a dense grassland (Yizhaq et al., 2017; Stavi et al., 2018; 2019). This transition is consistent with the concept of catastrophic regime shift of vegetation patterns in water-limited ecosystems (Zelnik et al., 2013; Meron, 2015; Bastiaansen et al., 2020). Yet, almost two decades later, the overall microhabitat conditions in the dead shrub patches were still much better than those in the surrounding inter-patch spaces, facilitating the growth of herbaceous vegetation. This suggests that the legacy effect persists long after the shrubs die. The legacy effect usually demonstrates the impacts of a species on abiotic or biotic features of ecosystems that persist long after the species has been extirpated or its activity has ceased, and which have an effect on other species (Cuddington, 2011). This mechanism accords with Wurst and Ohgushi (2015), who showed that biotic interactions of plants can have legacy effects mediated by changes in plant traits and soil properties, and stressed that the plasticity of plant traits and soil properties allow these effects to persist long after the causal biotic interaction ceases.
This legacy effect agrees with the concept of ecological engineering, where organisms control the availability of resources in the ecosystem through non-trophic effects (Jones et al., 1994). Yet, dead shrub patches do not qualify as true autogenic engineers, which are defined as organisms that directly transform the environment through endogenous processes that alter their structure, while the engineer remains part of the engineered environment. Instead, the dead shrub patches seem to function as allogenic engineers, which indirectly regulate the availability of resources for other organisms (Jones et al., 1997). In Annex 1, we present a comparison of selected soil properties in dead vs. live N. mucronata patches. This comparison shows similar texture (sandy loam) in soil of the two patches, suggesting no net changes in (erosion and deposition by) aeolian and alluvial processes taking place in the soil mound of the dead shrub patches over time after shrub mortality. Some of the soil properties - including electrical conductivity, labile organic carbon, and carbon lability - indicate better soil quality in the live shrub patches, whereas other soil properties - including bulk density, clay dispersion index, pH, total organic carbon, N-NH4, and N-NO2 - indicate better quality of soil in the dead shrub patches. Calcium carbonate content was similar in the two patche types. Among these properties, the threefold greater N-NH4 concentration in soil of dead shrub patches is noteworthy and may be attributed to the long-term accumulation of organic materials - including dead shrub debris, annual plant litter, snails, and insect remains - during the dry season (Zaady et al., 1996a; 1996b; Ben-David et al., 2011; Sher et al., 2012; 2013). Surprisingly, the electrical conductivity indicates that soil salinity is ~30% greater in the dead shrub patches than in the live ones. The high soil salinity in the dead shrub patches may be attributed to the decay of saline (root and shoot) biomass. Despite being out of the scope of this study, the mass mortality of N. mucronata across the study region may have been triggered by salt accumulation in the patches' soil over time, coupled with the reduced leaching capacity of salts from the rhizosphere due to the prolonged drought conditions.
Annex 1 Soil properties in the 0-10 cm depth of dead and live shrub patches, and the calculated ratio between them

Notes: Means of soil properties for dead shrub patches are combined values of the 0-5 and S-10 cm depths; data forsoil properties in the live shrub patches is obtained from Stavi et al. (2019).

The combined factors and processes, taking place simultaneously in the dead shrub patches and in the inter-patch spaces, result in lower soil moisture content and increased herbaceous biomass in the dead shrub patches. We provide a conceptual framework, highlighting the key factors and processes that play a role in determining this state. This is schematically illustrated in Figure 6. In Annex 2, a comparison of soil-water dynamics in dead vs. live shrub patches is presented. This comparison clearly shows the characteristic wide-edged V-shaped pattern of soil-water content in the dead shrub patches, as opposed to the shapeless and random soil-water distribution in live shrub patches. Further studies are needed in order to isolate and separately explore the relative impact of each of the involved factors that determine the soil-moisture dynamics in the dead shrub patches. Such studies should be conducted in the Israeli north-western Negev, as well as in other drylands, where long-term drought episodes have caused mass mortality of woody vegetation species.
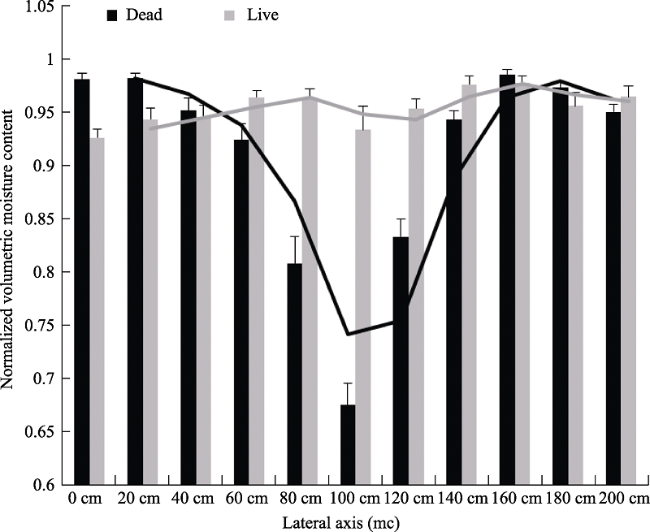
Annex 2 Mean normalized volumetric moisture content distribution and its moving average along 2-m length lateral axis of dead and live shrubs, during the rainy season.

Note: Measurements were taken in nine dead and nine live shrub patches. Error bars represent standard error of the means. Lines represent moving averages.

Figure 6 Schematic illustration of factors and processes that determine the soil-water dynamics in the shrubby patches and inter-patch spaces

Notes: interception in the dead shrub patch is being conducted by the shrub canopy, the dense shoot of herbaceous plants, and the plant litter. In the inter-patch space, this process is conducted by the sparse herbaceous plants. Some interception may also be induced by the biological crusts. In the dead shrub patch, some of the raindrops may be accumulated in the upward-opening snail shells, where they remain until evaporated. Infiltration is facilitated in the dead shrub patch by the shrub root pathways, as well as by the dense root system of the herbaceous plants. In the inter-patch space, this process is facilitated by the sparse roots of herbaceous plants. Some infiltration may also be induced by the biological crusts. Transpiration is conducted in the dead shrub patch by the dense herbaceous plants. In the inter-patch space, this process is conducted by the sparse herbaceous plants. Some transpiration is also induced by the biological crusts. Evaporation is regulated in the dead shrub patch by the shrub canopy, plant litter, snail shells, and the dense herbaceous plants cover. In the inter-patch space, this process is regulated by the sparse herbaceous plants cover, as well as by the dense cover of biological crusts. Also, the biological crusts induce considerable dew condensation, of which some of it is uptaken by the crusts themselves. Despite the dense cover of plant litter and snail shells in the dead shrub patch, some runoff may be generated on its soil mound, down-mound flowing to the inter-patch space. In dead shrub patches, no hydraulic lift takes place.

Acknowledgments

This research was funded by the Israel Science Foundation (ISF), grant number 1260/15. General support was provided by the Ministry of Science and Technology. The authors gratefully acknowledge Michelle Finzi for proofreading of the manuscript. Also, the authors are grateful to two anonymous reviewers, whose comments considerably improved the manuscript.
[1]
Aitken R L, 1992. Relationships between extractable Al, selected soil properties, pH buffer capacity and lime requirement in some acidic Queensland soils. Australian Journal of Soil Research, 30(2):119-130.

[2]
Amézketa E, 1999. Soil aggregate stability: A review. Journal of Sustainanable Agriculture, 14(2/3):83-151.

[3]
Asbjornsen H, Goldsmith G R, Alvarado-Barrientos M S et al., 2011. Ecohydrological advances and applications in plant-water relations research: A review. Journal of Plant Ecology, 4(1/2):3-22.

DOI

[4]
Aguiar M R, Sala O E, 1999. Patch structure, dynamics and implications for the functioning of arid ecosystems. Tree, 14(7):273-277

[5]
Barbier N, Bellot J, Couteron P et al., 2013. Short-range ecogeomorphic processes in dryland systems. In: Mueller E N, Wainwright J, Parsons A Jet al. (eds.). Patterns of Land Degradation in Drylands:Understanding Self-organised Ecogeomorphic Systems. Berlin: Springer,55-84.

[6]
Bashan Y, Vazquez P, 2000. Effect of calcium carbonate, sand, and organic matter levels on mortality of five species of Azospirillum in natural and artificial bulk soils. Biology and Fertility of Soils, 30:450-459.

DOI

[7]
Baskin C C, Baskin J M, 2014. Seeds:Ecology, Biogeography, and Evolution of Dormancy and Germination. 2nd ed. Amsterdam: Elsevier.

[8]
Bastiaansen R, Doelman A, Eppinga M B et al., 2020. The effect of climate change on the resilience of ecosystems with adaptive spatial pattern formation. Ecology Letters, 23(3):414-429.

DOI PMID

[9]
Ben-David E A, Zaady E, Sher Y et al., 2011. Assessment of the spatial distribution of soil microbial communities in patchy arid and semi-arid landscapes of the Negev Desert using combined PLFA and DGGE analyses. FEMS Microbiology Ecology, 76(3):492-503.

DOI PMID

[10]
Belnap J, 2006. The potential roles of biological soil crusts in dryland hydrologic cycles. Hydrological Processes, 20(15):3159-3178.

DOI

[11]
Bhargavarami Reddy C H, Guldekar V D, Balakrishnan N, 2013. Influence of soil calcium carbonate on yield and quality of Nagpur mandarin. African Journal of Agricultural Research, 8(42):5913-5916.

[12]
Blair C J, Lefroy R D B, Lisle L, 1995. Soil carbon fractions based on their degree of oxidation, and the development of a carbon management index for agricultural systems. Australian Journal of Agricultural Research, 46(7):1459-1466.

DOI

[13]
Bloom P R, 2000. Soil pH and pH buffering. In: Sumner M E (ed.). Handbook of Soil Science. Boca Raton: FL CRC Press.

[14]
Bouyoucos G J, 1962. Hydrometer method improved for making particle size analyses of soils. Agronomy Journal, 54:464-465.

DOI

[15]
Bu C, Wu S, Zhang K et al., 2015. Biological soil crusts: An eco-adaptive biological conservative mechanism and implications for ecological restoration. Plant Biosystems, 149(2):364-373.

DOI

[16]
Cesarano G, Incerti G, Bonanomi G, 2016. The influence of plant litter on soil water repellency: Insight from13C NMR spectroscopy. Plos One, 11(3):e0152565.

DOI

[17]
Chambers J C, MacMahon J A, 1994. A day in the life of a seed: Movements and fates of seeds and their implications for natural and managed systems. Annual Review of Ecology, Evolution and Systematics, 25:263-292.

[18]
Chamizo S, Cantón Y, Lázaro R et al., 2012. Crust composition and disturbance drive infiltration through biological soil crusts in semiarid ecosystems. Ecosystems, 15(1):148-161.

DOI

[19]
Chotte J L, 2005. Importance of microorganisms for soil aggregation. In: Buscot F, Varma A (eds.). Soil Biology, Volume 3: Microorganisms in Soils:Roles in Genesis and Functions. Heidelberg: Springer.

[20]
Cuddington K, 2015. Legacy effects: The persistent impact of ecological interactions. Biological Theory, 6:203-210.

DOI

[21]
Deblauwe V, Couteron P, Bogaert J et al., 2012. Determinants and dynamics of banded vegetation pattern migration in arid climates. Ecological Monographs, 82(1):3-21.

DOI

[22]
Diedhiou-Sall S, Dossa E L, Diedhio I et al., 2013. Microbiology and macrofaunal activity in soil beneath shrub canopies during residue decomposition in agroecosystems of the Sahel. Soil Science Society of America Journal, 77(2):501-511.

DOI

[23]
Fernandez-Oto F, Escaff S, Cisternas J, 2019. Spiral vegetation patterns in high-altitude wetlands. Ecological Complexity, 37:38-46.

DOI

[24]
Ffolliott P F, Brooks K N, 2009. Fire effects on hydrological processes of dryland regions. Annals of Arid Zone, 48(3):315-328.

[25]
Garner W, Steinberger Y, 1989. A proposed mechanism for the formation of “fertile islands” in the desert ecosystem. Journal of Arid Environments, 16(3):257-262.

DOI

[26]
Gilad E, von Hardenberg J, Provenzale A et al., 2004. Ecosystem engineers: From pattern formation to habitat creation. Physical Review Letters, 93(9):098105-1-098105-4.

[27]
Grossman R B, Reinsch T G, 2002. Bulk density and linear extensibility. In: Dane J H, Topp G C (eds.). Methods of Soil Analysis (Part 4): Physical Methods. Madison, WI: Soil Science Society of America,201-225.

[28]
Harris D, Horwáth W R, van Kessel C, 2000. Acid fumigation of soils to remove carbonates prior to total organic carbon or Carbon-13 isotopic analysis. Soil Science Society of America Journal, 65(6):1853-1856.

DOI

[29]
Horton J L, Hart S C, 1998. Hydraulic lift: A potentially important ecosystem process. Tree, 13(6):232-235.

[30]
Iwara A I, Njar G N, Ogundele F O et al., 2018. Influence of vegetation characteristics on nutrient loss in the rainforest belt of Agoi-Ekpo, Cross River State, Nigeria. Journal of Applied Sciences and Environmental Management, 22(7):1043-1050.

DOI

[31]
Jones C G, Lawton J H, Shachak M, 1994. Organisms as ecosystem engineers. Oikos, 69(3):373-386.

DOI

[32]
Jones C G, Lawton J H, Shachak M, 1997. Positive and negative effects of organisms as physical ecosystem engineers. Ecology, 78(7):1946-1957.

DOI

[33]
Ketterings Q, Reid S, Rao R, 2007. Cation exchange capacity (CEC). Fact sheet 22, Agronomy fact sheet series. Cornel University Cooperative Extension.http://nmsp.cals.cornell.edu/publications/factsheets/factsheet22

[34]
Kidron G J, Herrnstadt I, Barzilay E, 2002. The role of dew as a moisture source for sand microbiotic crusts in the Negev Desert, Israel. Journal of Arid Environments, 52(4):517-533.

DOI

[35]
Kizito F, Dragila M, Sène M et al., 2006. Seasonal soil water variation and root patterns between two semi-arid shrubs co-existing with pearl millet in Senegal, West Africa. Journal of Arid Environments, 67(3):436-455.

DOI

[36]
Loeppert R H, Suarez D L, 1996. Carbonate and gypsum. In: Sparks D L, Page A L, Helmke P A et al. (eds.). Methods of Soil Analysis (Part 3): Chemical Methods. Madison, WI: American Society of Agronomy,437-474.

[37]
Ludwig J A, Tongway D J, Marsden S G, 1999. Stripes, strands or stipples: Modelling the influence of three landscape banding patterns on resource capture and productivity in semi-arid woodlands, Australia. Catena, 37(1/2):257-273.

DOI

[38]
Ludwig J A, Wilcox B P, Breshears D D et al., 2005. Vegetation patches and runoff-erosion interacting ecohydrological processes in semiarid landscapes. Ecology, 86(2):288-297.

DOI

[39]
McLean E O, 1982. Soil pH and lime requirements. In: Page L A (ed.). Methods of Soil Analysis, Part 2:Chemical and Microbiological Properties. Madison, WI: American Society of Agronomy,199-224.

[40]
Merino-Martín L, Breshears D D, Moreno-de las Heras M et al., 2012. Ecohydrological source-sink interrelationships between vegetation patches and soil hydrological properties along a disturbance gradient reveal a restoration threshold. Restoration Ecology, 20(3):360-368.

DOI

[41]
Meron E, 2015. Nonlinear Physics of Ecosystems. Boca Raton, FL: CRC Press,344.

[42]
Miller J O, 2016. Soil pH affects nutrient availability, fact sheet FS-1054. University of Maryland Extension.https://drum.lib.umd.edu/bitstream/handle/1903/18519/FS-1054%20Soil%20pH%20and%20Nutrient%20Availbility.pdf

[43]
Nelson D W, Sommers L E, 1996. Total carbon, organic carbon, and organic matter. In: Page A L (ed.). Methods of Soil Analysis (Part 2). Madison, WI: American Society of Agronomy,961-1010.

[44]
Noble J, Peltier R, Montagne P et al., 2001. Toward improved management of arid and semiarid banded landscapes. In: Tongway D J, Valentin C, Seghieri J(eds.). Banded Vegetation Patterning in Arid and Semiarid Environments:Ecological Processes and Consequences for Management. Berlin: Springer,210-227.

[45]
Oades J M, 1984. Soil organic matter and structural stability: Mechanisms and implications for management. Plant and Soil, 76(1-3):319-337.

DOI

[46]
Richards L A, 1954. Diagnosis and improvement of saline and alkali soils. In: USDA Agricultural Handbook. Vol. 60, Washington D. C.

[47]
Rodriguez-Iturbe I, D'Odorico P, Porporato A et al., 1999. On the spatial and temporal links between vegetation, climate, and soil moisture. Water Resourses Research, 35(12):3709-3722.

[48]
SAS Institute, 1990. SAS/STAT User's Guide, Version 6, 4th ed. SAS Inst., Cary, NC.

[49]
Shachak M, 2011. Ecological textures: Ecological systems in the northern Negev as a model. Ecology and Environment, 1:18-29. (in Hebrew)

[50]
Sher Y, Zaady E, Ronen Z et al., 2012. Nitrate accumulation in soils of a semi-arid ecosystem following a drought-induced shrub death. European Journal of Soil Biology, 53:86-93.

DOI

[51]
Sher Y, Zaady E, Nejidat A, 2013. Spatial and temporal diversity and abundance of ammonia oxidizers in semi-arid and arid ecosystems: Indications for a differential seasonal effect on archaeal and bacterial ammonia oxidizers. FEMS Microbiology Ecology, 86(3):544-556.

DOI

[52]
Song G, Li X, Hui R, 2017. Effect of biological soil crusts on seed germination and growth of an exotic and two native plant species in an arid ecosystem. Plos One, 12(10):e0185839.

DOI

[53]
Stavi I, Rachmilevitch S, Hjazin A et al., 2018. Geodiversity decreases shrub mortality and increases ecosystem tolerance to droughts and climate change. Earth Surface Processes and Landforms, 43(13):2808-2817.

DOI

[54]
Stavi I, Rachmilevitch S, Yizhaq H, 2019. Geodiversity effects on soil quality and geo-ecosystem functioning in drylands. Catena, 176:372-380.

DOI

[55]
Su Y G, Li X R, Cheng Y W et al., 2007. Effects of biological soil crusts on emergence of desert vascular plants in North China. Plant Ecology, 191(1):11-19.

DOI

[56]
Tiedmann A R, Klemmedson J O, 1977. Effect of Mesquite trees on vegetation and soils in the desert grassland. Journal of Range Management, 30(5):361-367.

DOI

[57]
USDA-NRCS Dispersive clay soils. EFH NOTICE 210-WI-62. https://prod.nrcs.usda.gov/Internet/FSE_ DOCUMENTS/nrcs142p2_024606.pdf.

[58]
von Hardenberg J, Kletter A Y, Yizhaq H et al., 2010. Periodic versus scale-free patterns in dryland vegetation. Proceedings of the Royal Society B:Biological Sceinces, 277(1688):1771-1776.

[59]
Warren S D, 2003. Synopsis:Influence of biological soil crusts on arid land hydrology and soil stability. In: Belnap J, Lange O L (eds.). Biological Soil Crusts:Structure, Function, and Management. Berlin: Springer,349-360.

[60]
Weber B, Büdel B, Belnap J, 2016. Biological soil crusts:An organizing principle in drylands. Ecological Studies 226. Berlin: Springer.

[61]
Weil R R, Islam K R, Stine M A et al., 2003. Estimating active carbon for soil quality assessment: A simplified method for laboratory and field use. American Journal of Alternative Agriculture, 18(1):3-17.

DOI

[62]
Whitford W G, 2002. Ecology of Desert Systems. San Diego, CA: Academic Press, pp.343.

[63]
Wurst S, Ohgushi T, 2015. Do plant- and soil-mediated legacy effects impact future biotic interactions? Functional Ecology, 29(11):1373-1382.

DOI

[64]
Yizhaq H, Stavi I, Shachak M, Bel G, 2017. Geodiversity increases ecosystem durability to prolonged droughts. Ecological Complexity, 31:96-103.

DOI

[65]
Zaady E, 2005. Seasonal change and nitrogen cycling in a patchy Negev desert: A review. Arid Land Research and Management, 19(2):111-124.

DOI

[66]
Zaady E, Groffman P, Shachak M, 1996a. Litter as a regulator of nitrogen and carbon dynamics in macrophytic patches in Negev desert soils. Soil Biology and Biochemistry, 28(1):39-46.

DOI

[67]
Zaady E, Groffman P, Shachak M, 1996b. Release and consumption of snail feces in Negev desert soils. Biology and Fertility of Soils, 23(4):399-404.

DOI

[68]
Zaady E, Shir Y, Ronen Z et al., 2012. The effect of consecutive drought in the northern Negev on soil characteristics and plant mortality. Ecology and Environment, 3:44-52. (in Hebrew)

[69]
Zelnik Y, Kinsat S, Yizhaq Y et al., 2013. Regime shifts in models of dryland vegetation. Philosophical Transactions of the Royal Society A, 371:20120358.

Outlines

/