
Journal of Geographical Sciences >
Economic sustainability of China's growth from the perspective of its resource and environmental supply system: National scale modeling and policy analysis
|
Niu Fangqu (1979‒), PhD and Associate Professor, specialized in urban and regional sustainable development modeling. E-mail: niufq@lreis.ac.cn |
Received date: 2020-10-14
Accepted date: 2020-12-20
Online published: 2021-10-25
Supported by
National Natural Science Foundation of China(42071153)
Priority Research Program of Chinese Academy of Sciences(XDA20080000)
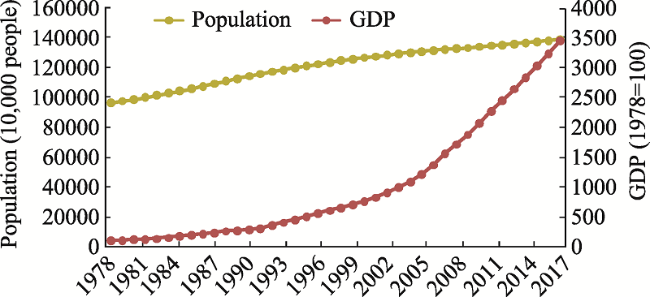
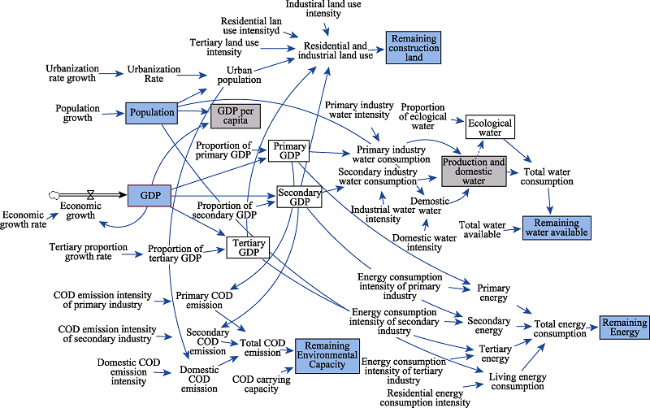
Since the implementation of the economic reform and opening up policy in 1978, China has miraculously created long-term high-speed economic growth, but has also had to face the problem of excessive consumption of resources as well as an intensification of environmental pollution. As a result, China is now facing a slowdown in development. China must maintain a certain speed of development to realize its goal of being a powerful nation, and becoming a developed country by 2050. To this end, China is facing a transformation of its economic development. There is a need to agree on an expected economic growth rate, along with the corresponding development modes or means of regulation in the medium- and long-term periods. This study developed a systematic-dynamic model to simulate the coupling relationship between economic growth, development modes, and the environmental supply system, and explored the possible options for future economic growth as well as the resource use and environmental protection requirements (the main factors). The results showed that to achieve the development goal of becoming a developed country by 2050, while maintaining a good ecological environment, the suitable growth rate for China's economy is 3.8%-6.3%. Within this range, a growth rate of 3.8%-4.4% was found to be relatively safe, while a growth rate of 4.4%-6.3% required further technical progress. This study provides an early warning in regard to China's environmental and development status. The study was a response to the “Future Earth” framework document and, in terms of development speed, it developed a theoretical system for the determination of resource and environmental carrying capacity (RECC).
NIU Fangqu , JIANG Yanpeng . Economic sustainability of China's growth from the perspective of its resource and environmental supply system: National scale modeling and policy analysis[J]. Journal of Geographical Sciences, 2021 , 31(8) : 1171 -1186 . DOI: 10.1007/s11442-021-1891-3
Figure 1 Economic and population growth in China |
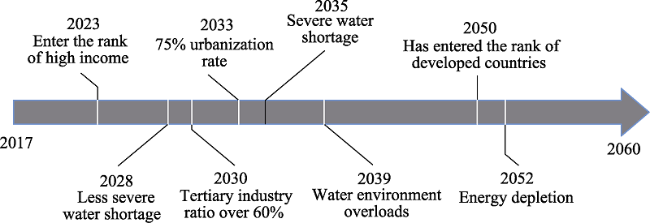
Figure 2 The projected trend of China's extensive development |
Figure 3 The SD model: China model |
Table 1 Parameters of the three development scenarios |
| Parameter categories | Parameters | Current situation | Scenario 1 | Scenario 2 | Scenario 3 |
|---|---|---|---|---|---|
| Population and urbanization | Population growth rate (10,000 people/year) | 750 | World Bank forecast | World Bank forecast | World Bank forecast |
| Urbanization growth rate (percentage point/year) | 1.03 | 0.5 | 0.50 | 0.50 | |
| Industry and economy | Rate of change in the proportion of tertiary production (percentage point/year) | 0.69 | 0.25 | 0.25 | 0.25 |
| Economic growth rate (%) | 6.9 | 3.8 | 6.3 | 4.4 | |
| Water resource | Water consumption intensity of primary industry (m3/USD) | 0.385 | 0.385 | Annual decrease of 1.22 percentage points | Annual improvement of 0.42% |
| Water consumption intensity of secondary industry (m3/USD) | 0.026 | 0.026 | Annual decrease of 1.22 percentage points | Annual improvement of 0.42% | |
| Domestic water consumption intensity (m3/USD per capita) | 60 | 60 | Annual decrease of 1.22 percentage points | Annual improvement of 0.42% | |
| Water environment | COD discharge intensity of primary industry (tons/billion USD) | 4550 | 4550 | Annual decrease of 1.67 percentage points | Annual improvement of 0.42% |
| COD discharge intensity of secondary industry (tons/billion USD) | 260 | 260 | Annual decrease of 1.67 percentage points | Annual improvement of 0.42% | |
| Domestic COD discharge intensity (tons per capita) | 0.0053 | 0.0053 | Annual decrease of 1.67 percentage points | Annual improvement of 0.42% | |
| Energy | Energy consumption intensity of primary industry (million tons/billion USD) | 0.0871 | 0.0871 | Annual decrease of 1.67 percentage points | Annual improvement of 0.42% |
| Energy consumption intensity of secondary industry (million tons/billion USD) | 0.6767 | 0.6767 | Annual decrease of 1.67 percentage points | Annual improvement of 0.42% | |
| Energy consumption intensity of tertiary industry (million tons/billion USD) | 0.131 | 0.131 | Annual decrease of 1.67 percentage points | Annual improvement of 0.42% | |
| Domestic energy consumption (tons per capita) | 0.39 | 0.39 | Annual decrease of 1.67 percentage points | Annual improvement of 0.42% | |
| Land use | Industrial land consumption intensity (km2/billion USD) | 2.652 | 2.652 | 2.652 | 2.652 |
| Tertiary land use intensity (km2/billion USD) | 0.864 | 0.864 | 0.864 | 0.864 | |
| Residential land use intensity (km2/billion people) | 20870 | 20870 | 20870 | 20870 |
| [1] |
|
| [2] |
|
| [3] |
|
| [4] |
|
| [5] |
|
| [6] |
Future Earth Transition Team FETT, 2012. Future Earth: Research for global sustainability: A framework document.http://www.homeofgeography.org/uk/News_2012/ICSU_FutEarth.pdf accessed in Dec. 2019.
|
| [7] |
|
| [8] |
|
| [9] |
|
| [10] |
|
| [11] |
|
| [12] |
|
| [13] |
|
| [14] |
|
| [15] |
|
| [16] |
|
| [17] |
|
| [18] |
|
| [19] |
|
| [20] |
|
| [21] |
|
| [22] |
|
| [23] |
|
| [24] |
Ministry of Housing and Urban-rural Development of the People's Republic of China MOHURD, 2018. China Urban Construction Statistical Yearbook. Beijing: China Planning Press.
|
| [25] |
National Bureau of Statistics of China NBSC, Ministry of Environmental Protection of China MEPC, 2015. China Statistical Yearbook on Environment 2015. Beijing: China Statistics Press.
|
| [26] |
National Bureau of Statistics of China NBSC, Ministry of Environmental Protection of China MEPC, 2017. China Statistical Yearbook on Environment 2017. Beijing: China Statistics Press.
|
| [27] |
National Bureau of Statistics of China NBSC, 2017. China Energy Statistical Yearbook 2017. Beijing: China Statistics Press.
|
| [28] |
National Bureau of Statistics of China NBSC, 2018a. China Statistical Yearbook 2018. Beijing: China Statistics Press.
|
| [29] |
National Bureau of Statistics of China NBSC, 2018b. China City Statistical Yearbook 2018. Beijing: China Statistics Press.
|
| [30] |
|
| [31] |
National Information Center of China NICC, 2016. Measurement and decomposition of China's total factor productivity. http://www.sic.gov.cn/News/455/6841.htm accessed in Dec. 2018.
|
| [32] |
|
| [33] |
|
| [34] |
|
| [35] |
|
| [36] |
State Council of China SCC, 1994. China Agenda 21.http://www.scio.gov.cn/wszt/wz/Document/880092/880092.htm accessed in Aug. 2018.
|
| [37] |
Statista, 2018. U.S. Energy consumption. https://www.statista.com/topics/833/energy-consumption/ accessed in Jan. 2019.
|
| [38] |
|
| [39] |
|
| [40] |
USGS, 2019. Total water use. https://water.usgs.gov/watuse/wuto.html accessed in Feb, 2019.
|
| [41] |
|
| [42] |
|
| [43] |
|
| [44] |
|
| [45] |
|
| [46] |
|
| [47] |
|
| [48] |
|
| [49] |
|
| [50] |
|
| [51] |
|
| [52] |
|
| [53] |
|
| [54] |
|
| [55] |
|
| [56] |
|
| [57] |
|
/
| 〈 |
|
〉 |