Special Issue: Ecohydrology

Calculation of instream ecological water requirements under runoff variation conditions: Taking Xitiaoxi River in Taihu Lake Basin as an example

  • WANG Qin , 1 ,
  • WANG Shuwen 2 ,
  • HU Qingfang , 1, 3, * ,
  • WANG Yintang 1, 3 ,
  • LIU Yong 1 ,
  • LI Lingjie 1, 3
Expand
  • 1. State Key Laboratory of Hydrology-Water Resources and Hydraulic Engineering, Nanjing Hydraulic Research Institute, Nanjing 210029, China
  • 2. Water Conservancy Bureau of Huzhou, Huzhou 313000, China
  • 3. Yangtze Institute for Conservation and Development, Nanjing 210098, China
Hu Qingfang (1981‒), PhD and Professor, specialized in hydrologic forecast & water resources planning. E-mail:

Wang Qin (1995-), MD, specialized in hydrology and water resources. E-mail:

Received date: 2020-12-06

  Accepted date: 2021-05-10

  Online published: 2021-10-25

Supported by

National Key Research and Development Program of China(2018YFC1508204)

Special Program for Public Welfare Industrial Scientific Research of the Ministry of Water Resources(201401015)

Special Program for Public Welfare Industrial Scientific Research of the Ministry of Water Resources(201501014)

National Natural Science Foundation of China(51509157)

Abstract

Climate change and human activity can cause remarkable hydrological variation. Traits of hydrological series such as runoff before and after the change points could be significantly different, so the calculation of instream ecological water requirements (EWRs) is confronted with more challenges. Taking the Xitiaoxi River (XTXR) in the upper reach of the Taihu Lake Basin as an example, this paper investigates the calculation of EWRs using the range of variability approach (RVA) under changing environment. The change point diagnosis of the natural and observed runoff series are conducted for XTXR. Then, differences in the hydrological alternation indicators and instream EWRs processes obtained from various daily runoff series are compared. It was found that the natural and observed annual runoff series in XTXR from 1957 to 2018 both show significant variations, and the change points are in 2007 and 1999 respectively. If runoff data before the change points or all runoff data are used, the instream EWRs obtained from natural runoff are significantly lower than those obtained from the observed runoff. At the monthly time step, EWRs differences within a year mainly occurred from May to August. Also, calculation results of the instream EWRs are strongly related to the selected period of runoff series. The EWRs obtained using runoff series after the change points have rather acute fluctuation within a year. Therefore, when the RVA method is used under changing environment, the instream EWRs should be prudently determined by comparing different calculation results on the basis of river runoff restoration and variability analysis. To a certain extent, this paper enriches our understanding about the hydrological method for EWRs estimation, and proposes new ideas for future research on EWRs.

Cite this article

WANG Qin , WANG Shuwen , HU Qingfang , WANG Yintang , LIU Yong , LI Lingjie . Calculation of instream ecological water requirements under runoff variation conditions: Taking Xitiaoxi River in Taihu Lake Basin as an example[J]. Journal of Geographical Sciences, 2021 , 31(8) : 1140 -1158 . DOI: 10.1007/s11442-021-1889-x

1 Introduction

With the increasingly prominent ecological and environmental problems, people have gradually realized the importance of river ecological protection and restoration, and this gave rise to the research on the instream ecological water requirements (EWRs) (Li et al., 2014). Scholars at home and abroad have put forth a series of concepts such as basic water requirements, instream flow, minimum instream flow requirements, environmental instream flow requirements and minimum EWRs (Karim et al., 1995; Gleick, 1998; Song et al., 1998; Cui et al., 2005), and a large number of calculation methods for EWRs have been developed. These methods can be roughly grouped into four categories (Tharme, 2003; Wang et al., 2020), including the hydrological methods by using the historical flow data (e.g. Tennant, Texas, NGPRP, IHA etc.) (Tennant, 1976; Matthews et al., 1991; Richter et al., 1996; 1997, 1998; Cui Y et al., 2010), hydraulic methods based on the hydraulic characteristics of a river channel section (e.g. wetted perimeter method, R2CROSS etc.) (Ubertini et al., 1996; Gippel et al., 1998), habitat methods based on the hydraulical conditions indicating the demand by the species (e.g. WUW, IFIM etc.) (Bovee et al., 1998) and comprehensive methods considering the overall characteristics of regional ecological environment (e.g. BBM etc.) (King et al., 1998). Among all kinds of methods, hydrological methods have been widely used because of their relatively easy access to data and no need of field observation (Wang et al., 2020). For example, Shen (2015) improved the minimum monthly flow method of typical year and flow duration curve method combining the key reproduction period of the fishes, and proposed the minimum flow method of typical period and the period-by-period flow duration curve method, to estimate the ecological base flow process in a year. Pan et al. (2012) proposed the dynamic calculation method of water requirements on the basis of the Tennant method, modifying the fixed percentage of the Tennant method to variation with the change of flow regime. In view of the obvious seasonality of northern rivers in China, Zhao et al. (2018) substituted the percent of the average flow in the same periods by the ratio of the annual runoff in extreme drought years (P=90%) to the multi-year average runoff, thus broadening the applicability of the dynamic calculation method. Long and Mei (2017) put forward a probability weighted FDC (flow-duration curve) method to calculate the stream basic ecological flow for the typically wet, normal and dry years. The probability was based on the historical data with the Copula function method. Zhang et al. (2017) proposed taking 75% of the range of variability approach (RVA) target difference as recommended river ecological base flow during non-flood season, pre-flood season and post-flood season, while 50% of the RVA target difference is taken as recommended river ecological base flow during the main flood season.
Influenced by climate change and human activities, many river runoff series have undergone varying degree of variation, and it is often difficult to guarantee their consistency (Xie et al., 2005), making some hydrologic calculation methods no longer directly applicable. Therefore, when hydrologic methods are used to calculate the instream EWRs, attention should be paid to the consistency of runoff series, in addition to ensuring that hydrologic data series meet the basic requirements. This issue has been explored in literatures. Xiao et al. (2016) examined the variability of runoff series in Dongjiang River, and calculated the instream ecological flow based on the mean monthly flow before the variation point. Li et al. (2011) also carried out similar researches. Huang et al. (2020) drew on the IHA and RVA methods, and based on the water level series before the mutation, proposed an indicator system for calculating suitable ecological water level that takes into account the monthly mean water level, the fluctuation range of annual water level, frequency and duration of high and low water levels, and rate and frequency of water level condition changes. Shi et al. (2014) delineated different hydrological variation stages according to the degree of disturbance to the runoff and calculated the instream EWRs by stages. However, in these literatures, although the variation points of river runoff were diagnosed and the instream EWRs were calculated with runoff series in different stages as reference, the EWRs were calculated all with observed runoff series, actually assuming that the runoff series before the variation point were natural, or little disturbed by human activities, therefore the rationality is questionable. There were also a small number of researches that performed restoration calculation of runoff, but they are not representative enough as the runoff series length before the variation point was short, actually not meeting the requirements on data length of the hydrological calculation method for EWRs.
XTXR is located in the southwest of the Taihu Lake Basin. This river has abundant water flow with good quality, and is one of the main clean water sources of the Taihu Lake. Thus, this river is of ecological and environmental significance. Reasonable determination and guarantee of the EWRs of XTXR is not only the basis for maintaining its own good water ecological state, but also extremely important for maintaining the ecological health of the Taihu Lake. In fact, due to the coupling impacts of climate change and human activity, hydrologic traits probably vary dramatically, resulting in significant differences in river runoff among different periods. Based on the consideration of hydrological variation, this paper studies the estimation of instream EWRs given the runoff variation conditions. Emphasis is given to analysis of the influence of use of observed and natural runoff data on instream EWRs calculation results. In the meantime, comparison is made on the differences of EWRs calculated using runoff series of different time periods. The main objective is to provide data reference and technical support for the establishment of EWRs standard under changing environment.

2 Research method

The research idea of this paper is shown in Figure 1. First, hydrological model is used for restoration of observed runoff to obtain the daily natural runoff process. Then, the variation of observed and natural runoff is diagnosed respectively. After that, according to the location of runoff variation points, the RVA method is used to calculate the instream hydrological alternation indicators and EWRs on the basis of the observed and natural runoff data in different time periods. Finally, a comparative analysis of the differences of instream EWRs obtained from different types and different periods of runoff data is conducted.
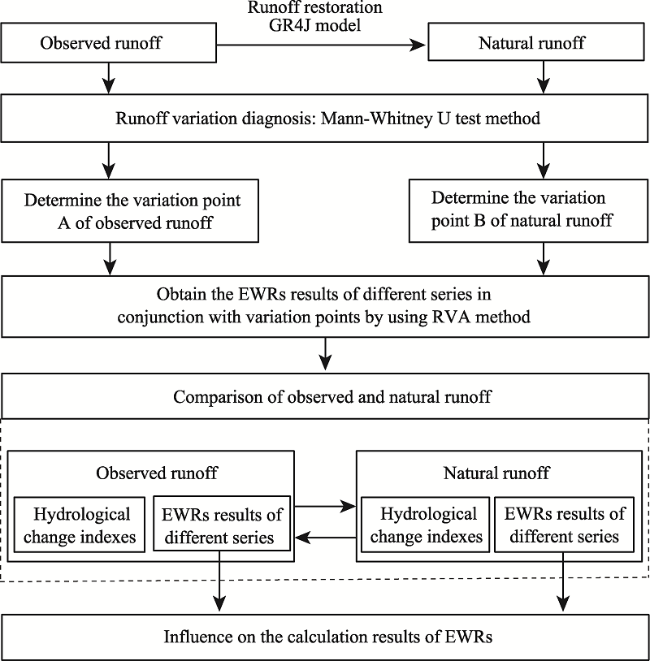
Figure 1 The flowchart of this paper

2.1 Runoff restoration methods

Runoff restoration methods mainly include item-by-item investigation method, evaporation difference method, rainfall runoff relationship method and hydrological model method, etc. (Chen et al., 2016). It is generally considered that under the specific underlying surface conditions, if the hydrological model does not take into account the influence of regulation by water conservancy projects and artificial water extraction, the simulated instream runoff process is the natural runoff process. In this paper, the hydrological model GR4J ($\text{mod{e}'}\ \text{le}\ \text{du}\ \text{G{e}'}\ \text{nie}\ \text{Rural}\ \text{{a}'}\ \text{4}\ \text{param{e}'}\ \text{tres}\ \text{Journalier}$) is used for the restoration calculation of the daily runoff of XTXR. This model is a conceptual rainfall-runoff model with simple structure that has only four parameters. It has been applied in more than 400 basins with different climatic and geographical conditions all over the world, and has relatively high precision in application for southern China (Perrinc, 2003; Deng et al., 2014; Deng et al., 2014).

2.2 Runoff variation diagnosis methods

There are many methods for detecting variation points of hydrological series, and those commonly used include R/S analysis (Wang et al., 2002), orderly clustering (Ding, 1986), moving rank-sum test (Mann-Whitney U test) (Lei et al., 2007), Mann-Kendall (Mann, 1945; Kendall, 1975), and Pettitt test (Pettitt, 1979), etc. Xu (2013) used the vector similarity weighting principle to calculate the weight of hydrological variation test method, and concluded that the moving rank-sum test had the highest test efficiency under different variation conditions. Therefore, in this paper, the moving rank-sum test method (Mann-Whitney U test) is used to diagnose runoff variability. The specific principle of this method can be found in the literature Xu (2013).

2.3 Calculation method for EWRs

Richter et al. created a system of Indicators of Hydrologic Alteration (IHA) to assess instream ecological and hydrological changes. IHA includes 33 key hydrological parameters of ecological significance that reflect flow magnitude, time, frequency, duration, and rate of change, and it generally requires more than 20 years of river daily runoff data. The range of variability approach (RVA) proposed by Richter et al. (1997) is based on the IHA indicators system, and is designed to evaluate the variation degree of river hydrological indicators before and after variation by analyzing the daily river flow data of long series and setting the upper and lower limits of each indicator - the RVA threshold. Generally, the occurrence probabilities of 75% and 25% of each IHA indicator are used as the RVA thresholds of each indicator parameter.
The RVA threshold describes the variable range of river flow process, which is also the varying range that the ecosystem can withstand, and provide a reference for determining the instream basic EWRs. Ma (2013) used 50% of the RVA threshold range to estimate the EWRs of the middle and lower reaches of Weihe River, and obtained good results. Therefore, this paper also uses 50% of the RVA threshold range to estimate the basic EWRs of Hengtangcun Station (HTCS) of XTXR:
EWRsj=0.5× (RVAj,upper - RVAj,lower)
where j=1, …, 12, stands for the months in a year; EWRsj stands for the EWRs of the jth month; RVAj, upper stands for the upper threshold value of the jth month, RVAj, lower stands for the lower threshold value of the jth month, respectively referring to the values of 75% and 25% of the occurring probability of monthly mean flow in each month.

3 Research area and data

3.1 Research area

XTXR, lying between 119°14°E-119°45°E and 30°22°N-30°45°N, originates from the northern foot of Tianmu Mountain and flows into Taihu Lake from northwest to southeast. Most of its basin area belongs to Anji County of Huzhou City, and its geographical location is shown in Figure 2. The basin topography is high in the southwest and low in the northeast. Mountains, low hills and plains are in cascade distribution. The Hengtangcun Station (HTCS) is an important control station of the XTXR. In this paper, the catchment area upstream the station is taken as the research area (the catchment area, 1316 km2). The annual precipitation of the basin is 1567.4 mm, and the annual mean runoff volume is 10.3×10⁸ m3. The intra-annual distribution of precipitation and runoff is extremely uneven, mainly concentrated in summer and autumn.
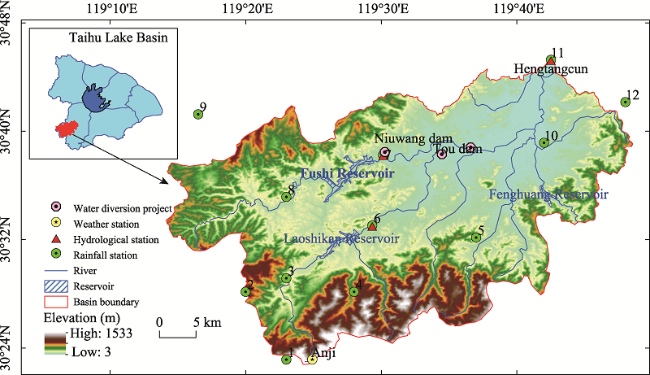
Figure 2 Location and topography of the study area and the hydrological and meteorological gauges distribution
There are two large reservoirs in the basin - Laoshikan Reservoir and Fushi Reservoir and a medium-sized reservoir - Fenghuang Reservoir. Laoshikan Reservoir, with a total storage capacity of 117 million m3, is located on Nanxi, a tributary of XTXR. It began to store water for operation in July 1966. Fushi Reservoir was built on Xixi River, the main source of XTXR, with a total storage capacity of 218 million m3. It was officially put into operation in June 1980. In addition, there are three large weir dams, namely, Wuxiang Dam, Touba Dam and Niuwang Dam, each can irrigate more than 666,67 ha of land.

3.2 Data

(1) Precipitation data: the consecutive daily rainfall data of 12 rainfall stations in the basin from 1957 to 2018 were collected, and the spatial distribution of rainfall stations is shown in Figure 2. The consecutive daily mean rainfall in the basin was calculated with the Thiessen polygon method.
(2) Evaporation data: the day-to-day water surface evaporation data of the three evaporation stations at Fushi Reservoir, Laoshikan Reservoir and HTCS from 1975 to 2018 were collected. The mean water surface evaporation in the basin was obtained with the Thiessen polygon method. Also, from China meteorological data sharing service network (http://cdc.cma.gov.cn/home.do), the evaporation data of the small evaporator at Anji Meteorological Station close to the basin were obtained, and their relationship with the day-to-day water surface evaporation of the basin of 1975-2018 was established, thus the daily mean water surface evaporation of the basin of 1957-1974 was obtained by interpolation and extension.
(3) Flow data: the observed daily flow data of HTCS of 1957-2018 were collected, and the data were reorganized and quality controlled by the hydrological department.

4 Result analysis and discussions

4.1 Runoff simulation and restoration

Laoshikan Reservoir in the XTXR Basin was put into service in 1965. Considering the low level of economic and social development, few large and medium-sized water conservancy projects and small scale of artificial water intake in the basin by this time, it was believed that the observed runoff process of XTXR was close to the natural runoff process before 1965. Therefore, the daily runoff data from HTCS of 1957-1964 were selected to calibrate and verify the GR4J model (for which the calibration period was 1957-1960, the verification period was 1961-1964, and SCE-UA was used as the model parameter optimization algorithm). Then, the calibrated model was used for simulation to obtain the day-to-day natural runoff process of 1965-2018 based on the precipitation and evaporation data. Figure 3 shows the observed and natural daily runoff during the calibration period (1957-1960) and verification period (1961-1964) at HTCS, and the NSE and RE values for the simulated daily river discharge at HTCS were listed in Table 1. The simulation results show that by adjusting the model parameters, the NSE of GR4J were respectively 0.69 and 0.73 in the calibration period and verification period, and the RE of total runoff were respectively 0.79% and -8.96% (NSE1 and NSE2 are respectively the Nash efficiency coefficient in the calibration period and verification period, RE1 and RE2 are respectively the water flow balance relative error in the calibration period and verification period, and x1-x4 for the parameters of GR4J), although the statistics were not very good, the simulation discharge at HTCS still performed well. In general, the model effectively captured the temporal variability of streamflow at HTCS.
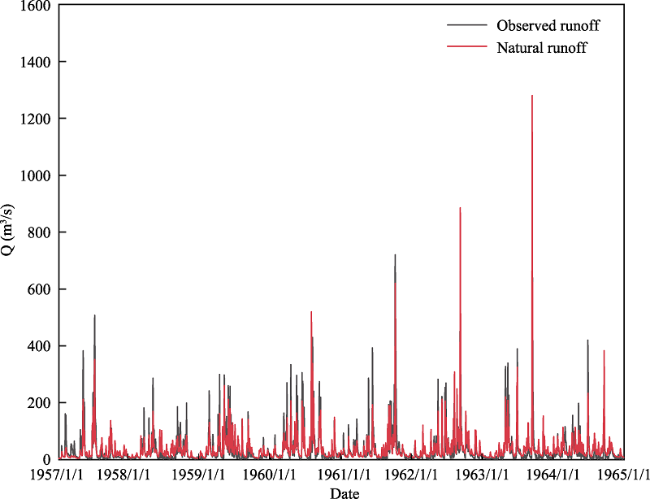
Figure 3 Comparison of the observed and natural daily runoff at HTCS during the calibration period (1957-1960)and verification period (1961-1964)
The model captured the time of the peak, failed to accurately capture the magnitude of the flood peak, which caused the low accuracy of the model. For the inputs to the mode, for example, the precision of observations was not high enough in the 1950s and 1960s, additionally, uniform distribution in wet and dry years during the calibration and verification was needed. These all could be reasons for the differences between natural flow and observed flow from the period of calibration to verification.
Table 1 Calibration and verification results of GR4J in XTXR
Calibration period (1957‒1960) Verification period (1961-1964) Parameter calibration value
NSE1 RE1 (%) NSE2 RE2 (%) x1 (mm) x2 (mm) x3 (mm) x4 (d)
0.69 0.79 0.73 -8.96 1059.8 0.5 30.2 3.3
The accumulation curves between the annual precipitation and observed runoff depth in 1957-1964 is given in Figure 4. Also, in this figure the same curve is plotted between the annual precipitation and natural runoff depth in 1965-2018. As shown in Figure 4, the double accumulation curve was nearly a straight line, and the square of the correlation coefficient (r2) is 0.999. It was considered that the relationship between the precipitation and the observed flow in 1957-1964 is the same as the relationship between the precipitation and the natural flow in 1964-2018. Thus, the restored runoff process of 1965-2018 by GR4J model can be deemed close to the natural runoff process.
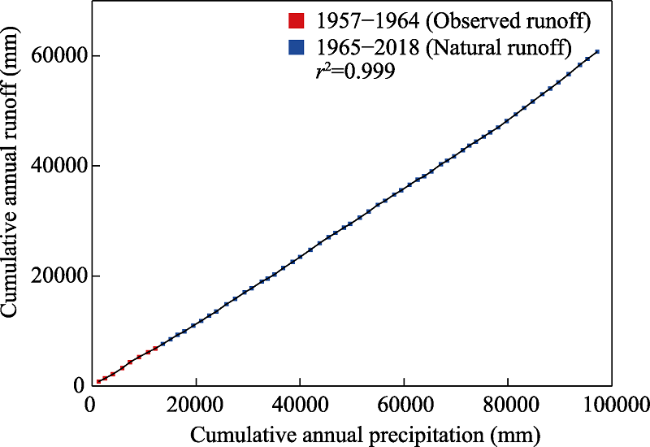
Figure 4 The accumulation curve between the annual precipitation and observed runoff depth in 1957-1964. Also, this curve is drawn for the annual precipitation and natural runoff depth in 1965-2018.
Figure 5 shows the comparison between the observed and natural daily runoff process of 1965-2018. The observed daily runoff was between 0-1130.0 m3/s with the mean value as 32.1 m3/s; the natural daily runoff was between 2.8-1129.6 m3/s with the mean value as 41.6 m3/s. The mean value of the natural daily runoff increased by 9.6 m3/s compared with the observed value. It can be seen from Figure 5 that the difference between the observed and natural runoff processes in XTXR was fairly obvious, and it can be seen that medium and small floods were obviously influenced by the reservoir regulation and other factors.
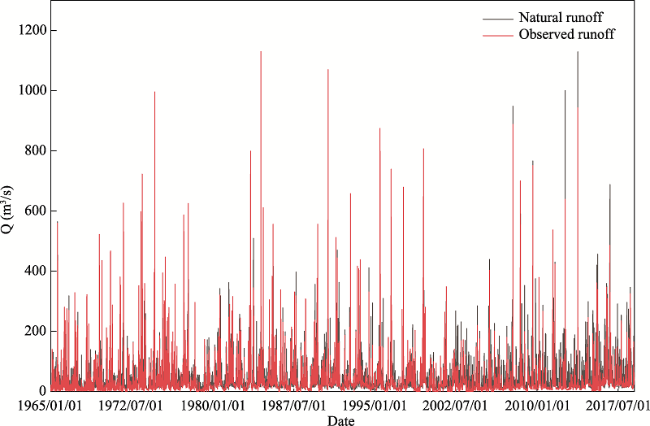
Figure 5 Comparison of the observed and natural daily runoff at HTCS from 1965 to 2018

4.2 Runoff variation diagnosis

4.2.1 Natural runoff variation

Mann-Whitney U test was used to diagnose the variability of natural runoff series of 1957-2018 at HTCS. The diagnostic indicators included the annual runoff and concentration period RCP, concentration degree RCD, non-uniformity coefficient Cv and complete regulation coefficient Cr representing the time-history distribution characteristics of runoff within a year. See the literature Wang (2019) for the specific calculation formulae of indicators. Among them, the concentration period RCP reflects the main concentration period of runoff in the year; while the concentration degree RCD and the non-uniformity coefficient Cv reflect the specific concentration degree or non-uniformity of runoff in the year; the full regulation coefficient Cr can reflect the regularity of runoff during the year.
Table 2 Diagnosis results of variability of natural runoff series (1957-2018) at HTCS
Diagnosis indicator Annual runoff RCD RCP Cv Cr
Variation point location 2007 1999 N/A N/A 2007
At the significance level α = 0.95, the variability test results of the natural runoff series in XTXR are shown in Table 2. It can be seen from Table 2 that the natural annual runoff series of HTCS varied significantly in 2007, the full regulation coefficient Cr also varied significantly in 2007, and the concentration degree RCD varied significantly in 1999. In addition, Mann-Whitney U test showed that the annual precipitation of the basin also varied significantly in 2007 (Figure 6a). In summary of the relevant situation, it is considered in this paper that 2007 was the time when significant variation occurred in the natural runoff series of XTXR. Before the variation, the natural runoff depth was between 546.2-1343.9 mm with the mean value as 928.0 mm. After the variation, the natural runoff depth was between 904.0-1682.0 mm with the mean value as 1221.4 mm. The annual mean natural runoff depth after variation increased by 293.4 mm as compared with that before the variation.
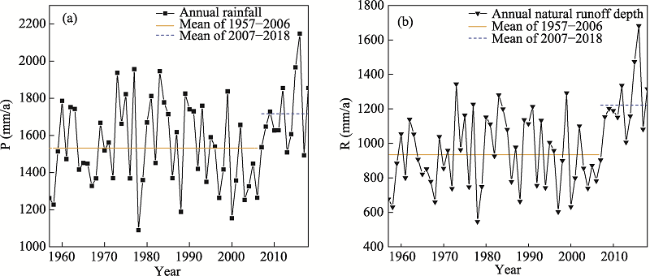
Figure 6 Comparison of annual rainfall (a) and annual natural runoff depth (b) during 1957-2006 and 2007- 2018 at HTCS

4.2.2 Observed runoff variation

Table 3 presents the diagnosis results using Mann-Whitney U test on the observed runoff series variability at HTCS at the significance level α=0.95. It can be seen from the Table 3 that there was no significant variation in the indicators reflecting the time history distribution of runoff in the year, but significant variation occurred in the observed annual runoff of 1999, which is consistent with the conclusion obtained in literatures of Dai et al. (2018) and Zhang et al. (2012). Seen from Figure 7b, before the variation, the observed runoff depth was between 328.2-1267.7 mm with the mean value as 819.7 mm. After the variation, the observed runoff depth was between 416.4-1345.1 mm with the mean value as 696.8 mm. The mean observed annual runoff depth after variation decreased by 122.9 mm as compared with that before the variation. As can be seen from Figure 7a, the annual mean rainfall before the variation of observed runoff was 1554.3 mm, and after the variation, it was 1595.0 mm, with an increase of 40.7 mm as compared with that before the variation. This shows that rainfall is not the main reason for the significant variation of observed runoff.
In fact, the variation of the observed runoff in XTXR is mainly due to the increase of the scale and intensity of artificial water extraction. Most of the living, industrial and irrigation water in XTXR area was taken from the river and reservoirs, which produced a significant impact on the runoff. The water supply for production and living purpose in the area increased from 445×104 m3 in 2001 to 5862.7×104 m3 in 2018 (Figure 8a). Also, due to the renovation of Niuwangba diversion project, after 2000, the agricultural water supply has been generally significantly higher than that in 1999 (Figure 8b). In addition, in 1997, a movable concrete gate was added at the top of the dam of Fushi Reservoir, so that the water level in front of the dam was raised by 0.3 m, and the annual inflow of the reservoir increased by 420×104 m3. These changes were all close to the time point of observed runoff variation.
Table 3 Diagnosis results of variability of observed runoff during 1957-2018 at HTCS
Diagnosis indicator Annual runoff RCD RCP Cv Cr
Variation point location 1999 N/A N/A N/A N/A
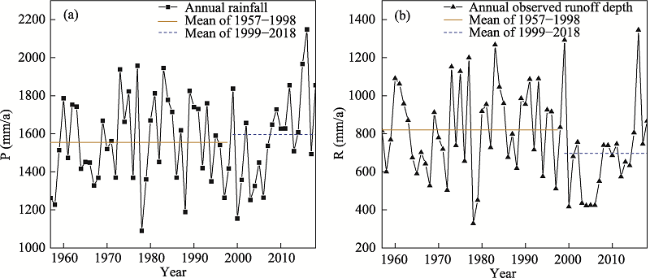
Figure 7 Comparison of annual rainfall (a) and annual observed runoff depth (b) during 1957-1998 and 1999-2018 at HTCS
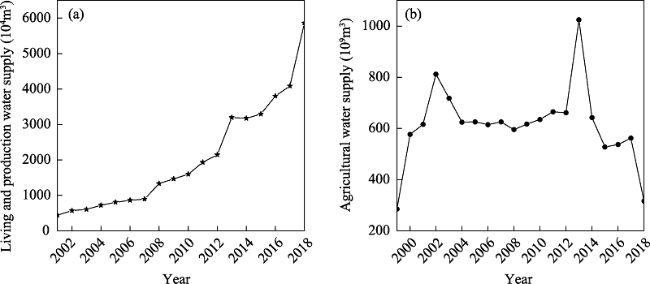
Figure 8 Living and production water supply (a) and agricultural water supply (b) change in the study area

4.3 Hydrological alternation indicators and EWRs process

4.3.1 Hydrological alternation indicators

The corresponding IHA indicators were obtained by using the observed and natural daily runoff data of HTCS of 1957-2018 respectively, as shown in Table 4. Figure 9 also shows the differences between the IHA indicators corresponding to natural runoff and the corresponding values of observed runoff. Among the 33 IHA indicators, 25 calculated from the observed runoff are smaller than calculated from natural runoff, and 8 calculated from the observed runoff are larger than calculated from natural runoff. The relative difference of the minimum 1-day flow indicator was the most significant, reaching -279.6% (the minimum 1-day flow mean value of observed runoff is 1.82 m3/s, and the corresponding value of natural runoff is 6.89 m3/s). The relative differences of the 5 indicators: minimum 3-day flow, minimum 7-day flow, number of days with zero runoff, base flow indicator, and minimum 30-day flow were also significant, with the absolute value of the relative differences between 96.5% and 200.9%. The 10 indicators including the minimum 90-day flow, mean flow in November, mean flow in December, low flow trough value and high flow peak value also showed moderate relative differences, with the absolute value ranging from 26.3% to 68.3%. There are low relative differences in 16 indicators, such as mean flow in June, mean flow in July, flood rising rate and mean duration of low flow, with the absolute value between 0.4% and 20.0%.
Table 4 IHA indicator calculation results at HTCS
IHA
indicator
Hydrological parameter Observed runoff Natural runoff
Mean Cv RVA threshold value Mean Cv RVA threshold value
Upper limit Lower limit Upper limit Lower limit
Monthly mean flow Mean flow in January 15.16 0.67 20.17 7.71 22.94 0.49 30.17 14.74
Mean flow in February 21.90 0.70 28.82 9.51 29.76 0.46 39.92 16.82
Mean flow in March 35.37 0.52 46.92 21.26 39.30 0.46 48.57 26.09
Mean flow in April 35.20 0.49 42.94 22.42 40.12 0.38 49.92 29.14
Mean flow in May 38.34 0.65 48.52 17.99 42.98 0.40 51.71 31.49
Mean flow in June 51.28 0.88 59.48 18.12 61.52 0.57 69.76 37.52
Mean flow in July 48.18 0.77 64.55 23.43 57.77 0.51 70.95 37.89
Mean flow in August 42.80 0.85 64.18 14.17 57.39 0.58 78.22 32.53
Mean flow in September 43.13 0.79 55.65 20.10 55.94 0.56 70.60 37.22
Mean flow in October 27.22 1.08 27.78 9.12 35.87 0.69 46.14 19.81
Mean flow in November 16.66 0.78 20.67 9.31 27.40 0.57 35.38 17.49
Mean flow in December 14.71 0.72 20.27 6.83 21.48 0.55 25.67 14.47
Annual mean
extreme
values
Min. 1-day flow 1.82 1.61 1.84 0.00 6.89 0.30 8.65 5.27
Min. 3-day flow 2.34 1.32 2.76 0.07 7.04 0.31 8.81 5.35
Min. 7-day flow 2.98 1.08 4.05 0.19 7.44 0.31 8.98 5.74
Min. 30-day flow 5.80 0.69 7.17 2.98 11.39 0.35 14.45 8.41
Min. 90-day flow 13.15 0.53 16.21 8.43 22.13 0.34 27.39 16.45
Max. 1-day flow 492.06 0.51 679.00 308.00 463.33 0.54 581.41 277.67
Max. 3-day flow 352.80 0.51 477.33 205.00 354.33 0.51 438.15 220.54
Max. 7-day flow 238.82 0.52 302.86 138.86 224.20 0.44 289.10 145.50
Max. 30-day flow 108.69 0.46 137.18 75.04 110.04 0.35 141.66 82.53
Max. 90-day flow 64.31 0.38 80.67 49.23 71.55 0.31 88.45 54.07
Number of days with zero runoff 7.60 2.44 3.00 0.00 0.00 0.00 0.00 0.00
Base flow indicator 0.09 0.97 0.14 0.01 0.18 0.24 0.22 0.16
Annual extreme value occurring time Max. flow occurring time 198.48 0.34 244.00 166.00 202.61 0.28 245.00 174.00
Min. flow occurring time 208.48 0.57 312.00 92.00 190.90 0.78 346.00 39.00
High and low flows and duration Low flow trough value 14.35 0.30 17.00 11.00 18.13 0.24 21.00 15.00
Low flow mean duration 13.32 0.83 18.00 5.00 9.23 0.40 11.00 6.00
High flow peak value 6.33 0.36 7.45 4.93 5.45 0.25 6.05 4.56
High flow mean duration 7.60 0.64 10.14 4.00 9.00 0.35 11.00 6.73
Flow changing rate and frequency Water rising rate 118.56 0.25 129.00 98.00 78.27 0.09 84.00 73.00
Water falling rate 14.93 0.41 19.27 11.03 17.87 0.29 21.30 14.27
Number of reverses 10.23 0.37 12.41 7.33 9.56 0.30 11.67 7.25

Note: flow is in m3/s; the occurring time is in calendar day; the duration is in d; and the water rising (falling) rate is in m3/(s*d).

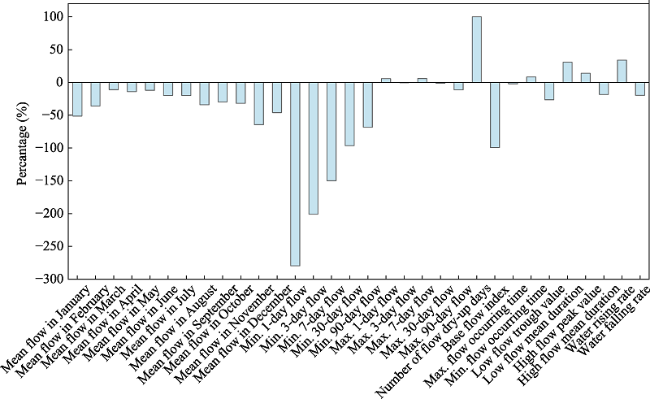
Figure 9 Relative differences of IHA indicators respectively calculated by observed and natural daily runoff at HTCS

4.3.2 EWRs process

According to the variability diagnosis results of natural and observed runoff series in XTXR, seven EWRs calculation scenarios were constructed (Table 5). For the observed runoff, the periods before and after variation are respectively 1957‒1998 and 1999‒2018, the period without taking runoff variation into account is 1957‒2018; for the natural runoff, the periods before and after variation are respectively 1957‒2006 and 2007‒2018, and the period without taking into account variation is 1957‒2018. As the data length of the time period after natural runoff variation is only 12 years, not meeting the requirement of RVA calculation of EWRs, the scenario of 1999‒2018 was added to the calculation of natural runoff. The RVA method was used to calculate the instream EWRs for the scenarios listed in Table 5, and the results are shown in Tables 6 and 7.
Table 5 Calculation of EWRs in different scenarios
Division of time periods No. Observed runoff No. Natural runoff
Time period before variation O1 1957‒1998 N1 1957‒2006
Time period after variation O2 1999‒2018 N2a 2007‒2018
N2b 1999‒2018
Variation not taken into account O3 1957‒2018 N3 1957‒2018
(1) Comparison of EWRs calculated with observed and natural runoff data
Figure 10a shows the instream EWRs process in the scenario of N1. It can be seen that the ecological flow in each month is less than the lower limit of RVA threshold, and the range of change is less than the natural variation of river flow, indicating that the EWRs process calculated with RVA method can well reflect the dynamic changing characteristics of hydrological regime of natural rivers.
Figure 10b shows the instream EWRs processes in scenarios N1 and O1, representing the instream EWRs processes calculated from the observed and natural runoff series in the period before the variation. It is known from this that the mean value of EWRs in the year calculated from observed runoff is higher than that calculated from natural runoff. The former is 13.7 m3/s and the latter is 11.2 m3/s, and the difference in EWRs processes in the year is mainly reflected in May to August, with the largest difference being 8.9 m3/s.
Figure 10c shows the instream EWRs processes in scenarios N2a, N2b and O2, representing the EWRs processes calculated from the observed and natural runoff series in the period after the variation. It is known from this that the mean value of EWRs calculated from observed runoff is lower than that calculated from natural runoff, the former is 12.2 m3/s (scenario O2), while the latter is 15.7 m3/s (scenario N2b) and 17.9 m3/s (scenario N2a). The difference of processes in the year is mainly reflected in June-July and October-November, with the largest difference being 21.8 m3/s. This shows that the natural runoff after variation is more concentrated than the observed runoff, with smaller threshold value interval.
Table 6 The EWRs at HTCS calculated by natural runoff (m3/s)
Time
period
1957-2006 (N1) 2007-2018 (N2a) 1999-2018 (N2b) 1957-2018 (N3)
Monthly mean flow Ecological flow Monthly mean flow Ecological flow Monthly mean flow Ecological flow Monthly mean flow Ecological flow
January 21.3 6.0 29.5 8.4 28.3 8.3 22.9 7.7
February 28.0 10.6 37.0 8.5 34.4 11.0 29.8 11.5
March 36.7 10.9 50.1 14.9 44.0 15.1 39.3 11.2
April 38.7 10.5 46.1 13.1 40.9 16.2 40.1 10.4
May 43.9 10.2 39.3 9.0 40.6 10.0 43.0 10.1
June 57.5 14.2 78.5 42.2 70.3 20.0 61.5 16.1
July 54.6 16.3 71.0 11.8 63.8 20.5 57.8 16.5
August 52.4 17.3 78.3 38.8 69.3 35.0 57.4 22.8
September 56.0 18.1 55.9 10.0 48.5 11.0 55.9 16.7
October 31.8 10.0 53.0 31.3 40.3 18.8 35.9 13.2
November 24.4 7.1 39.7 16.7 34.1 13.3 27.4 8.9
December 18.9 3.7 32.1 9.6 28.7 8.8 21.5 5.6
Mean 38.7 11.2 50.9 17.9 45.3 15.7 41.0 12.6
Table 7 The EWRs at HTCS calculated by observed runoff (m3/s)
Time
period
1957-1998 (O1) 1999-2018 (O2) 1957-2018 (O3)
Monthly
mean flow
Ecological flow Monthly mean flow Ecological flow Monthly
mean flow
Ecological flow
January 14.9 5.3 15.7 6.9 15.2 6.2
February 23.1 10.6 19.3 5.5 21.9 9.7
March 36.4 13.3 33.2 9.5 35.4 12.8
April 38.8 8.6 27.7 9.2 35.2 10.3
May 44.8 18.0 24.8 11.6 38.3 15.3
June 50.6 21.3 52.7 20.4 51.3 20.7
July 50.7 25.3 42.9 12.1 48.2 20.6
August 40.1 23.5 48.6 35.5 42.8 25.0
September 51.7 19.2 25.2 9.3 43.1 17.8
October 27.8 7.7 26.0 11.3 27.2 9.3
November 17.0 4.8 16.0 8.4 16.7 5.7
December 14.1 6.7 15.9 6.3 14.7 6.7
Mean 34.2 13.7 29.0 12.2 32.5 13.3
Figure 10d shows the instream EWRs processes in scenarios N3 and O3, representing the instream EWRs processes calculated from the observed and natural runoff data in all periods.
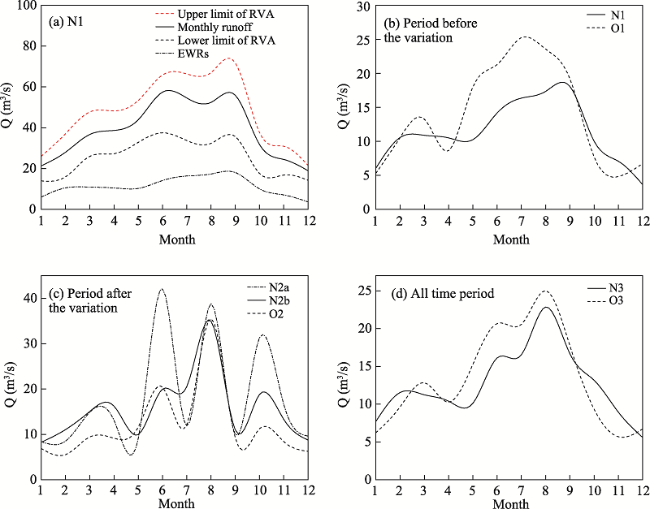
Figure 10 Comparison of the EWRs calculated by natural and observed runoff at HTCS in different time periods
It is known from this that the mean value of EWRs calculated from observed runoff is higher than that calculated from natural runoff. The mean value of EWRs calculated from observed runoff is 13.3 m3/s, while that calculated from natural runoff is 12.6 m3/s. The difference of instream EWRs processes calculated from the two types of runoff data is mainly reflected in May-July, with the largest difference being 5.2 m3/s.
Table 8 Eigenvalue of EWRs at HTCS calculated by natural runoff in different periods
Calculation time period 1957-2006 (N1) 2007-2018 (N2a) 1999-2018 (N2b) 1957-2018 (N3)
Mean value of EWRs 11.2 17.9 15.7 12.6
EWRs Cv 0.40 0.69 0.47 0.38
Max. value of EWRs 18.1 42.2 35.0 22.8
Occurring month September June August August
Min. value of EWRs 3.7 8.4 8.3 5.6
Occurring month December January January December
(2) Comparison of EWRs calculated for runoff series of different time periods
Figure 11a shows a comparison of EWRs calculated for natural runoff at different periods. It can be seen from Table 8 that for natural runoff, the mean value of EWRs calculated for the periods after variation (2007-2018 and 1999-2018) is the largest, followed by that for the period without taking the variation into account (1957-2018), and that for the period before the variation (1957-2006) being the smallest. The EWRs process calculated for the period after the variation changes acutely in the year, followed by that for the period before the variation (1957-2006), and that without taking the variation into account (1957-2018) being the smallest. The maximum and minimum values of EWRs calculated with natural runoff before and after variation differed significantly.
Table 9 Eigenvalue of EWRs at HTCS calculated by observed runoff in different periods
Calculation time period 1957-1998 (O1) 1999-2018 (O2) 1957-2018 (O3)
Mean value of EWRs 13.7 12.2 13.3
EWRs Cv 0.54 0.68 0.48
Max. value of EWRs 25.3 35.5 25.0
Occurring month July August August
Min. value of EWRs 4.8 5.5 5.7
Occurring month November February November
Figure 11b shows the instream EWRs calculated with the observed runoff data of different periods. In summary it can be seen from Table 9 that the mean value of EWRs calculated with observed runoff data of 1957-1998 is the largest, followed by that of 1957-2018, and that of 1999-2018 is the smallest. The EWRs process calculated with the observed runoff of 1999-2018 varies most severely in the year, followed by that of 1957-1998, and that of 1957-2018 being the least severe. The minimum values of EWRs of months in a year calculated with observed runoff data of different periods do not differ significantly, but the maximum values differ significantly.
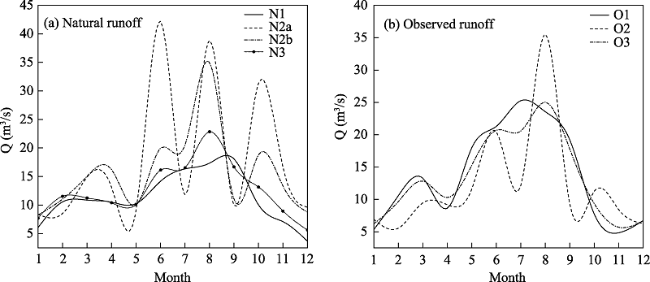
Figure 11 Comparison of the EWRs at HTCS calculated by different time periods of natural runoff (a) and observed runoff (b)

5 Conclusions

Taking XTXR as an example, the calculation of instream EWRs under hydrological variation conditions was investigated. Using the RVA method, on the basis of the variability diagnosis of both natural and observed runoff as well as natural and observed runoff series of different time periods, XTXR EWRs processes have been calculated and the differences of hydrological alternation indicators and EWRs processes obtained from different runoff data have been compared. The following are main conclusions:
(1) At the HTCS of XTXR, the significant variation point of natural runoff is 2007, and the variation point of observed runoff is 1999. The annual precipitation of XTXR also changed significantly in 2007, which may be the main cause for the variation of natural runoff; however, the variation of observed runoff is mainly due to human activities such as increase of water extraction and regulation by hydraulic projects.
(2) Based on the diagnosis results of natural and observed runoff variation, the IHA indicators in different states of XTXR were calculated. The IHA indicators corresponding to observed and natural runoff were significantly different. Among the 33 IHA indicators, 25 of them calculated from the observed runoff are smaller than the corresponding values calculated from natural runoff, and the other 8 calculated from observed runoff are larger than those calculated from natural runoff.
(3) For the RVA method, the mean values of EWRs of XTXR calculated with the observed runoff data before the variation point and all runoff data are higher than those calculated with natural runoff, and the difference between the two is mainly reflected in the period from May to August.
(4) Regardless of natural runoff or observed runoff used, since the series length of runoff data after variation is relatively short, the EWRs obtained using them varies acutely in a year, not agreeing with the seasonal characteristics of runoff.
According to the conclusions of this paper, under the coupled influences of climate change and human activities, when the RVA method is used to calculate the river EWRs, if the runoff series is subject to fairly strong disturbance or even the variation has occurred, the restoration of runoff must be considered. At the same time, the time period of the series must be selected properly. Unreasonable calculation result of EWRs will lead to excessively high or low ecological conservation targets, resulting in adverse effects on the coordination of river utilization and protection. Additionally, as the next stage of work, we will consider model correction and investigate how the uncertainties of the hydrologic simulation propagate to the EWRs quantitatively.
[1]
Bovee K D, Lamb B L, Bartholow J M et al., 1998. Stream habitat analysis using the instream flow incremental methodology. U.S. Geological Survey, Biological Resources Division Information and Technology Report USGS/BRD.

[2]
Chen J L, Zhong P A, Liu C et al., 2016. Research on runoff restoration method based on SWAT model: A case study in Dawenhe River Basin. Journal of China Hydrology, 36(6):28-34. (in Chinese)

[3]
Cui B S, Zhao X, Yang Z F, 2005. Eco-hydrology-based calculation of the minimum ecological water requirement for lakes. Acta Ecologica Sinica, 25(7):1788-1795. (in Chinese)

[4]
Cui Y, Zhang Q, Chen X H et al., 2010. Advance in the theories and calculation methods of ecological water requirement. Journal of Lake Sciences, 22(4):465-480. (in Chinese)

[5]
Dai X Y, Xu Y P, Lin Z X et al., 2018. Resources and Environment in the Yangtze Basin, 27(6):1279-1286. (in Chinese)

[6]
Deng P X, Hu Q F, Wang Y T et al., 2014. Comparison of GR model, Xin'anjiang model, and WBM-DP model in rainfall-runoff simulation in Ganjiang River Basin. Journal of Hohai University (Natural Sciences), 42(5):382-387. (in Chinese)

[7]
Deng P X, Wang Y T, Hu Q F et al., 2014. Application of GR4J in daily runoff simulation for Ganjiang River Basin. Journal of China Hydrology, 34(2):60-65. (in Chinese)

[8]
Ding J, 1986. Statistical detection for transition point in flood time sequences. Engineering Journal of Wuhan University, (5):36-41. (in Chinese)

[9]
Gippel C J, Stewardson M J, 1998. Use of wetted perimeter in defining minimum environmental flows. Regulated Rivers:Research & Management, 14(1):53-67.

DOI

[10]
Gleick P H, 1998. Water in crisis: Paths to sustainable water use. Ecological Applications, 8(3):571-579

DOI

[11]
Huang Y Y, Yu M H, Lu J et al., 2020. Suitable ecological water level of the East Lake Dongting after the Three Gorges Project operation. Journal of Lake Sciences, 32(2):417-427. (in Chinese)

DOI

[12]
Karim K, Gubbels M E, Goulter I C, 1995. Review of determination of instream flow requirements with special application to Australia. Water Resources Bulletin, 31(6):1063-1077.

DOI

[13]
Kendall M G, 1975. Rank Correlation Methods. London: Charles Griffin.

[14]
King J, Louw D, 1998. Instream flow assessments for regulated rivers in South Africa using the building block methodology. Aquatic Ecosystem Health & Management, 1(2):109-124.

[15]
Lei H F, Xie P, Chen G C et al., 2007. Comparison and analysis on the performance of hydrological time series change-point testing methods. Water Resources and Power, 25(4):36-40. (in Chinese)

[16]
Li C W, Kang L, 2014. A new modified Tennant method with spatial-temporal variability. Water Resources Management, 28(14):4911-4926.

DOI

[17]
Li J F, Zhang Q, Chen N X H et al., 2011. Study of ecological instream flow in Yellow River, considering the hydrological change. Acta Geographica Sinica, 66(1):99-110. (in Chinese)

[18]
Long F, Mei Y D, 2017. Using probability-weighted FDC method to calculate basic river ecological flow. Journal of China Hydrology, 37(4):1-5. (in Chinese)

[19]
Ma X C, 2013. Research of eco-environmental water requirement in the middle and lower reaches of Wei River based on eco-hydrological characteristics[D]. Xi'an. Northwest Agriculture & Forestry University. (in Chinese)

[20]
Mann H B, 1945. Non-parametric test against trend. Econometic, (13):245-259.

[21]
Matthews R C, Bao Y, 1991. The Texas method of preliminary instream flow assessment. Rivers, 2(4):295-310.

[22]
Pan Z R, Ruan X H, Xu J, 2012. Annual distribution calculation method for basic ecological water requirement of river course. Journal of Hydraulic Engineering, (1):119-126. (in Chinese)

[23]
Perrinc M, Andrassian V, 2003. Improvement of a parsimonious model for streamflow simulation. Journal of Hydrology, 279(1):275-289.

DOI

[24]
Pettitt A N, 1979. A non-parametric approach to the change-point problem. Applied Statistics, 28(2):126-135.

DOI

[25]
Richter B D, Baumgartner J V, Braun D P, 1996. A method for assessing hydrological alteration within ecosystems. Conservation Biology, 10(4):1163-1174.

DOI

[26]
Richter B D, Baumgartner J V, Braun D P et al., 1998. A spatial assessment of hydrologic alteration within a river network. Regulated Rivers Research and Management, 14(4):329-340.

[27]
Richter B D, Baumgartner J V, Wigington R et al., 1997. How much water does a river need. Freshwater Biology, 37(1):231-249.

DOI

[28]
Shen C, 2015. Study on ecological and environmental flow for the fish reserve in the upper reaches of the Yangtze River[D]. Beijing: Tsinghua University. (in Chinese)

[29]
Shi J J, Feng M Q, Huang Q et al., 2014. An approach to estimation of environmental flow process in Wenyu river under hydrological variation conditions. Journal of Hydroelectric Engineering, 33(4):28-34. (in Chinese)

[30]
Song J X, Xu Z X, Liu C M et al., 2007. Ecological and environmental instream flow requirements for the Wei River: The largest tributary of the Yellow River. Hydrological Processes, 21:1066-1073.

DOI

[31]
Tennant D L, 1976. Instream flow regimens for fish, wildlife, recreation and related environmental resources. Fisheries, 1(4):6-10.

DOI

[32]
Tharme R E, 2003. A global perspective on environmental flow assessment: Emerging trends in the development and application of environmental flow methodologies for rivers. River Research and Applications, 19:397-441.

DOI

[33]
Ubertini L, Manciola P, Casadei S, 1996. Evaluation of the minimum instream flow of the Tiber River Basin. Environmental Monitoring and Assessment, 41(2):125-136.

DOI PMID

[34]
Wang D C, 2019. Runoff variation characteristics for Datong River and its influencing factors[D]. Lanzhou: Lanzhou University. (in Chinese)

[35]
Wang Q, Xia R, Zou L et al., 2020. Calculation of ecological flow in Liaohe River under the hydrological alteration conditions. Research of Environmental Sciences, 19:397-441. (in Chinese)

[36]
Wang X L, Hu B Q, Xia J, 2002. R/S analysis method of trend and aberrance point on hydrological time series. Engineering Journal of Wuhan University, 35(2):10-12. (in Chinese)

[37]
Xiao C R, Hu Z Y, Chen C et al., 2016. Study on eco-flow in river channel of Dongjiang River Basin under consideration of hydrological variation. Resources and Hydropower Engineering, 47(10):62-66. (in Chinese)

[38]
Xie P, Chen G C, Xia J, 2005. Hydrological frequency calculation principle of inconsistent annual runoff series under changing environments. Engineering Journal of Wuhan University, 38(6):6-9. (in Chinese)

[39]
Xu B, 2013. Alteration and assessment with uncertainty study of regional surface water resources in the changing environment[D]. Wuhan: Wuhan University. (in Chinese)

[40]
Zhang C, Zhang B, Li W et al., 2012. Response of streamflow to climate change and human activity in Xitiaoxi river basin in China. Hydrological Processes, 28:43-50.

DOI

[41]
Zhang Z G, Jin Y, Li K F et al., 2017. RVA method-based study on river ecological baseflow hydrograph. Water Resources and Hydropower Engineering, 48(9):155-160. (in Chinese)

[42]
Zhao R H, Peng T, Wang H F et al., 2018. Study on instream basic ecological water demand based on the improved dynamic calculation method. South-to-North Water Transfers and Water Science &Technology, 16(4):114-119. (in Chinese)

Outlines

/