Research Articles

Predicting and assessing changes in NPP based on multi-scenario land use and cover simulations on the Loess Plateau

  • JIANG Xiaowei ,
  • BAI Jianjun , *
Expand
  • School of Geography and Tourism, Shaanxi Normal University, Xi’an 710119, China
* Bai Jianjun (1969-), PhD and Professor, specialized in environment RS and GIS application. E-mail:

Jiang Xiaowei (1992-), PhD Candidate, specialized in environment RS and GIS application. E-mail:

Received date: 2021-02-18

  Accepted date: 2021-04-19

  Online published: 2021-09-25

Supported by

The Key Research and Development Program of Shaanxi Province(2020NY-166)

Project of Special Investigation on Basic Resources of Science and Technology(2019FY202501)

Copyright

Copyright reserved © 2021.

Abstract

Land use/cover change (LUCC) is a major factor affecting net primary production (NPP). According to the LUCC of the Loess Plateau from 2005 to 2015, the LUCC patterns in 2025 in three scenarios were predicted by using the Future Land Use Simulation (FLUS) model. Furthermore, taking the average NPP of various land use/cover types in 16 years as the reference scale, the changes in NPP in multi-scenario simulations are predicted and analyzed, and the impact of different land use/cover transfers on NPP is quantified. The results are as follows: (1) The land use/cover changes greatly in the baseline and fast development scenarios, and changes relatively little in the ecological protection scenarios. (2) The changes in NPP in different scenarios reflected the significant difference in the ecological protection effect. All the three scenarios promote an NPP increase, but the ecological protection scenario can promote NPP increases the most. (3) The changes in NPP caused by LUCC in the three scenarios reflected the significant difference in the various land use/cover types protection effect. Analyzing and predicting NPP changes in multi-scenario LUCC simulations in the future can provide a theoretical basis for decision makers to judge the future changes in ecological environments and ecological protection effects against different policy backgrounds.

Cite this article

JIANG Xiaowei , BAI Jianjun . Predicting and assessing changes in NPP based on multi-scenario land use and cover simulations on the Loess Plateau[J]. Journal of Geographical Sciences, 2021 , 31(7) : 977 -996 . DOI: 10.1007/s11442-021-1881-5

1 Introduction

Land use/cover change (LUCC) is the main way that human activities affect natural ecological environments and is an important driving force affecting NPP. Analyzing the impact of land use and cover change on NPP can show the response ability of an ecosystem to human activities and socio-economic environments (Li and Ren, 2005; Findell et al., 2007; Fu et al., 2013; Ran et al., 2015). The degree and transformation direction of LUCC varies at different historical periods and socio-economic policies. Studies showed that LUCC will make vegetation change in the future and then affect NPP, leading to ecosystem damage (Gao et al., 2003; Liao et al., 2020). At present, most research analyzes the impact of current or past LUCC on NPP, and there are few studies on how future LUCC will affect NPP (Gimeno et al., 2012; Zhang et al., 2014; Peng et al., 2016). The ecology of the Loess Plateau is fragile. Vegetation degradation, soil erosion, and desertification are severe in the region, and the response of the ecological environment to human activities is sensitive (Guo et al., 2018). In order to protect the ecological environment, many regional ecological restoration policies have been adopted since 2000. Such initiatives as returning farmland to forestland or grassland and controlling sand have made the NPP of this region continue to increase in the past 20 years, and the ecological environment has been gradually improved (Jiang and Bai, 2020). Analyzing the change in NPP in multi-scenario LUCC simulations in the future is conducive to formulating effective ecological restoration policies in the region and provides theoretical support, specific methods, and effective measures for the realization of economic development and ecological environment restoration.
How to accurately simulate future LUCC using different policy development pathways has become the focus of analyzing future NPP changes in multi-scenario simulations. The existing hybrid model is a common method for predicting the quantity of and spatial change in land use/cover (Verburg et al., 2002; Dietzel and Clarke, 2007; Sohl et al., 2007). However, these models generally simply integrate multiple models together, and there is no feedback mechanism in the process of simulation prediction. Moreover, most models can only simulate one LUCC state, and the grid cell only reflects the maximum probability of land use/cover type, which is difficult to reflect the complex interactions in LUCC processes. The future land use simulation (FLUS) model proposed in 2017 (Liu et al., 2017) combines the top-down prediction concept with the bottom-up improved CA model to form a feedback mechanism. It can macroscopically predict the change in land use/cover using different development pathways and effectively explain the interaction between different land use/cover types. Liu simulated the land use/cover of China in 2010 by using the FLUS, CLUE-S, and CA models and compared it with the actual land use/cover. The results showed that the overall accuracy of the FLUS model (0.85) was significantly higher than that of the CLUE-S model (0.80) and the CA model (0.78) (Liu et al., 2017). Based on the LUCC of the Loess Plateau during 2005-2015, we used the FLUS model to simulate the spatial distribution of LUCC in 2025 using different policy development strategies by setting up multiple scenarios. Taking the average NPP of various land use/cover types in 16 years as the reference scale, the changes in NPP in multi-scenario simulations were analyzed and predicted, and the impact of different land use/cover type transfers on NPP was quantified. This can provide a theoretical basis for decision makers to judge the future changes in eco-environments against different policy backgrounds, and provide effective help for adjusting regional eco-environment balance, effectively protecting fragile eco-environments and promoting regional sustainable development.

2 Data and methodology

2.1 Study area

The Loess Plateau is located in the middle reaches of the Yellow River, including 341 counties (cities) in 7 provinces (autonomous regions) such as Shanxi, Inner Mongolia, Henan, Shaanxi, Gansu, Ningxia, and Qinghai, accounting for 6.76% of the total land area in China. Its landform types mainly include hills, highlands, terraces, plains, deserts, arid grasslands, upland grasslands, and earth-rocky mountains. Among them, the mountainous areas, hilly areas, and highlands account for more than two-thirds. The central part is mainly a loess hilly region, the southeastern part is mainly an earth-rocky mountainous region, the northern part is mainly a sandy land, arid grassland, and upland grassland region, and the western part is mainly a loess plateau and gully region. The western Yinchuan Plain, the northern Hetao Plain, and the southern Fenhe-Weihe Plain have relatively flat terrain and are major agricultural areas. MODIS data products (MCD12Q1) showed that grassland accounted for 62.52% of the total area, and farmland accounted for 22.73%. These were the main land use/cover types on the Loess Plateau in 2005 (Figure 1).
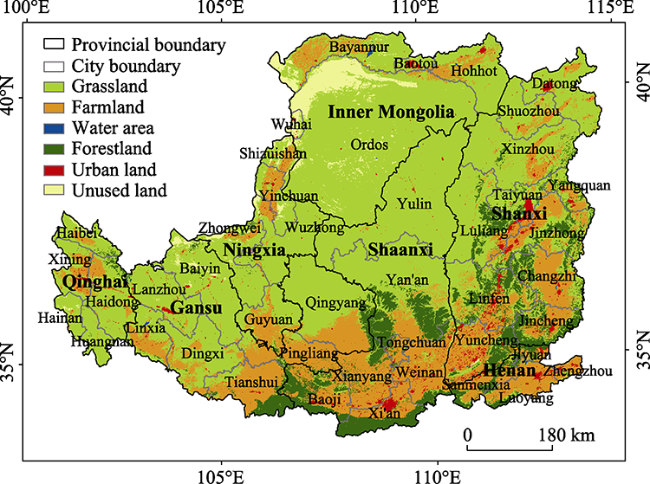
Figure 1 The land use and cover patterns of the Loess Plateau in 2005

2.2 Data collection and pre-processing

NPP data come from the Resource and Environmental Science and Data Center (RES) with a spatial resolution of 1 km. The LUCC data were derived from a MODIS product (MCD12Q1) that used an IGBP land cover classification scheme, with a spatial resolution of 500 m. According to the classification of LUCC in China, the LUCC was reclassified as farmland, forestland, grassland, water area, urban land, or unused land (mostly sandy land). MODIS products (MCD12Q1) have a high time resolution and have been successfully applied to regional LUCC monitoring. These are the basic data for determining global or regional net productivity, ecosystem metabolism, and carbon cycle model (Armel et al., 2011). Zhuang et al. (2019) studied the response of the Pearl River Delta to LUCCs based on MODIS data and the results showed that the LUCC established by MODIS is accurate. Xia et al. (2010) found that the accuracy of MODIS data in grassland was 80%-90%. MODIS data have a high accuracy in the land use/cover classification of large-scale areas. The Loess Plateau is just such a large-scale area. Furthermore, according to a random sampling of Google Earth, a confusion matrix showed that the overall classification accuracy in 2005 and 2015 was 87.64% and 89.92%, respectively, and the kappa coefficient was 0.8714 and 0.8936. Therefore, MODIS data have a high accuracy in the LUCC classification of the Loess Plateau. According to the actual situation of the Loess Plateau, 12 driving factors concerning the natural environment and the socio-economy were selected, including precipitation, temperature, DEM, slope, aspect, soil properties, the spatial distribution of population and GDP, and traffic location. Slope and aspect were calculated from a DEM. Traffic location factors, including the distance to main roads, railways, water systems, and urban points (county level and above), were obtained by Euclidean Distance Analysis. The precipitation, temperature, and DEM data come from the RES, the soil properties come from Harmonized World Soil Database v1.2, and traffic location comes from a 1:100 China basic geographic database. The data resolution was unified to 1 km (Table 1).
Table 1 Data description of the Loess Plateau
Category Data Year Resolution
Natural environmental factors NPP 2000-2015 1 km
LUCC data 2005-2015 500 m
Annual precipitation 2000-2005 1 km
Annual mean temperature 2000-2005 1 km
DEM 2008 1 km
Slop 2008 1 km
Aspect 2008 1 km
Soil properties 2008 1 km
Socio-economic factors Population 2005, 2010 1KM
GDP 2005, 2010 1KM
Main road network 2005 1KM
Railway network 2005 1KM
City site 2010 1KM
Main river system 2005 1KM

2.3 Markov model

The Markov model is a common method for predicting the probability of events based on a Markov chain. The Markov premise is that the event process has a non-aftereffect property; that is, if the state at time t is known, then the state at time t+1 is only related to the previous time t. In the dynamic simulation and prediction of land use/cover, the process of LUCC can be regarded as the state of the Markov chain, which focuses on predicting the quantitative change in land use/cover. The area quantity or proportion of land use/cover types transformed into each other is the state transition probability P(i, j) The Markov chain is used to predict the area of each land use/cover type in the future, which is the termination condition of the simulation iteration of FLUS. The state of time Nt determines the state of Nt+1 at time t+1, which are expressed as follows (Guan et al., 2008):
${{N}_{t+1}}={{N}_{t}}\times {{P}_{(i\text{,}j)}}$
${{P}_{ij}}=\left| \begin{matrix} {{p}_{11}} & {{p}_{12}} & {{p}_{1n}} \\ \vdots & \vdots & \vdots \\ {{p}_{n1}} & {{p}_{n2}} & {{p}_{nn}} \\\end{matrix} \right|$
where Nt and Nt+1 denote the LUCC statuses at time t and t+1, respectively; P(i, j) reflects the probability of land use/cover type P changing at time t; $0\le {{P}_{ij}}\le 1$.

2.4 The FLUS model

The FLUS model combines artificial neural networks (ANNs) and cellular automata (CAs), which is an improvement on the traditional CA model (Wu et al., 2018; Zhang et al., 2020). FLUS can set a target number of various LUCCs macroscopically, which was the termination condition of model simulation iteration and reflects the policy background; moreover, an inertia competition mechanism, i.e., a roulette selection mechanism, is introduced to reflect the interaction of various land types in LUCC simulation, and this formed the feedback mechanism.
Firstly, we used the land use data from 2000 to 2015 and combined those with the 12 selected driving factors in the Loess Plateau to train the ANN, and the future probability of various land use/cover types on each grid cell was generated. The number of input and output layers of the ANN was set to 12 and 6, respectively, corresponding to the number of driving forces and land use types. The number of hidden layers was set to 12, while all selected sampling points of land use/cover were random. Seventy percent of the selected sample points were used for simulation training, and 30% were used to verify the accuracy of the model. The inertia competition mechanism was then introduced to set the neighborhood effects, conversion cost, and inertia coefficient. The neighborhood effects and conversion cost are two important parameters that affect the simulation results. The neighborhood effects represent the interactions between grid cells and reflect the expansion ability of various land use/cover types (Eq. 3). In this study, we used expert experience to set neighborhood effects (Table 2). The inertia coefficient reflects the inventory of previous land use/cover types in the iterative process of model simulation by dynamically adjusting parameters (Eq 4). The conversion cost indicates the difficulty of conversion between land use/cover types. The value of conversion cost is within [0, 1]. Larger values indicate a lower difficulty in conversion. In this study, the conversion cost of each kind of land use/cover was determined based on local expert experience (Table 3). Finally, the comprehensive probability was generated, and the roulette mechanism was added to reasonably assign the land use/cover type to the cell (Eq. 5). This makes up for the defect that the traditional model is unable to assign a low probability land use/cover type to the grid cell. Thus, FLUS can reflect the uncertainty and randomness in the land use/cover transformation process.
$\text{ }\!\!\Omega\!\!\text{ }_{p,k}^{t}=\frac{{{\Sigma }_{N\times N}}con(c_{p}^{t-1}=k)}{N\times N-1}\times {{w}_{k}}$
Table 2 The neighborhood effects of each kind of land use/cover on the Loess Plateau
Farmland Forestland Grassland Water area Urban land Unused land
0.5 0.1 0.2 0.1 1 0.3
Table 3 The conversion cost of each kind of land use/cover on the Loess Plateau
Land use types Farmland Forestland Grassland Water area Urban land Unused land
Farmland 1 0.1 0.9 0.2 0.9 0.6
Forestland 0.3 1 0.7 0.01 0.01 0.2
Grassland 0.5 0.2 1 0.6 0.7 0.9
Water area 0.1 0.1 0.1 1 0.01 0.5
Urban land 0 0 0 0 1 0
Unused land 0.1 0.01 0.5 0.2 0.7 1
where $\text{ }\!\!\Omega\!\!\text{ }_{p,k}^{t}$ indicates the neighborhood function of land use/cover type k in the iteration of grid cell P at time t; ${{\Sigma }_{N\times N}}con(c_{p}^{t-1}=k)$ indicates the number of iterations of land use/cover type k at the time t-1 in the Moore window of N×N, and the N selected in this study is 3; wk indicates the variable weight of various LUCC.
$Inertia_{k}^{t}=\left\{ \begin{array}{*{35}{l}} Inertia_{k}^{t-1}\ \ \ \ \ \ \ \ \ \ \ \ \ \ if\text{ }\left| D_{k}^{t-1} \right|<\left\lceil D_{k}^{t-2} \right\rceil \\ Inertia_{k}^{t-1}\times \frac{D_{k}^{t-2}}{D_{k}^{t-1}}\ \ \ \ if\text{ }D_{k}^{t-1}<D_{k}^{t-2}<0 \\ Inertia_{k}^{t-1}\times \frac{D_{k}^{t-2}}{D_{k}^{t-1}}\ \ \ \ if\text{ }0<D_{k}^{t-2}<D_{k}^{t-1} \\\end{array} \right.$
where $Inertia_{k}^{t}$ indicates the inertia coefficient for land use/cover type k at iteration time t; $Inertia_{k}^{t-1}$ and $Inertia_{k}^{t-2}$ indicate the distance between land use/cover type k and the set target at time t-1 and t-2, respectively.
$TP_{p,\ k}^{t}={{P}_{p,k}}\times \text{ }\!\!\Omega\!\!\text{ }_{p,k}^{t}\times Inertia_{k}^{t}\times co{{n}_{c\to k}}$
where Pp,k indicates the future probability on grid cell p of land type k; $TP_{p,k}^{t}$ indicates the comprehensive probability of the transformation of cell P into land use/cover type k at time t. $\text{ }\!\!\Omega\!\!\text{ }_{p,k}^{t}$ and $Inertia_{k}^{t}$ are the same as in Eqs. 2-3; $co{{n}_{c\to k}}$ indicates the conversion matrix of converting a land type from c to k.

2.5 The changes in NPP in multi-scenario LUCC simulations

Based on the LUCC on the Loess Plateau during 2005-2015, we used the FLUS model to simulate the spatial distribution of LUCC in different scenarios in 2025: the baseline scenario (BD Scenario), the fast development scenario (FD Scenario), and the ecological protection scenario (EP Scenario). Moreover, we analyzed the change in NPP in multi-scenario LUCC simulations on the Loess Plateau. The quantities of input, output, and hidden layers in the ANN in the three scenarios are the same.
The BD Scenario is a future state that inherits the current policies and socio-economic conditions without implementing any new environmental or economic policies. Its neighborhood effects and conversion cost were determined based on expert experience. The FD Scenario refers to the future state of priority economic development. As for the FD Scenario, we assumed that the GDP growth rate was twice that of the BD Scenario, which changes the driving force factors. Combining the sampling points, we can obtain the new future occurrence probability of various land use/cover types in each grid cell by training the ANN. Therefore, it affects the area demands and spatial distribution of various land use/cover types in the FD Scenario. The EP Scenario refers to the future state of priority ecological protection. Its main target is to protect forest, grass, and water areas, stabilize basic farmland, return slope farmland to forestland or grassland, and control sandy land. We adjusted the conversion cost by limiting the transfer of farmland, forestland, grassland, and water areas to urban and unused land as well as the transfer of forestland to other land, and by promoting the transfer of unused land, especially sandy land, to major ecological land types (farmland, forestland, grassland, and water areas) in the EP Scenario. If the conversion of a land type from c to k is restricted, the conversion cost is set to 0; if it is promoted, the conversion cost is reduced. The average NPP of main ecological land from 2000 to 2015 was calculated by regional analysis (Figure 2), and the NPP changes caused by the internal and mutual transformation of ecological and non-ecological land (urban and unused land) were then calculated (Table 4). Due to the resolution limitations of LUCC and NPP, the NPP value of urban and unused land is regarded as 0.
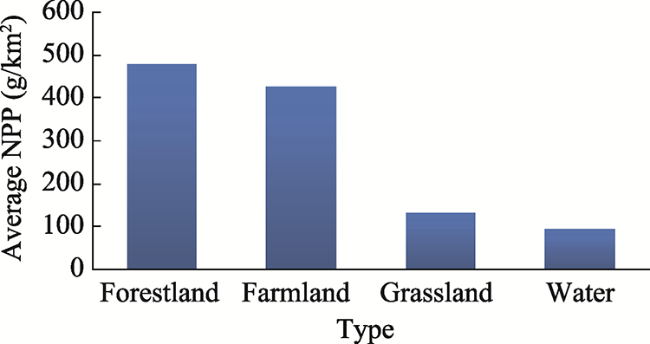
Figure 2 Average value of NPP produced by ecological land of the Loess Plateau
Table 4 NPP changes corresponding to LUCCs on the Loess Plateau from 2000 to 2015
NPP change (gC/km2) Farmland Forestland Grassland Water area Urban land Unused land
Farmland 0 26.07 -310.79 -355.17 -453.84 -453.84
Forestland -26.07 0 -336.86 -381.24 -479.90 -479.90
Grassland 310.79 336.86 0 -44.38 -143.04 -143.04
Water area 355.17 381.24 44.38 0 × -98.67
Urban land × × × × 0 ×
Unused land 453.84 479.90 143.04 98.67 0 0

“×” indicates an illogical result in terms of ground cover change or a scenario that will not happen in the short term.

Zhu et al. (2005) found that the vegetation coverage type is the main factor affecting NPP estimation. The NPP produced by different vegetation coverage types varies greatly, while production by the same vegetation coverage type in the same growth environment varies only slightly. Furthermore, the NPP data showed that there is little difference in the NPP of the same land use/cover type on the Loess Plateau during 2000-2015. Therefore, we took the average NPP of various land use/cover types over 16 years as the reference scale, analyzed and predicted the NPP change during 2015-2025 in multi-scenario simulations, and quantified the response of NPP to the LUCC in the future.

3 Results and analysis

3.1 Spatiotemporal change in land use/cover from 2005 to 2015

During 2005-2015, the land use/cover types mainly changed around the original land types, and the urban land continued to expand, but the expansion speed slowed down, the forestland increased, and the sandy land decreased significantly. These results suggest that, in the past 10 years, ecological protection measures on the Loess Plateau, such as closing hills for afforestation, returning farmland to forestland or grassland on sloping land, improving sandy land, and building water conservancy projects, have made some achievements, but grassland is still deteriorating. This shows the spatiotemporality of LUCC in the study area of the BD Scenario and provides basic parameters for the LUCC simulations by FLUS in the BD Scenario.
The area change in land use/cover is shown in Table 5. During 2005-2015, grassland and unused land continued to decline, with the largest declining area of grassland and the fastest declining rate of unused land. Farmland, forestland, and water area continued to increase, with the fastest growing rate of water area. The net area change in land use/cover types from high to low was grassland > farmland > forestland > unused land > urban land > water area. The area of ecological land is generally increasing. Farmland, forestland, and water area increased; farmland increased the most (10,756 km2), followed by forestland (6885 km2) and water area (310 km2). Water area showed the fastest growth rate (49.92%), followed by forestland (11.4%) and farmland (7.58%). However, the area of grassland decreased (14,620 km2) at a rate of 3.75%. In addition, among the non-ecological land, the urban land increased slightly (530 km2), at a rate of 4.56%. The unused land decreased at a relatively high rate (19.89%), with the largest decline area (3861 km2).
Table 5 The area change of land use/cover on the Loess Plateau
LUCC Area (km2) Proportion (%) Area change (km2) Dynamic rate of change (%)
2005 2015 2005 2015 2005-2015 2005-2015 2005-2015
Farmland 141838 152594 22.73 24.45 1.72 10756 7.58
Forestland 60418 67303 9.68 10.79 1.10 6885 11.40
Grassland 390115 375495 62.52 60.17 -2.34 -14620 -3.75
Water area 621 931 0.10 0.15 0.05 310 49.92
Urban land 11626 12156 1.86 1.95 0.08 530 4.56
Unused land 19414 15553 3.11 2.49 -0.62 -3861 -19.89
The spatial distribution of LUCC during 2005-2015 on the Loess Plateau is shown in Figure 3. Grassland was distributed the most widely, followed by farmland and forestland. Grassland mainly showed a banding distribution from southwest to northeast in the western highland gully region, the central hilly gully region, the northern sandy land, the arid grassland, and the highland grassland. Moreover, farmland was mainly distributed in the southern Weihe-Fenhe Plain, the western Yinchuan Plain, and the northern Hetao Plain. The southern earth-rocky mountainous area and the eastern Taihang Mountains were the main distribution areas of forestland. We selected the Weihe Plain and the Huanglong and Ziwuling mountains in the south as well as the sandy land in the north for partial enlargements to display more LUCC details. These four regions are mainly farmland, forestland, grassland, and sandy area crisscross zones, areas representative of drastic LUCC.
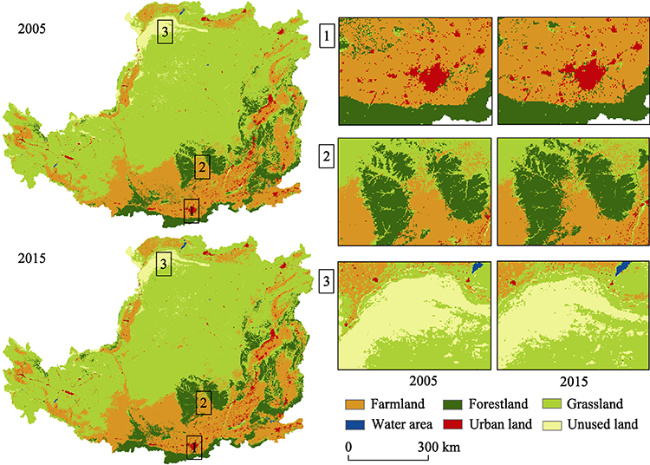
Figure 3 Spatial distribution of LUCC on the Loess Plateau during 2005-2015

3.2 Verifying the accuracy of the FLUS model

Based on the LUCC on the Loess Plateau during 2005-2015, the FLUS model was used to simulate the spatial distribution of LUCC in 2025 and to further analyze the long-term effects of ecological management measures. The simulated and actual LUCC in 2015 were compared to verify the accuracy of the model. Similarly, we also selected the Weihe Plain and the Huanglong and Ziwuling mountains in the south as well as the sandy land in the north for partial enlargements to display more LUCC details; its spatial pattern is shown in Figure 4. The simulations show a high similarity with the actual LUCC, and the spatial distribution trend of different LUCCs is basically the same. A confusion matrix of simulated and actual LUCC in 2015 was calculated. The kappa coefficient was 0.84, and the overall accuracy was 0.91, indicating a high accuracy (Table 6). Furthermore, we introduced a more accurate figure of merit (FOM) to verify the model’s imitative effect. Theoretically, a larger FOM value indicates a higher accuracy. Research practice shows that the FOM range of LUCC simulations is mostly between 0.1 and 0.2 (Wang et al., 2019). Therefore, the FOM value of 0.14 in our study is within a reasonable range, which further confirms the accuracy of the model.
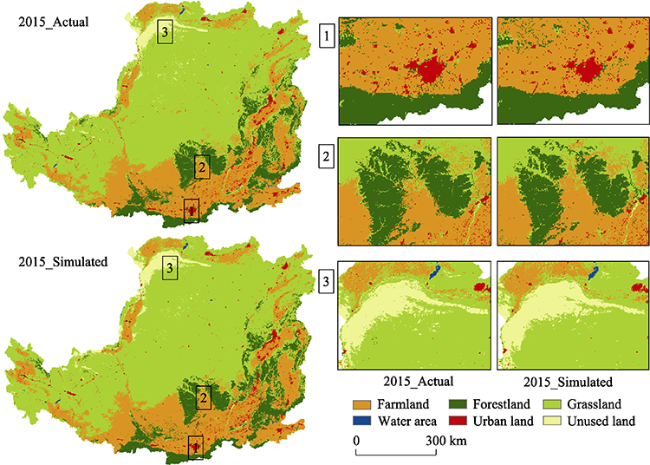
Figure 4 Simulated and actual LUCC on the Loess Plateau in 2015
Table 6 Confusion matrix of simulated and actual LUCC on the Loess Plateau in 2015
Farmland Forestland Grassland Water area Urban land Unused land Total
Farmland 13387 337 1419 4 34 14 15195
Forestland 395 5686 504 17 8 1 6611
Grassland 1449 758 35134 15 4 188 37548
Water area 0 1 7 61 0 4 73
Urban land 17 0 23 0 1188 0 1228
Unused land 1 19 394 1 0 1333 1748
kappa: 0.84
Ova: 0.91

3.3 Spatiotemporal change in land use/cover in future multi-scenario simulations

The future spatial distribution and transfer of land use/cover on the Loess Plateau in different scenarios in 2025 are shown in Figure 5. The spatial pattern of LUCC in the BD and FD Scenarios on the Loess Plateau in 2025 is approximately the same, but there are some local differences. On the whole, in the BD and FD scenarios, the transformation of land use/cover types is mainly manifested as “grassland→farmland”, followed by “grassland/farmland→forestland”, “unused land (especially sandy land)→grassland”, and finally “grassland/farmland→urban land”. Farmland and urban expansion increased the most in the BD and FD scenarios, respectively. The transformation area is lower in the EP Scenario, and water area increased significantly. Its transformation is mainly “grassland→forestland” and “unused land→grassland”, followed by “farmland→grassland/forestland” and finally “grassland→water area”. We selected the staggered zone of the Luliang Mountain and Fenhe Valley in the east, the ecotone area of the Huanglong and Ziwuling mountains with farmland and grassland in the south, the sandy land in the north, and the Fenhe-Weihe Plain in the southeast to show the detailed changes in various land use/cover types. The land use/cover of the Loess Plateau is mainly grassland, farmland, and forestland, and the total area of these three land types exceeds 90% of the total study area. The above four local regions are mainly an interlaced zone of farmland, forestland, and grassland and typical sandy area, which are the regions with drastic LUCC. This can better represent the typical impact of LUCC on NPP. Local Regions 1 and 2 reflect the impact of urban expansion and main LUCC on NPP, respectively. Local Regions 3 and 4 reflect the impact of sandy land and water area conversion on NPP, respectively.
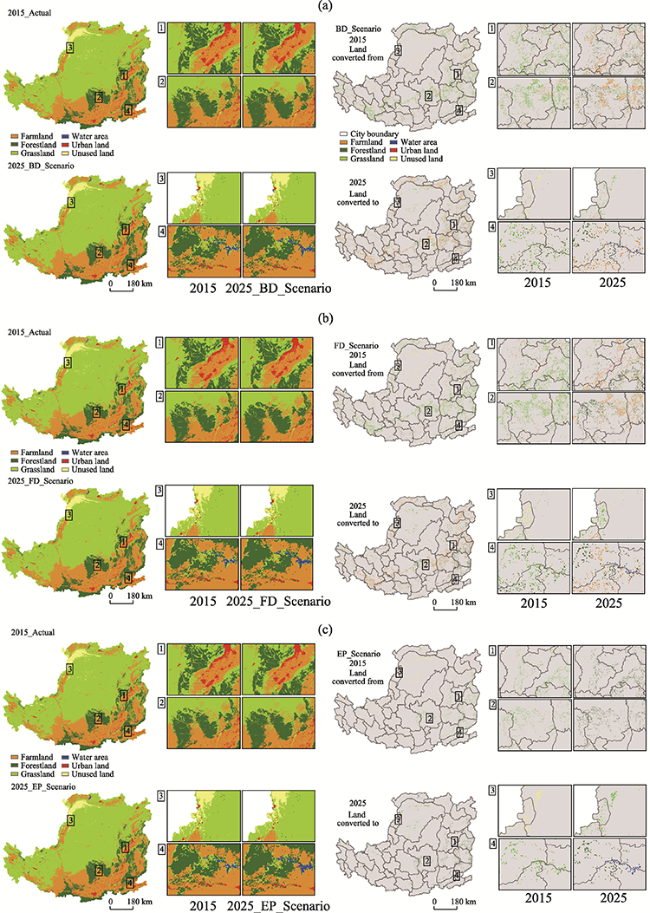
Figure 5 Spatial distribution and transfer of land use/cover on the Loess Plateau in multi-scenario simulations from 2015 to 2025 (a. Spatial distribution and transfer of land use/cover in the BD Scenario; b. Spatial distribution and transfer of land use/cover in the FD Scenario; c. Spatial distribution and transfer of land use/cover in the EP Scenario)
Local Region 1 shows that, in the BD and FD scenarios, urban area mainly expands on the basis of the original distribution, and the expansion area is higher in the FD Scenario. Farmland increases similarly, but the spatial distribution is different. In the northern Luliang Mountain, grassland converts to farmland in the BD Scenario, while farmland converts to grassland in the FD Scenario. Furthermore, compared with the FD Scenario, forestland in the Luliang Mountain increases more in the BD Scenario, but less so in Jinzhong and Changzhi of the Taihang Mountain. However, the grassland around the original forestland converts to forestland in the EP Scenario, which shows the effect of closing hillsides for afforestation. Local Region 2 shows that the ecological protection effect in the western Huanglong and Ziwuling mountains is better, while the development and destruction in the east are serious. In the BD and FD scenarios, grassland in the western Huanglong and Ziwuling mountains converts to forestland and in the east converts to farmland. Forestland increases more in the FD Scenario. In the EP Scenario, grassland converts to forestland and farmland converts to grassland. Local Region 3 shows that, in the three scenarios, part of the sandy land in the north converts to grassland, but part of the grassland degrades to unused land in the FD scenarios. Local Region 4 shows that the increase in water area in the EP Scenario is better than the BD and FD scenarios.
The area changes in land use/cover on the Loess Plateau in multi-scenario simulations of 2015-2025 are shown in Table 7. In the BD and FD scenarios, the quantitative changes in farmland, grassland, and urban land are basically the same. Moreover, forestland increases and the unused land decreases in the FD Scenario, better than the BD Scenario, while water area increases less than the BD Scenario does. In the EP Scenario, forestland and water area increase the most, while the unused land (sandy land) decreases the most. Forestland and water area increase by 5911 km2 and 279 km2, respectively, at a growth rate of 8.8% and 30%, and unused land decreases by 2959 km2 at a rate of 19%. Furthermore, urban expansion and grassland reduction are the least significant, increasing by 61 km2 and decreasing by 2537 km2, respectively. The change rates are also lower than the other two scenarios. Although the farmland decreases slightly, the basic farmland shows no change, and the change is mainly manifested as “farmland→grassland/forestland”.
Table 7 The area change in land use/cover in different scenarios of the Loess Plateau during 2015-2025
2025Area (km2) 15-25A_change (km2) 15-25A_change_rate (%)
2015 BD FD EP BD FD EP BD FD EP
Farmland 152594 162528 162527 151832 9934 9933 -762 6.5 6.5 -0.5
Forestland 67303 71976 72735 73214 4673 5432 5911 6.9 8.1 8.8
Grassland 375495 361771 361771 372958 -13724 -13724 -2537 -3.7 -3.7 -0.7
Water area 931 1186 1163 1210 255 232 279 27.4 24.9 30.0
Urban land 12156 12710 12710 12217 554 554 61 4.6 4.6 0.5
Unused land 15553 13861 13126 12601 -1692 -2427 -2952 -10.9 -15.6 -19.0

BD, FD, and EP indicate the BD Scenario, FD Scenario, and EP Scenario, respectively. 15-25A_change indicates the land use/cover area change during 2005-2015, and 15-25A_change_rate indicates the land use/cover area change rate during 2005-2015.

3.4 Predicting and assessing changes in NPP in multi-scenario LUCC simulations

3.4.1 The changes in NPP in multi-scenario simulations
The changes in NPP in multi-scenario LUCC simulations on the Loess Plateau from 2015 to 2025 are shown in Figure 6. The local region we selected is consistent with those used for analyzing the LUCC simulations. The partial enlargements 1-4 mainly reflect the influences of land use/cover transformation on NPP, including urban expansion, the conversion of forestland, grassland, and farmland, the conversion of unused land (sandy land) and grassland, and the conversion of ecological land, respectively. In the BD, FD, and EP scenarios, NPP shows an increasing trend on the whole, with increases by 184.33 gC/km2, 166.48 gC/km2, and 212.45 gC/km2 on average, respectively. The transformation of ecological land causes a change in NPP that is mainly concentrated in 0-100 gC/km2 and 300-400 gC/km2; the transformation of non-ecological land to ecological land causes a change in NPP that is mainly concentrated in 100-200 gC/km2 and 300-400 gC/km2. The spatial distribution of NPP change is similar, mainly distributed in the interleaved zone of farmland, forestland, and grassland, as well as in the northern and southwestern boundary sandy land, but there are local differences.
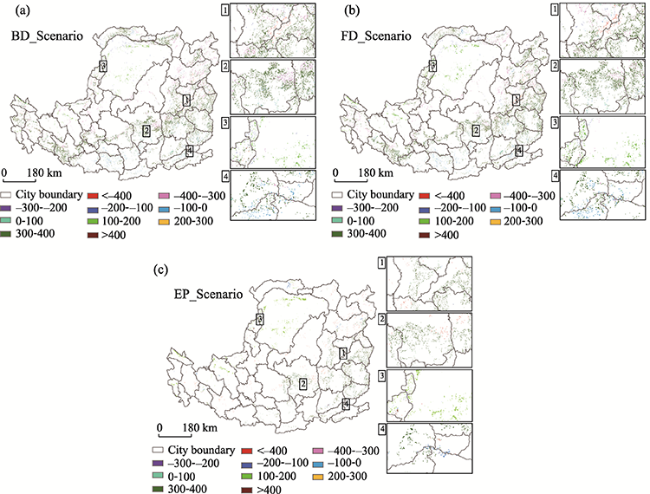
Figure 6 Changes in NPP in multi-scenario LUCC simulations of 2015-2025 (a. Changes in NPP in BD Scenario; b. Changes in NPP in FD Scenario; c. Changes in NPP in EP Scenario)
In the BD Scenario, the change in NPP indicates that the ecological protection measures achieve initial results, but there are still problems such as grassland degradation and the destruction of water area and forestland (Figure 6a). NPP increases from the southwest to the northeast in the staggered zone of farmland, forestland, and grassland as bandings. NPP increases in the central, southeastern, and northeastern mountainous areas primarily due to the transformation of grassland and farmland around the forestland to forestland; in the northern, western and southwestern valley plains mainly due to the conversion of grassland to farmland; in the sandy land area due to the conversion of unused land (sandy land) to grassland. The reduction area of NPP is relatively small and scattered in the study area. The main reasons for its significant decrease are the conversion of some grassland to urban land in the eastern valley plain, followed by the conversion from farmland to grassland in the northeastern mountainous and northern plain, and finally the conversion from forestland to farmland in the southern plain. In the FD Scenario, the change in NPP indicates that the ecological economy is emerging (Figure 6b). The economic forest increases, and sandy land management achieves an initial effect. However, urban sprawl is the strongest, water and original forestland are most severely damaged, and grassland continues to degrade. Compared with the BD Scenario, the NPP in the FD Scenario in the south (Huanglong and Ziwuling mountains) and the eastern Taihang Mountain increases, while in the northern, western, and southwestern valley plains, it decreases. In addition, the decrease area is increased due to the increase in urban expansion.
NPP changes the least and increases the most in the EP Scenario (Figure 6c). This indicates that the concept of economic and social development has changed, and the ecological economy has become a new highlight of economic development. Ecological protection measures, such as returning farmland to grassland/forestland, closing mountains for forest cultivation, water restoration, and sandy land management, are implemented with the strongest effort. The effect of ecological restoration is the most significant, and the economy and society develop harmoniously. Compared with the BD and FD scenarios, “farmland/grassland→forestland” transformation is added, which makes the NPP grow more in the southern plain and eastern Fenhe Valley. Transformations of “unused land→grassland” are also added, which makes the NPP increase more in the north and the west. As a result of returning farmland to grassland and of water area construction, the decreased area of NPP increases, but the distribution is scattered and mostly sporadic.
3.4.2 The changes in NPP caused by different land use/cover transfers in multi-scenario simulations
LUCC mostly occurs in local small areas and its distribution is spotty and sporadic. We calculated the NPP changes caused by the transfer of various land use/cover types at the prefecture administrative scale on the Loess Plateau in 2025 (Figure 7), highlighting the spatial differences of NPP changes in different scenarios. Considering that the urban land is not transferred to other land, we only calculated the NPP changes caused by the transfer of farmland, forestland, grassland, water area, and unused land.
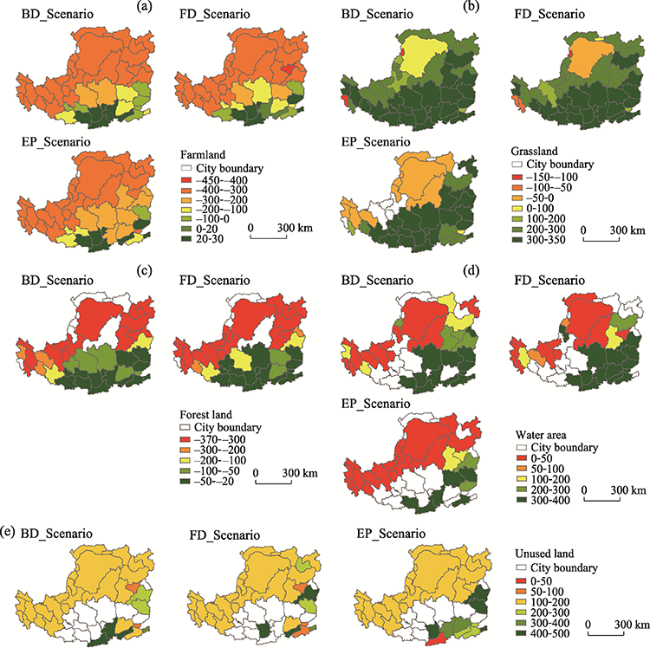
Figure 7 NPP changes caused by different land use/cover transfers in multi-scenario simulations on the Loess Plateau in 2025 (a. NPP changes caused by farmland transfer in multi-scenario simulation; b. NPP changes caused by grassland transfer in multi-scenario simulation; c. NPP changes caused by forestland transfer in multi-scenario simulation; d. NPP changes caused by water area transfer in multi-scenario simulation; e. NPP changes caused by unused land transfer in multi-scenario simulation)
The changes in NPP caused by farmland transfer are shown in Figure 7a. Farmland transfer causes NPP to decrease the most in the EP Scenario, which indicates that the effect of returning farmland to grassland is the most significant in this scenario. The transfer range of farmland in the three scenarios is wide. Except for Wuhai, farmland changes in other regions in the BD, FD, and EP scenarios, and the change in most areas makes NPP decrease, with decreases of 221 gC/km2, 217 gC/km2, and 226 gC/km2, respectively. The spatial distributions of NPP changes caused by farmland transfer in the three scenarios are basically the same. The spatial distributions by which farmland transfer caused a decrease in NPP can be divided into three sections from the southwest to the northeast as bandings. These sections show a decreasing trend from the northwest to the southeast, but there are differences in some areas. The first section is mainly concentrated in 300-400 gC/km2, with the main transfer being “farmland→grassland”. However, in the FD Scenario, the NPP decrease in Taiyuan (408 gC/km2) was mainly “farmland→urban land”. The second section is mainly concentrated in 0-300 gC/km2, with the main transfer again being “farmland→grassland”. The third section of is mainly concentrated in 20-30 gC/km2 and only distributed in the southern Weihe Plain and southeastern Taihang Mountains, with the main transfer being “farmland→forestland”.
The NPP changes caused by grassland transfer is shown in Figure 7b. It can be seen that, in the three scenarios, the area of grassland transfer is predominant and generally increased NPP, with the main transfer being “grassland→farmland/forestland”. The increase in NPP caused by grassland transfer is 260 gC/km2, 249 gC/km2, and 203 gC/km2 in the BD, FD, and EP scenarios, respectively. In the BD and FD scenarios, NPP changes caused by grassland transfer cover the entire Loess Plateau, and NPP is increased by the conversion of grassland to farmland slightly more in the BD Scenario (43 cities) than in the FD Scenario (42 cities). The grassland transfer causing an NPP decrease is mainly “grassland→unused land”. In the EP Scenario, the NPP increase region caused by the land use/cover transfer is mainly “grassland→forestland” and the NPP decrease region is mainly “grassland→water area”.
The NPP changes caused by forestland transfer is shown in Figure 7c. Because the transfer of forestland is limited in the EP Scenario, we only calculated the NPP changes caused by forestland transfer in the BD and FD scenarios. The decrease in NPP caused by forestland transfer is 171.8 gC/km2 and 182.4 gC/km2 in the BD and FD Scenario, respectively. It can be seen that NPP decreases by forestland destruction in these two scenarios, and the decrease in NPP in the FD Scenario is greater than the BD Scenario, which indicates that forestland is most severely damaged in the FD Scenario. The NPP changes caused by water area and unused land transfer are shown in Figure 7d and Figure 7e, respectively. These transfers caused an NPP increase, with the main transfer being “water area→grassland/farmland/ forestland” and “unused land→grassland/water area/forestland”. The increase in NPP caused by water area transfer is 218.22 gC/km2, 218.36 gC/km2, and 141.31 gC/km2 in the BD, FD, and EP scenarios, respectively. The change in NPP caused by water area transfer is the lowest in the EP Scenario, which indicates that the water area is well protected (Figure 7d). The increase in NPP caused by unused land transfer is 180.47 gC/km2, 181.56 gC/km2, and 198.49 gC/km2 in the BD, FD, and EP scenarios, respectively (Figure 7e). Unused land transfer cause NPP to increase the most in the EP Scenario, which indicates that the effect of sand control is the most significant in this scenario. There are two main situations whereby an NPP increase is caused by unused land transfer in the three scenarios. One is distributed in the border area from the southwest to the northeast, where the transfer was mainly “unused land→grassland”. The other is distributed in the southern valley plain and eastern Taihang Mountains, with the transfer mainly being “unused land→water area/forestland”.

4 Discussion and conclusions

4.1 Discussion

The government states that the period of 2010-2015 is the first phase of ecological governance, and the period 2016-2030 is the second phase. This is the main policy background that influences current and future LUCC. The simulation results of the LUCC shows that, in the EP Scenario, the change range of LUCC is the smallest, with the transfer area being mainly “grassland→forestland” and “unused land→grassland”, followed by “farmland→grassland/forestland” and “grassland→water area”. This transfer indicates that ecological protection measures, such as returning farmland to forestland or grassland, sandy land management, and water area protection, can be effectively implemented in this scenario, and the overall LUCC is shifting towards ecological protection. In the BD and FD scenarios, the change range of LUCC is larger, with the transfer area being mainly “grassland→farmland” and “unused land→grassland”, followed by “grassland→forestland” and “grassland/farmland→urban land”. Comparatively, the transfer of other land use/cover types to farmland in the BD Scenario is greater than it is in the FD Scenario, while transfer to economic forest in the FD Scenario is greater than it is in the BD Scenario. This is mainly because, under the influence of the current ecological protection policy, the economy has gradually shifted towards ecological protection, mainly manifested in the increase in economic forests on the Loess Plateau.
The changes in NPP caused by land use/cover transfer shows that, in general, the EP, BD, and FD scenarios make the increase in NPP gradually decrease. Considering that urban area did not undergo transfer, we only calculated the NPP change amount and rate caused by forestland, farmland, water area, grassland, and unused land (Table 8). Combined with multi-scenario LUCC simulations, it can be seen that, in the EP Scenario, the main sources for NPP increase are sandy land management (unused land→grassland) and closing hills for afforestation (grassland→forestland) in the mountainous areas, followed by returning farmland to forestland (farmland→forestland) in the valley plain areas. These easily transformed areas should become the focus of government departments or managers, who should continue to further strengthen the practice of measures such as returning farmland to forestland and sandy land control. The main sources for NPP decrease are the return of farmland to grassland (farmland→grassland) in the border area between the valley plain and mountainous areas, followed by the construction of water areas (grassland→water area) in the Hetao Plain and the valley plain. In the BD and FD scenarios, the main sources of NPP increase are the farmland expansion (grassland/water area→farmland), followed by sandy land management (unused land→grassland) and closing hills for afforestation (grassland→forestland). The main sources of NPP decrease are the return of farmland to grassland (farmland→grassland) and urban expansion (grassland/farmland→urban land), followed by water area construction (grassland→water area) and grassland degradation (grassland→unused land). Comparatively, the urban expansion in the FD Scenario is larger than that of the BD Scenario.
Table 8 Changes in NPP in the multi-scenario simulations on the Loess Plateau simulated from 2015 to 20253
NPP BD FD EP
Change (gC/km2) Rate (%) Change (gC/km2) Rate (%) Change (gC/km2) Rate (%)
Farmland -247.49 -37.72 -243.59 -37.13 -251.39 -38.31
Forestland -203.34 -33.71 -205.90 -34.13 0.00 0.00
Grassland 256.21 113.56 234.82 104.08 179.10 79.38
Water area 182.33 118.38 192.33 124.87 124.86 81.07
Unused land 169.02 947.07 171.20 959.28 186.27 1043.73
Average 31.35 221.52 29.77 223.39 47.77 233.17
NPP increased the most in the EP Scenario, which is most conducive to sustainable development. The results suggest that we should vigorously develop the EP Scenario in the future. We should further implement ecological conservation measures, such as returning farmland to forestland or grassland in the loess gully area and planting shrub grass in the loess hilly-gully and sandy desert areas to achieve wind sheltering and sand fixation. Furthermore, hills should be closed for forest and grass cultivation in earth-rocky mountainous areas, especially in forestland in the Taihang and Qinling mountains for the protection of major water resources. It is important to stabilize basic farmland in the valley plain area and in Hetao and Ningxia agricultural irrigation areas along the Yellow River. In addition, urban boundaries should be delimited, and expansion should be ceased indefinitely in the future urban developments.

4.2 Conclusions

Based on the LUCC on the Loess Plateau during 2005-2015, we simulated the LUCC distribution of multiple scenarios in 2025 and predicted and analyzed the NPP change caused by land use/cover transformation. In general, the ecological environment is protected to a certain extent in different scenarios, and NPP increases. However, in different simulation scenarios, the protection effect of land use/cover types is different, and NPP changes in different ways. The results are as follows: (1) In the BD and FD scenarios, land use/cover changes greatly. Farmland expansion and economic forest increase together, and grassland degradation is more severe. In the EP Scenario, the change in land use/cover is relatively small and is generally transferred in the direction of ecological protection. (2) The changes in NPP in different scenarios reflect the significant difference in ecological protection effects. All three scenarios promote NPP increases, but the EP Scenario promotes NPP increases the most. The ecological restoration effect is the most significant in this scenario. The increase in NPP in the BD Scenario is greater than it is in the FD Scenario. (3) The changes in NPP caused by LUCC in the three scenarios reflect the significant difference in the effect of various forms of land use/cover protection. In the EP Scenario, forestland experiences no transfer. The decrease in NPP caused by farmland transfer and the increase in NPP caused by unused land transfer are the most significant, and NPP increased by water area transfer is the least significant. The forestland, grassland and water area can be best protected, and the sandy land can be controlled. In the BD Scenario, the transfer of grassland to farmland increased NPP to the greatest extent, indicating that farmland increases the most in this scenario. In the FD Scenario, the decrease in NPP caused by forestland transfer is the most significant, indicating that forestland is damaged the most severely in this scenario.
[1]
Bussmann R W, 1996. Destruction and management of Mount Kenya’s forests. Ambio: A Journal of the Human Environment, 25(5):314-317.

[2]
Cao Mingkun, Prince S D, Small J et al., 2004. Remotely sensed interannual variations and trends in terrestrial net primary productivity 1981-2000. Ecosystems, 7(3):233-242.

[3]
Che Lei, Zhuo Liang, Xu Jiangang, 2021. Integrating the ecosystem service in sustainable plateau spatial planning: A case study of the Yarlung Zangbo River Basin. Journal of Geographical Sciences, 31(2):281-297.

DOI

[4]
Cheng Fangyan, Liu Shiliang, Zhang Yueqiu et al., 2017. Effects of land-use change on net primary productivity in Beijing based on the MODIS series. Acta Ecologica Sinica, 37(18):5924-5934. (in Chinese)

[5]
Dietzel C, Clarke K C, 2007. Toward optimal calibration of the SLEUTH land use change model. Transactions in GIS, 11(1):29-45.

[6]
Findell K L, Shevliakova E, Milly P C D et al., 2007. Modeled impact of anthropogenic land cover change on climate. Journal of Climate, 20(14):3621-3634.

DOI

[7]
Fu Yingchun, Lu Xueyue, Zhao Yaolong et al., 2013. Assessment impacts of weather and land use/land cover (LULC) change on urban vegetation net primary productivity (NPP): A case study in Guangzhou, China. Remote Sensing, 5(8):4125-4144.

DOI

[8]
Gao Qiong, Li Xiaobing, Yang Xiusheng, 2003. Responses of vegetation and primary production in north-south transect of eastern China to global change under land use constraint. Acta Botanica Sinica, 45(11):1274-1284.

[9]
Gimeno T E, Escudero A, Valladares D F et al., 2012. Previous land use alters the effect of climate change and facilitation on expanding woodlands of Spanish Juniper. Ecosystems, 15(4):564-579.

DOI

[10]
Guan Dongjie, Gao Weijun, Kazuyuki W, 2008. Land use change of Kitakyushu based on landscape ecology and Markov model. Journal of Geographical Sciences, 18(4):455-468.

DOI

[11]
Guo Mingming, Wang Wenlong, Kang Hongliang et al., 2018. Changes in soil properties and erodibility of gully heads induced by vegetation restoration on the Loess Plateau, China. Journal of Arid Land, 10(5):52-65.

[12]
Haberl H, Erb K-H, Krausmann F et al., 2007. Quantifying and mapping the human appropriation of net primary production in Earth’s terrestrial ecosystems. Proceedings of the National Academy of Sciences of the United States of America, 104(31):12942-12947.

[13]
Huang Jinliang, Tu Zhenshun, Lin Jie et al., 2009. Land-use dynamics and landscape pattern change in a coastal gulf region, southeast China. International Journal of Sustainable Development & World Ecology, 16(1):61-66.

[14]
Jiang Xiaowei, Bai Jianjun, 2020. Quantifying the impacts of drought and ecological restoration on net primary production changes in the Chinese Loess Plateau. PLoS ONE, 15(9):e0238997.

DOI

[15]
Kaptué Tchuenté Armel Thibaut, Roujean Jean Louis, De Jong Steven M, 2011. Comparison and relative quality assessment of the GLC2000, GLOBCOVER, MODIS and ECOCLIMAP land cover data sets at the African continental scale. International Journal of Applied Earth Observation & Geoinformation, 13(2):207-219.

[16]
Li Jing, Ren Zhiyuan, 2005. Effects of land use change on values of NPP ecosystem services of Loess Plateau in northern Shaanxi. Chinese Journal of Ecology, 24(9):1029-1032. (in Chinese)

[17]
Liao Weilin, Liu Xiaoping, Xu Xiyun et al., 2020. Projections of land use changes under the plant functional type classification in different SSP-RCP scenarios in China. Science Bulletin, 65(22):1935-1947.

DOI

[18]
Liu Xiaoping, Liang Xun, Li Xia et al., 2017. A future land use simulation model (FLUS) for simulating multiple land use scenarios by coupling human and natural effects. Landscape & Urban Planning, 168:94-116.

[19]
Mao Dehua, Luo Ling, Wang Zongming et al., 2015. Variations in net primary productivity and its relationships with warming climate in the permafrost zone of the Tibetan Plateau. Journal of Geographical Sciences, 25(8):967-977.

DOI

[20]
Millennium Ecosystem Assessment (MEA), 2005. Ecosystems and Human Well-being: Synthesis. Washington DC: Island Press.

[21]
Pei Fengsong, Li Xia, Liu Xiaoping et al., 2015. Dynamic simulation of urban expansion and their effects on net primary productivity: A scenario analysis of Guangdong Province in China. Journal of Geo-information Science, 17(4):470-476. (in Chinese)

[22]
Peng Dailing, Wu Chaoyang, Zhang Bing et al., 2016. The influences of drought and land-cover conversion on inter-annual variation of NPP in the Three-North Shelterbelt Program Zone of China based on MODIS data. PLoS ONE, 11(6):e0158173.

DOI

[23]
Ran Youhua, Li Xin, Lu Ling, 2009. Accuracy evaluation of the four remote sensing based land cover products over China. Journal of Glaciology and Geocryology, 31(3):491-500. (in Chinese)

[24]
Sohl T L, Sayler K L, Drummond M A et al., 2007. The FORE-SCE model: A practical approach for projecting land cover change using scenario-based modeling. Journal of Land Use Science, 2(2):103-126.

DOI

[25]
Verburg P H, Soepboer W, Veldkamp A et al., 2002. Modeling the spatial dynamics of regional land use: The CLUE-S model. Environmental Management, 30(3):391-405.

PMID

[26]
Wang Baosheng, Liao Jiangfu, Zhu Wei et al., 2019. The weight of neighborhood setting of the FLUS model based on a historical scenario: A case study of land use simulation of urban agglomeration of the Golden Triangle of southern Fujian in 2030. Acta Ecologica Sinica, 39(12):4284-4298. (in Chinese)

[27]
Wang Hong, Li Xiaobing, Long Huiling et al., 2009. Monitoring the effects of land use and cover changes on net primary production: A case study in China’s Yongding River basin. Forest Ecology and Management, 258(12):2654-2665.

DOI

[28]
Wu Xinxi, Liu Xiaoping, Liang Xu et al., 2018. Multi-scenarios simulation of urban growth boundaries in Pearl River Delta based on FLUS-UGB. Journal of Geo-information Science, 20(4):532-542. (in Chinese)

[29]
Xia Wentao, Wang Ying, Feng Qisheng et al., 2010. Accuracy assessment of MODIS land cover product of Gannan prefecture. Pratacultural Science, 27(9):11-18. (in Chinese)

[30]
Yuan Quanzhi, Wu Shaohong, Dai Erfu et al., 2017. NPP vulnerability of the potential vegetation of China to climate change in the past and future. Journal of Geographical Sciences, 27(2):131-142.

DOI

[31]
Zhang Jingdu, Mei Zhuxiong, Lv Jiahui et al., 2020. Simulating multiple land use scenarios based on the FLUS model considering spatial autocorrelation. Journal of Geo-information Science, 22(3):531-542. (in Chinese)

[32]
Zhang Yili, Qi Wei, Zhou Caiping et al., 2014. Spatial and temporal variability in the net primary production of alpine grassland on the Tibetan Plateau since 1982. Journal of Geographical Sciences, 24(2):269-287.

DOI

[33]
Zhu Wenquan, Pan Yaozhong, Long Zhonghua et al., 2005. Estimating net primary productivity of terrestrial vegetation based on GIS and RS: A case study in Inner Mongolia, China. Journal of Remote Sensing of China, 9(3):300-307.

[34]
Zhuang Liyue, Chen Yuping, Fan Liya et al., 2019. Study on the ozone formation sensitivity in the Pearl River Delta based on OMI satellite data and MODIS land cover type products. Acta Scientiae Circumstantiae, 39(11):3581-3592. (in Chinese)

Outlines

/