Research Articles

Biogeographical patterns of arbuscular mycorrhizal fungi diversity in China’s grasslands

  • TENG Jialing , 1, 2 ,
  • TIAN Jing 3, 1 ,
  • YU Guirui , 1, 2, *
Expand
  • 1. Key Laboratory of Ecosystem Network Observation and Modeling, Institute of Geographic Sciences and Natural Resources Research, CAS, Beijing 100101, China
  • 2. College of Resources and Environment, University of Chinese Academy of Sciences, Beijing 100049, China
  • 3. College of Resources and Environmental Sciences; Key Laboratory of Plant-Soil Interactions, Ministry of Education, China Agricultural University, Beijing 100193, China
* Yu Guirui, Professor, E-mail:

Teng Jialing (1992-), PhD, specialized in microbial ecology. E-mail:

Received date: 2020-11-10

  Accepted date: 2021-03-10

  Online published: 2021-09-25

Supported by

National Key R&D Program of China(2017YFA0604803)

National Natural Science Foundation of China(31770560)

Copyright

Copyright reserved © 2021.

Abstract

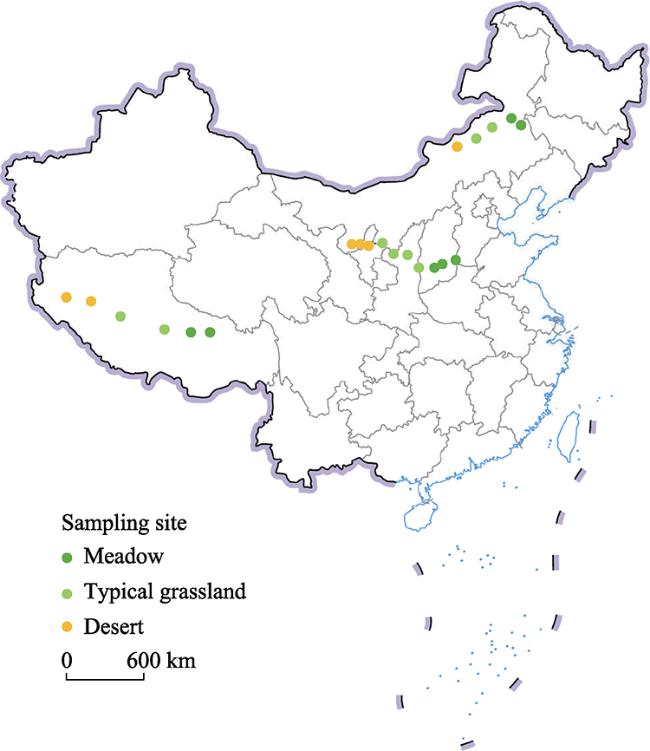
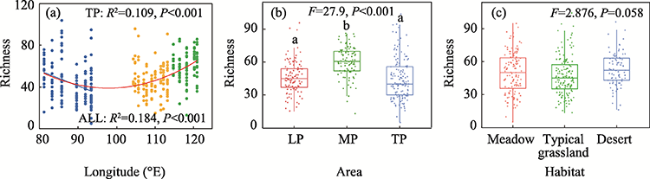
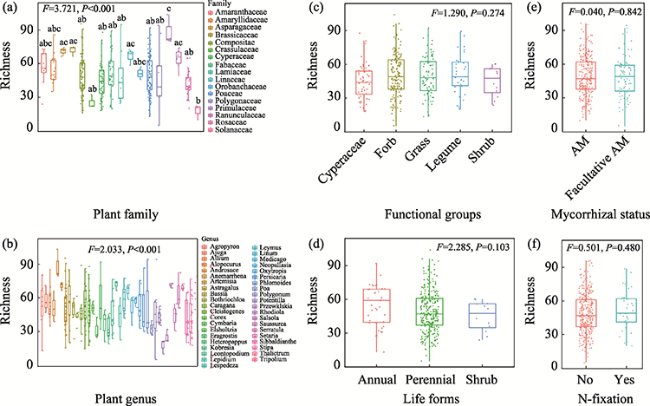
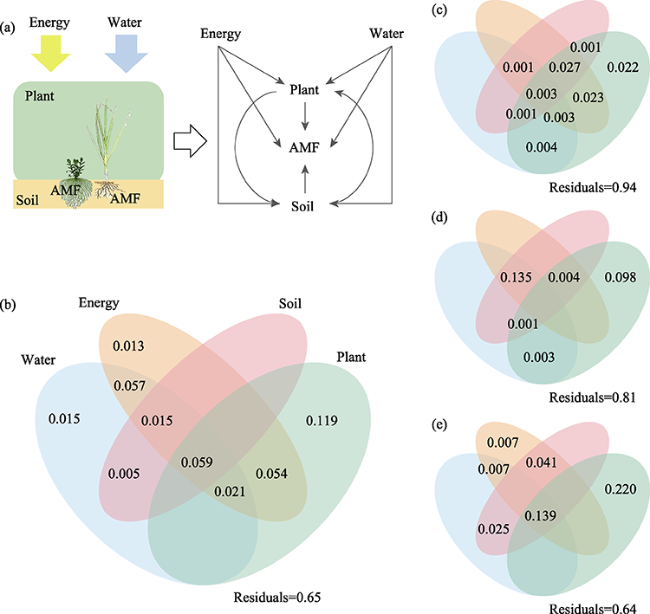
Arbuscular mycorrhizal fungi (AMF) are universally mutualistic symbionts that colonize the fine roots of most vascular plants. However, the biogeographical patterns and driving factors of AMF diversity of plant roots in grasslands are not well investigated. In this study, we used high-throughput sequencing techniques and bioinformatics to evaluate the AMF richness of 333 individual plant roots in 21 natural grassland ecosystems in northern China, including the Loess Plateau (LP), the Mongolian Plateau (MP), and the Tibetan Plateau (TP). The AMF richness showed a significant parabolic trend with increasing longitude. In regional situations, the AMF richness in the grasslands of the MP (60.4 ± 1.47) was significantly higher than those of the LP (46.4 ± 1.43) and TP (44.3 ± 1.64). Plant traits (including plant families, genera, and functional groups) explained the most variation in the AMF richness across China’s grasslands, followed by energy and water; soil properties had the least effects. The results showed the biogeographical patterns of the AMF richness and the underlying dominant factors, providing synthetic data compilation and analyses in the AMF diversity in China’s grasslands.

Cite this article

TENG Jialing , TIAN Jing , YU Guirui . Biogeographical patterns of arbuscular mycorrhizal fungi diversity in China’s grasslands[J]. Journal of Geographical Sciences, 2021 , 31(7) : 965 -976 . DOI: 10.1007/s11442-021-1880-6

1 Introduction

Arbuscular mycorrhiza are the mutualistic symbionts formed by plant fine roots infected by Glomeromycota fungi, which are presented in more than 80% of land plants (Chaudhary et al., 2008; Bueno et al., 2017; Botnen et al., 2019). Arbuscular mycorrhizal fungi (AMF) promote nutrient foraging and absorption in the host plants, and the plants allocate photosynthate to the fungi for survival and development (Gavito et al., 2003; Hawkes et al., 2008). In addition, AMF enhance the resilience of plants and maintain ecosystem stability to some extent (Brundrett et al., 2002; Mariotte et al., 2013; Smith et al., 2015). As an important link between aboveground vegetation and belowground microbes, knowledge regarding the biogeographical patterns of the AMF diversity and the variation mechanisms is crucial to understand the function of AMF and interactions with plants under the background of global climate change (Botnen et al., 2019; Ceulemans et al., 2019; Xu et al., 2020). The biogeographical distribution patterns of species diversity and their mechanisms are one of the core aspects in ecology and biogeography (Wang et al., 2009; Yin et al., 2010; Chu et al., 2020). Compared with macroorganisms, the geographical distribution patterns and mechanisms underlying microbes are not well investigated because of the limitations in quantificational and visualization tools (Crisp, 2001; Decaëns, 2010; Allen et al., 2020; Chu et al., 2020).
Water and energy are important determinants of large-scale biodiversity patterns (Hawkins et al., 2003). Most studies showed that contemporary water, energy, and soil properties were the main factors affecting the spatial distribution of microorganisms (Drenovsky et al., 2010; Heino et al., 2014; Andrew et al., 2018; Chu et al., 2020). Precipitation and temperature directly affect the AMF diversity (Bueno et al., 2017; Ceulemans et al., 2019; Duffy et al., 2019). Precipitation influences the AMF diversity mainly through changes in the soil moisture, evapotranspiration rate, and plant productivity (Nielsen et al., 2010; Zhou et al., 2018). Temperature directly affects colonization, development, and geographical distribution of the AMF richness (Hawkes et al., 2008; Duffy et al., 2019). In addition, the same species would select different survival and development strategies at varied temperatures: adopt a conservative strategy to store energy in vesicles at lower temperatures and aggressive strategies to generate more extraradical mycelia to obtain nutrients at a higher temperature. Therefore, temperature extremes may have been an underrated factor in previous research. Soil properties are mostly studied to analyze the shaping of the AMF community and richness. Soil structure, organic carbon, pH, and nitrogen and phosphorus nutrition (Gavito et al., 2003) cause fine adjustments in the AMF richness and distribution.
AMF occupy a dual niche of both soil and plant roots (Vályi et al., 2016), and besides abiotic factors, there are direct effects from plants. As a symbiont, AMF require photosynthetic products from host plants for survival and development, and host plants allocate photosynthates to various AMF according to selection mechanisms (van der Heijden et al., 2015). Therefore, compared with other microbes, the geographical distribution of AMF is tightly linked to the characteristics of host plants to a certain extent (Davison et al., 2015; Andrew et al., 2018). Plant distribution is determined by water and energy conditions at a large scale. However, knowledge about the joint effects of climate, soil, and plant traits on the AMF richness is limited.
Grassland accounts for approximately more than 40% of the land area in China and is typically fragile ecological regions and sensitive to global changes (Mu et al., 2013; Zhang et al., 2014; Dai et al., 2016; Jiao et al., 2017; Yuan et al., 2017; Wang et al., 2018). AMF is an essential link between aboveground vegetation and belowground microbes. Temperate grassland is one of the regions with high AMF colonization intensity (Öpik et al., 2006). The spatial distribution of AMF and the variation mechanisms are crucial for understanding the function of AMF and their interactions with plants in the context of global climate changes (Steidinger et al., 2020). In this study, we investigated AMF richness in plant roots across 21 natural grassland ecosystems in northern China, including the Loess Plateau (LP), the Mongolian Plateau (MP), and the Tibetan Plateau (TP). Based on the measured data, we analyzed the biogeographic patterns of the AMF richness and investigated: 1) the longitudinal patterns of variation in the AMF richness in different areas, and 2) the primary factors controlling longitudinal variation.

2 Materials and methods

2.1 Study sites and sampling

The study area included the Loess Plateau (LP), the Mongolian Plateau (MP), and the Tibetan Plateau (TP) (Figure 1). The sampling sites in the LP were at latitudes from 35.99°N to 37.46°N and longitudes from 104.44°E to 113.36°E and had mean annual temperatures (MAT) of 5.22-11.85 ℃ and mean annual precipitation (MAP) of 180-493 mm. The sampling sites in the MP were at latitudes from 44.01°N to 45.10°N and longitudes from 114.89°E to 121.04°E and had MAT of 1.08-6.65℃ and MAP of 228-393 mm. The sampling sites in the TP were at latitudes from 31.54°N to 32.41°N and longitudes from 81.23ºE to 93.53°E and had MAT of -2.98 to 0.575℃ and MAP of 75-593 mm.
Figure 1 Geographic locations of sampling sites
Field sampling was carried in July 2018 at the peak of the growing seasons. The dominant arbuscular mycorrhizal plant species that appeared within a 1-km radius circle were surveyed and identified at each site in natural grassland communities. Three randomly selected individuals of each plant species were collected by removing the soil and other materials adhering to the roots. The fresh fine roots were cut off using sterile scissors and stored in centrifuge tubes in an ice box. Overall, 333 individuals belonging to 41 genera in 17 families were sampled from 21 sites (including meadow, typical grassland, and desert). Further, the topsoil (0-10 cm) was randomly sampled (with eight replicates at each site) to evaluate the physical and chemical properties.

2.2 Environmental variables

The temperature, precipitation, and wind-speed values pertaining to the 1970-2000 period were collected from the WorldClimate data platform (https://www.worldclim.org/). Dryness index (DI) was computed using the following formula: DI = MAP/(MAT + 10) (Martonne, 1926). Solar radiation data were obtained from Liu et al. (2017) and Tang et al. (2017). Potential evapotranspiration data were obtained from the CGIAR-CSI database (https://cgiarcsi.community/).
Soil organic carbon (SOC) and nitrogen were determined using an elemental analyzer (Vario MAX CN, Elementar, Germany). The 150-mg soil samples were soaked in a solution of 10 ml of HNO3 overnight and boiled for digestion in a microwave digestion system (Mars X press Microwave Digestion System, CEM Corporation, NC, Matthews, USA). The cooled solutions were adjusted to 15 ml and determined concentration of carbon and nitrogen using an elemental analyzer. Soil total phosphorus (STP) and available phosphorus (SAP) were determined using an inductively coupled plasma-optical emission spectrometry (ICP-OES, Optima 5300 DV, USA). The 0.05-g soil samples were soaked in a solution of 6 ml of HNO3 and 3 ml of HF overnight, then the solutions were boiled for digestion (Mars X press Microwave Digestion System, CEM Corporation, NC, Matthews, USA) and removed the acid by 0.5 ml of HCLO4. The cooled solutions were adjusted to 15 ml for the concentration of P. The soil pH and oxidation reduction potential (ORP) were determined using a multiparameter conductivity/pH tester (MYRON L, Ultrameter II TM, USA) in a 1:2.5 soil-to-water ratio.
All environmental variables in the analysis are shown in Table 1.
Table 1 List of environmental factors
Variables Abbreviation Unit
Climate Energy Mean annual temperature MAT
Mean temperature of coldest month MTCM
Mean temperature of warmest month MTWM
Annual total radiation Rd MJ m-2yr-1
Maximum monthly radiation Rdmax MJ m-2day-1
Minimum monthly radiation Rdmin MJ m-2day-1
Minimum photosynthetically active radiation PARmin mol m-2day-1
Maximum photosynthetically active radiation PARmax mol m-2day-1
Potential evapotranspiration ET0 mm yr-1
Water Mean annual precipitation MAP mm
Precipitation of the driest month PDM mm
Precipitation of the wettest month PWM mm
Other Maximum monthly wind speed Windmax m s-1
Dryness index
Soil Organic carbon SOC %
Carbon-Nitrogen ratio CN /
Total phosphorus STP mg kg-1
Available phosphorus SAP mg kg-1
NO3- / mg kg-1
NH4+ / mg kg-1
pH / /
Oxidation reduction potential ORP mv

2.3 Molecular analysis

DNA was extracted from 70 mg freeze-dried roots using a PowerSoil kit (MOBIO Laboratories, USA) according to the manufacturer’s instructions. Primers GeoA2/AML2 (first PCR, targeting the SSU region) (Schwarzott and Schüßler, 2001; Lee et al., 2008) and NS31/ AMDGR (second PCR) (Simon et al., 1992; Sato et al., 2005) were used for amplification. After PCR and purification, a DNA library was constructed and run on a MiSeq Illumina platform at Biobit Biotech Inc., Chengdu, China.
Sequencing data were analyzed using FLASH (V1.2.7), Qiime (V1.9.0), and Usearch (v8.0) software. The number of operational taxonomic units (OTUs) was obtained using Qiime (V 1.9.0); each OTU had > 97% sequence similarity. A randomly selected subset of 408 sequences per sample was used in the subsequent analysis. Richness (observed species, indicating phylotype richness) was calculated and analyzed using Qiime (V 1.9.0).

2.4 Data analysis

A one-way analysis of variance (ANOVA) with least significant difference (LSD) post-hoc testing was used to test the significance of the effects of the study area, habitats, and plant traits on the AMF richness. Relationships between the AMF richness and environmental factors were determined using Pearson correlation analysis, and linear or square regression analysis was used to select the best fitting model with the highest R2 value. Variation partitioning analysis (VPA) was used to assess the effects of climate, soil, and plant factors on the AMF richness. Because of the high autocorrelation between environmental variables, only one variable was chosen from among the variables with significant correlations to avoid collinearity. All analyses were conducted using R software (version 3.6.3, R Development Core Team).

3 Results

3.1 Biogeographical patterns in AMF richness

The AMF richness showed a significant parabolic trend with increasing longitude (R2 = 0.184, P < 0.001, Figure 2a). However, in the regional situations, only the AMF richness of the TP showed an obvious trend with longitude (R2 = 0.109, P < 0.001) (Figure 2a). The AMF richness was considerably different in different areas (F = 27.9, P < 0.001) (Figure 2b). The richness on the MP (60.4 ± 1.47) was significantly higher than that on the LP (46.4 ± 1.43) and TP (44.3 ± 1.64). However, there was no significant difference in the richness of different habitats (F = 2.88, P = 0.058) (Figure 2c).
Figure 2 Longitudinal trends in arbuscular mycorrhizal fungi (AMF) richness (a) and AMF richness in different (b) areas and (c) habitats. Solid line represents model-predicted values of richness at a range of longitudes. Different letters indicate significant difference in richness between two groups.

3.2 Differences in AMF richness among plant functional types

There were significant differences in the AMF richness of different families and genera of host plants (F = 3.72, P < 0.001) (Figure 3a); (F = 3.03, P < 0.001) (Figure 3b). Unexpectedly, the plant functional groups (F = 1.29, P = 0.274) (Figure 3c), life forms (F = 2.29, P = 0.103) (Figure 3d), mycorrhizal status (F = 0.040, P = 0.842) (Figure 3e), and N-fixation or not (F = 0.501, P = 0.480) (Figure 3f) had no effects on the AMF richness.
Figure 3 Arbuscular mycorrhizal fungi (AMF) richness of different plant traits (a. Families; b. Genera; c. Functional groups; d. Life forms; e. Mycorrhizal status; f. Nitrogen fixation. Different letters indicate significant difference in richness between two groups.)

3.3 Determinants of the biogeographical patterns in AMF richness

Overall, the correlation and regression analyses indicated that climate and soil properties significantly affected the AMF richness (Table 2 and Figure S1). Rdmin (r = -0.298, P < 0.01) and STP (r = -0.239, P < 0.01) were the most highly correlated climate and soil variables, respectively. In the regional situations, only the ET0 (r = 0.241, P < 0.05) and Windmax (r = 0.200, P < 0.05) had significant effects on the AMF richness of the LP. The SAP (r = -0.344, P < 0.01) and MTCM (r = 0.265, P<0.05) had the highest relevance on the MP; Rdmax (r = 0.383, P < 0.01) and PWM (r = -0.360, P < 0.01) had the highest relevance on the TP.
Table 2 Correlation coefficients and significance between arbuscular mycorrhizal fungi (AMF) richness and environmental variables
Variables ALL LP MP TP
Energy MAT 0.052 0.074 0.245* -0.118
MTCM -0.190** 0.036 0.265* -0.188*
MTWM 0.216** 0.079 0.191 0.048
Rd -0.155** -0.063 -0.181 0.299**
Rdmax 0.022 -0.052 -0.123 0.383**
Rdmin -0.298** -0.093 0.13 0.01
PARmax -0.069 -0.069 -0.207 0.341**
PARmin -0.297** -0.099 -0.015 -0.052
ET0 0.196** 0.241* 0.245* 0.189*
Water MAP -0.213** -0.094 0.16 -0.352**
PDM -0.203** 0 -0.201 0.003
PWM -0.076 -0.039 0.2 -0.360**
Other Windmax 0.255** 0.200* -0.011 0.244**
DI -0.257** -0.183 -0.242* -0.211*
Soil SOC -0.160** -0.027 0.128 -0.225**
CN -0.056 -0.016 0.012 0.244**
STP -0.239** -0.121 -0.003 -0.076
SAP 0.052 0.101 -0.344** -0.157
NH4+ -0.203** -0.173 -0.1 -0.172*
NO3- -0.033 -0.145 -0.147 -0.156
pH 0.116* -0.007 0.253* 0.266**
ORP -0.211** -0.099 -0.015 -0.052
The influences of biotic and abiotic factors on the AMF richness were investigated using a variation partitioning analysis (Figure 4). The results showed that climate, soil, and plant variables jointly determined the AMF richness in China’s grasslands (Figure 4). The environmental variables (the selected significant factors) and plant traits (including plant families, genera, and functional groups) considered here accounted for 35%, 6%, 19%, and 36% of the variation in the geographical patterns of the entire grasslands, the LP, the MP, and the TP, respectively (Figure 4). Plant traits played a more important role compared with climate and soil variability in determining the AMF richness across China’s grasslands (Figure 4), followed by energy and water; soil had the least effects. However, the factors impacting the AMF richness varied between different areas in this study. Plant traits, energy, and soil played greater roles in affecting the AMF richness of the LP and the TP, whereas, energy, soil, and water contributed more to the MP. Moreover, interactions among these factors contributed to considerable explanations, and a single factor explained less variation besides plant traits.
Figure 4 Effects of water, energy, soil, and plant factors on the arbuscular mycorrhizal fungi (AMF) richness patterns (a. Diagrams showing biotic and abiotic factors affecting AMF richness; b. Entire grasslands; c. Loess Plateau (LP); d. Mongolian Plateau (MP); e. Tibetan Plateau (TP))

4 Discussion

This study provides a comprehensive documentation of the biogeographical patterns of the AMF richness in plant roots in grassland ecosystems in northern China. Studies have shown that the geographical distribution patterns and environmental drivers of belowground microbes are similar to those of aboveground plant communities (Prober et al., 2015; Yang et al., 2017). Climatic factors (primarily energy and water) control the distribution of terrestrial biodiversity (Wang et al., 2009; Nielsen et al., 2010), which is in agreement with our findings. The AMF richness of plant roots showed a geographical pattern that initially decreased significantly and then increased along the longitude; this was mainly determined by the solar radiation and temperature.
In recent years, many emphases have been placed on the predominant role of energy in shaping geographical biodiversity patterns (Wang et al., 2009; Pinel-Alloul et al., 2013). Energy takes distinct forms, and both forms of energy may influence biodiversity through different mechanisms (Allen et al., 2007; Wang et al., 2009). The effects of energy on AMF richness arise from both habitat and resources. Solar radiation directly determines the habitat conditions of host plants and soil fungi. Furthermore, solar radiation is a fundamental resource for plants to produce photosynthates and allocate to roots for AMF. In this study, the AMF richness was mainly controlled by variations in Rdmin and decreased with increasing Rdmin, which may be attributed to intense radiation restricting survival and development of host plants and AMF. Previous research has shown that temperature is usually a main factor affecting the distribution of the AMF richness (Gai et al., 2012; Davison et al., 2015). Different AMF have their unique optimum temperature ranges, and extreme temperatures are unfavorable for colonization, multiplication, and spread; minimum, optimum, and lethal temperatures are key parameters determining the AMF niche (Soudzilovskaia et al., 2015).
As symbiotic microbes that depend on plants for energy, the AMF diversity must be significantly influenced by the host plant (Merckx et al., 2017). Various studies have found that aboveground diversity, community structure, and productivity are determining factors of the AMF richness and community (Johnson et al., 2004; De Deyn et al., 2011; Merckx et al., 2017) because plant photosynthetic products are a major source of AMF. Furthermore, host plants may allocate more energy to collaborators who provide more nutrients, and AMF may provide more nutrients for those who allocate more energy (Bever et al., 2009; Kiers et al., 2011; Fellbaum et al., 2014). Therefore, functionally similar plant species may choose functionally similar AMF on the basis of this mutual benefit, and plant functional groups may be an important factor affecting AMF richness. Unexpectedly, we did not find a significant variation of AMF richness in different plant functional groups, although plant taxonomy significantly affected AMF richness. This may be due to the functional redundancy of AMF. Different groups of fungi can be substituted for each other in function; thus, changes in diversity had no obvious effects on function.
As microbes that occupy a dual ecological niche of soil and plant roots, AMF are closely related to soil properties. Krüger et al. (2015) recorded the AMF community variation in soils on a scale and in severe phosphorus deficiency conditions and found that strong environmental filtration is the main driver of AMF diversity and soil phosphorus availability is the most important soil variable. Phosphorus availability is the basic soil condition that affects mycorrhizal function (Smith et al., 2008). Compared with soil nitrogen, soil phosphorus has stronger effects on AMF (Treseder, 2004; Twieg et al., 2007; Dickie et al., 2009). The results of this study showed that soil phosphorus was the dominant soil factor and negatively correlated with the AMF richness. In addition, soil pH was also an important factor affecting mycorrhizal colonization and spatial distribution; overall, AMF preferred alkaline soil. The grassland soil was prevalently weakly alkaline, and the soil pH in our study area was 6.6-8.4 and mostly > 7. Under suitable pH conditions, the AMF richness increased with increasing soil pH. In particular, the average soil pH was 8.1 on the Loess Plateau, where soil pH had no significant effects.
The climate, soil, and plant variables considered here provided only a partial explanation for the variations in the AMF richness along the environmental gradient, and more than half of the variation in the AMF richness remained unclear. This is most likely due to the influence of random factors such as dispersal limitation (Jenkins et al., 2007; Kivlin, 2020) and ecological drift (Queloz et al., 2011), and further analysis is needed.

5 Conclusions

This study provided a comprehensive documentation of the biogeographical patterns of the AMF richness in plant roots in China’s grasslands and quantified the potential influencing factors. The AMF richness in plant roots initially decreased and then increased with increasing longitude in China. The AMF richness on the MP was significantly higher than that on the LP and the TP. Climate, soil, and plant variables jointly determined the AMF richness in China’s grasslands. Plant traits played a more important role in determining the AMF richness, followed by energy and water; soil had the least effects. However, the generality of these results, regarding the relative importance of climate, soil, and plant factors, may be further investigated by examining the effects of random factors to evaluate the biogeographical patterns of AMF more comprehensively.
[1]
Allen A, Gillooly J, Brown J, 2007. Recasting the species-energy hypothesis: The different roles of kinetic and potential energy in regulating biodiversity. In: Storch D, Marquet P, Brown J (eds.). Scaling Biodiversity. Cambridge: Cambridge University Press, 283-299.

[2]
Allen W J, DeVries A E, Bologna N J et al., 2020. Intraspecific and biogeographical variation in foliar fungal communities and pathogen damage of native and invasive Phragmites australis. Global Ecology and Biogeography, 29(7):1199-1211.

DOI

[3]
Andrew C, Halvorsen R, Heegaard E et al., 2018. Continental-scale macrofungal assemblage patterns correlate with climate, soil carbon and nitrogen deposition. Journal of Biogeography, 45(8):1942-1953.

DOI

[4]
Bever J D, Richardson S C, Lawrence B M et al., 2009. Preferential allocation to beneficial symbiont with spatial structure maintains mycorrhizal mutualism. Ecology Letters, 12(1):13-21.

DOI

[5]
Botnen S S, Davey M L, Aas A B et al., 2019. Biogeography of plant root-associated fungal communities in the North Atlantic region mirrors climatic variability. Journal of Biogeography, 46(7):1532-1546.

[6]
Brundrett M C, Abbott L K, 2002. Arbuscular mycorrhizas in plant communities. In: Sivasithamparama K, Dixon K W, Barrett R L (eds.). Microorganisms in Plant Conservation and Biodiversity. Dordrecht: Springer Netherlands, 151-193.

[7]
Bueno C G, Moora M, Gerz M et al., 2017. Plant mycorrhizal status, but not type, shifts with latitude and elevation in Europe. Global Ecology and Biogeography, 26(6):690-699.

DOI

[8]
Ceulemans T, Van Geel M, Jacquemyn H et al., 2019. Arbuscular mycorrhizal fungi in European grasslands under nutrient pollution. Global Ecology and Biogeography, 28(12):1796-1805.

DOI

[9]
Chaudhary V B, Lau M K, Johnson N C, 2008. Macroecology of microbes: Biogeography of the glomeromycota. In: Varma A (ed.). Mycorrhiza: State of the Art, Genetics and Molecular Biology, Eco-Function, Biotechnology, Eco-Physiology, Structure and Systematics. Berlin, Heidelberg: Springer Berlin Heidelberg, 529-563.

[10]
Chu H, Gao G F, Ma Y et al., 2020. Soil microbial biogeography in a changing world: Recent advances and future perspectives. mSystems, 5(2):e00803-00819.

[11]
Crisp M D, 2001. Historical biogeography and patterns of diversity in plants, algae and fungi: Introduction. Journal of Biogeography, 28(2):153-155.

DOI

[12]
Dai E, Huang Y, Wu Z et al., 2016. Analysis of spatio-temporal features of a carbon source/sink and its relationship to climatic factors in the Inner Mongolia grassland ecosystem. Journal of Geographical Sciences, 26(3):297-312.

DOI

[13]
Davison J, Moora M, Opik M et al., 2015. Global assessment of arbuscular mycorrhizal fungus diversity reveals very low endemism. Science, 349(6251):970-973.

DOI

[14]
De Deyn G B, Quirk H, Bardgett R D, 2011. Plant species richness, identity and productivity differentially influence key groups of microbes in grassland soils of contrasting fertility. Biology Letters, 7(1):75-78.

DOI

[15]
Decaëns T, 2010. Macroecological patterns in soil communities. Global Ecology and Biogeography, 19(3):287-302.

DOI

[16]
Dickie I A, Richardson S J, Wiser S K, 2009. Ectomycorrhizal fungal communities and soil chemistry in harvested and unharvested temperate Nothofagus rainforests. Canadian Journal of Forest Research, 39(6):1069-1079.

DOI

[17]
Drenovsky R E, Steenwerth K L, Jackson L E et al., 2010. Land use and climatic factors structure regional patterns in soil microbial communities. Global Ecology and Biogeography, 19(1):27-39.

PMID

[18]
Duffy K J, Waud M, Schatz B et al., 2019. Latitudinal variation in mycorrhizal diversity associated with a European orchid. Journal of Biogeography, 46(5):968-980.

DOI

[19]
Fellbaum C R, Mensah J A, Cloos A J et al., 2014. Fungal nutrient allocation in common mycorrhizal networks is regulated by the carbon source strength of individual host plants. New Phytologist, 203(2):646-656.

DOI

[20]
Gai J P, Tian H, Yang F Y et al., 2012. Arbuscular mycorrhizal fungal diversity along a Tibetan elevation gradient. Pedobiologia, 55(3):145-151.

DOI

[21]
Gavito M E, Schweiger P, Jakobsen I, 2003. P uptake by arbuscular mycorrhizal hyphae: Effect of soil temperature and atmospheric CO2 enrichment. Global Change Biology, 9(1):106-116.

DOI

[22]
Hawkes C V, Hartley I P, Ineson P et al., 2008. Soil temperature affects carbon allocation within arbuscular mycorrhizal networks and carbon transport from plant to fungus. Global Change Biology, 14(5):1181-1190.

DOI

[23]
Hawkins B A, Field R, Cornell H V et al., 2003. Energy, water, and broad-scale geographic patterns of species richness. Ecology, 84(12):3105-3117.

DOI

[24]
Heino J, Tolkkinen M, Pirttilä A M et al., 2014. Microbial diversity and community-environment relationships in boreal streams. Journal of Biogeography, 41(12):2234-2244.

DOI

[25]
Jenkins D G, Brescacin C R, Duxbury C V et al., 2007. Does size matter for dispersal distance? Global Ecology and Biogeography, 16(4):415-425.

DOI

[26]
Jiao C, Yu G, He N et al., 2017. Spatial pattern of grassland aboveground biomass and its environmental controls in the Eurasian steppe. Journal of Geographical Sciences, 27(1):3-22.

DOI

[27]
Johnson D, Vandenkoornhuyse P J, Leake J R et al., 2004. Plant communities affect arbuscular mycorrhizal fungal diversity and community composition in grassland microcosms. New Phytologist, 161(2):503-515.

DOI

[28]
Kiers E T, Duhamel M, Beesetty Y et al., 2011. Reciprocal rewards stabilize cooperation in the mycorrhizal symbiosis. Science, 333(6044):880-882.

DOI

[29]
Kivlin S N, 2020. Global mycorrhizal fungal range sizes vary within and among mycorrhizal guilds but are not correlated with dispersal traits. Journal of Biogeography, 47(9):1994-2001.

DOI

[30]
Krüger M, Teste F P, Laliberté E et al., 2015. The rise and fall of arbuscular mycorrhizal fungal diversity during ecosystem retrogression. Molecular Ecology, 24(19):4912-4930.

DOI

[31]
Lee J, Lee S, Young J P W, 2008. Improved PCR primers for the detection and identification of arbuscular mycorrhizal fungi. FEMS Microbiology Ecology, 65:339-349.

DOI

[32]
Liu H, Hu B, Wang Y et al., 2017. Two ultraviolet radiation datasets that cover China. Advances in Atmospheric Sciences, 34(7):805-815. (in Chinese)

DOI

[33]
Mariotte P, Meugnier C, Johnson D et al., 2013. Arbuscular mycorrhizal fungi reduce the differences in competitiveness between dominant and subordinate plant species. Mycorrhiza, 23(4):267-277.

DOI PMID

[34]
Martonne E, 1926. Une nouvelle fonction climatologique: L'indice d'aridité. La Meteorologie, 2449-2458.

[35]
Merckx V S F T, Gomes S I F, Wapstra M et al., 2017. The biogeographical history of the interaction between mycoheterotrophic Thismia (Thismiaceae) plants and mycorrhizal Rhizophagus (Glomeraceae) fungi. Journal of Biogeography, 44(8):1869-1879.

DOI

[36]
Mu S, Yang H, Li J et al., 2013. Spatio-temporal dynamics of vegetation coverage and its relationship with climate factors in Inner Mongolia, China. Journal of Geographical Sciences, 23(2):231-246.

DOI

[37]
Nielsen U N, Osler G H R, Campbell C D et al., 2010. The influence of vegetation type, soil properties and precipitation on the composition of soil mite and microbial communities at the landscape scale. Journal of Biogeography, 37(7):1317-1328.

DOI

[38]
Öpik M, Moora M, Liira J et al., 2006. Composition of root-colonizing arbuscular mycorrhizal fungal communities in different ecosystems around the globe. Journal of Ecology, 94(4):778-790.

DOI

[39]
Pinel-Alloul B, André A, Legendre P et al., 2013. Large-scale geographic patterns of diversity and community structure of pelagic crustacean zooplankton in Canadian lakes. Global Ecology and Biogeography, 22(7):784-795.

DOI

[40]
Prober S M, Leff J W, Bates S T et al., 2015. Plant diversity predicts beta but not alpha diversity of soil microbes across grasslands worldwide. Ecology Letters, 18(1):85-95.

DOI

[41]
Queloz V, Sieber T N, Holdenrieder O et al., 2011. No biogeographical pattern for a root-associated fungal species complex. Global Ecology and Biogeography, 20(1):160-169.

DOI

[42]
Sato K, Suyama Y, Saito M et al., 2005. A new primer for discrimination of arbuscular mycorrhizal fungi with polymerase chain reaction-denature gradient gel electrophoresis. Grassland Science, 51:179-181.

DOI

[43]
Schwarzott D, Schüßler A, 2001. A simple and reliable method for ssuRNA gene DNA extraction, amplification, and cloning from single am fungal spores. Mycorrhiza, 10(4):203-207.

DOI

[44]
Simon L, Lalonde M, Bruns T D, 1992. Specific amplification of 18S fungal ribosomal genes from vesicular-arbuscular endomycorrhizal fungi colonizing roots. Applied and Environmental Microbiology, 58:291-295.

DOI

[45]
Smith S E, Manjarrez M, Stonor R et al., 2015. Indigenous arbuscular mycorrhizal (AM) fungi contribute to wheat phosphate uptake in a semi-arid field environment, shown by tracking with radioactive phosphorus. Applied Soil Ecology, 96:68-74.

DOI

[46]
Smith S E, Read D, 2008. The symbionts forming arbuscular mycorrhizas. In: Smith S E, Read D (eds.). Mycorrhizal Symbiosis. 3rd ed. London: Academic Press, 13-41.

[47]
Soudzilovskaia N A, Douma J C, Akhmetzhanova A A et al., 2015. Global patterns of plant root colonization intensity by mycorrhizal fungi explained by climate and soil chemistry. Global Ecology and Biogeography, 24(3):371-382.

DOI

[48]
Steidinger B S, Bhatnagar J M, Vilgalys R et al., 2020. Ectomycorrhizal fungal diversity predicted to substantially decline due to climate changes in North American Pinaceae forests. Journal of Biogeography, 47(3):772-782.

DOI

[49]
Tang L Q, H L, B H et al., 2017. A dataset of reconstructed photosynthetically active radiation in China (1961-2014). China Scientific Data, 340-351. (in Chinese)

[50]
Treseder K K, 2004. A meta-analysis of mycorrhizal responses to nitrogen, phosphorus, and atmospheric CO2 in field studies. New Phytologist, 164(2):347-355.

DOI

[51]
Twieg B D, Durall D M, Simard S W, 2007. Ectomycorrhizal fungal succession in mixed temperate forests. New Phytologist, 176(2):437-447.

DOI

[52]
Vályi K, Mardhiah U, Rillig M C et al., 2016. Community assembly and coexistence in communities of arbuscular mycorrhizal fungi. The ISME Journal, 10(10):2341-2351.

DOI

[53]
van der Heijden M G A, Martin F M, Selosse M A et al., 2015. Mycorrhizal ecology and evolution: The past, the present, and the future. New Phytologist, 205(4):1406-1423.

DOI

[54]
Wang L, Yu H, Zhang Q et al., 2018. Responses of aboveground biomass of alpine grasslands to climate changes on the Qinghai-Tibet Plateau. Journal of Geographical Sciences, 28(12):1953-1964.

[55]
Wang Z, Tang Z, Fang J, 2009. The species-energy hypothesis as a mechanism for species richness patterns. Biodiversity Science, 17(6):613. (in Chinese)

DOI

[56]
Xu X, Wang N, Lipson D et al., 2020. Microbial macroecology: In search of mechanisms governing microbial biogeographic patterns. Global Ecology and Biogeography, 29:1870-1886.

DOI

[57]
Yang T, Adams J M, Shi Y et al., 2017. Soil fungal diversity in natural grasslands of the Tibetan Plateau: Associations with plant diversity and productivity. New Phytologist, 215(2):756-765.

DOI

[58]
Yin X, Song B, Dong W et al., 2010. A review on the eco-geography of soil fauna in China. Journal of Geographical Sciences, 20(3):333-346.

DOI

[59]
Yuan Q, Wu S, Dai E et al., 2017. NPP vulnerability of the potential vegetation of China to climate change in the past and future. Journal of Geographical Sciences, 27(2):131-142.

DOI

[60]
Zhang Y, Qi W, Zhou C et al., 2014. Spatial and temporal variability in the net primary production of alpine grassland on the Tibetan Plateau since 1982. Journal of Geographical Sciences, 24(2):269-287.

DOI

[61]
Zhou Z, Wang C, Luo Y, 2018. Response of soil microbial communities to altered precipitation: A global synthesis. Global Ecology and Biogeography, 27(9):1121-1136.

DOI

Outlines

/