
Journal of Geographical Sciences >
Evaluation of the carbon sequestration of Zhalong Wetland under climate change
|
Yu Chenglong (1973-), PhD, specialized in ecological meteorology. E-mail: nefuycl@163.com |
Received date: 2020-06-09
Accepted date: 2020-11-13
Online published: 2021-09-25
Supported by
Science Foundation of Heilongjiang Province (General Program)(D2018006)
National Natural Science Foundation of China(41665007)
National Natural Science Foundation of China(41165005)
CMA/Northeast China Innovation and Open Laboratory of Eco-meteorology(stqx2017zd01)
CMA/Northeast China Innovation and Open Laboratory of Eco-meteorology(stqx2018zd03)
Copyright
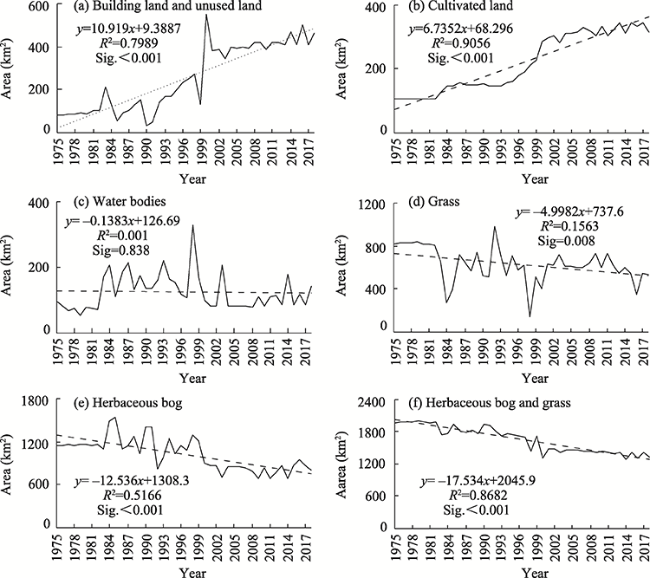
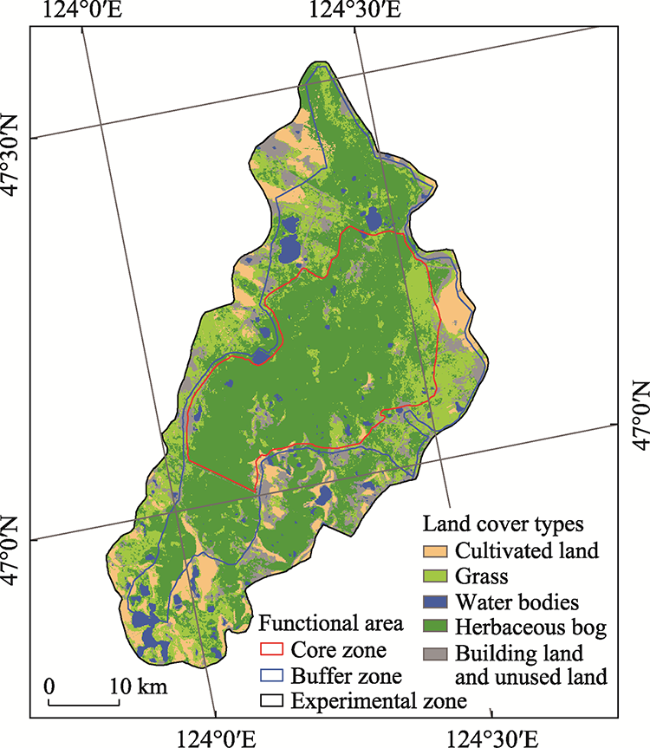
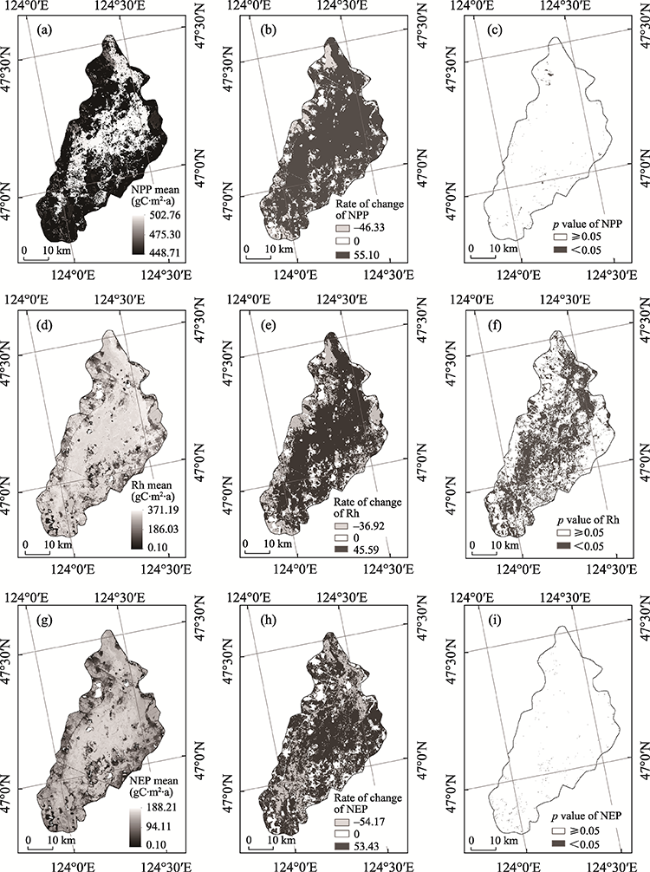
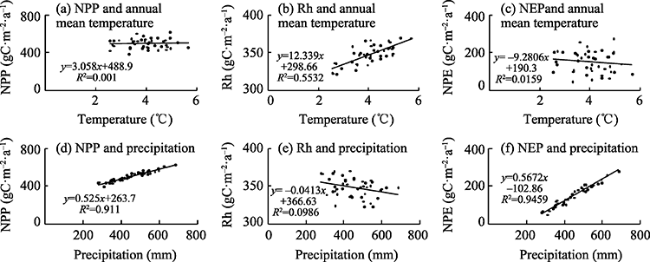
Wetland ecosystems are crucial to the global carbon cycle. In this study, the Zhalong Wetland was investigated. Based on remote sensing and meteorological observation data from 1975-2018 and the downscaled fifth phase of the coupled model intercomparison project (CMIP5) climate projection dataset from 1961-2100, the parameters of a net primary productivity (NPP) climatic potential productivity model were adjusted, and the simulation ability of the CMIP5 coupled models was evaluated. On this basis, we analysed the spatial and temporal variations of land cover types and landscape transformation processes in the Zhalong Nature Reserve over the past 44 years. We also evaluated the influence of climate change on the NPP of the vegetation, microbial heterotrophic respiration (Rh), and net ecosystem productivity (NEP) of the Zhalong Wetland and predicted the carbon sequestration potential of the Zhalong Wetland from 2019-2029 under the representative concentration pathways (RCP) 4.5 and RCP 8.5 scenarios. Our results indicate the following: (1) Herbaceous bog was the primary land cover type of the Zhalong Nature Reserve, occupying an average area of 1168.02 ± 224.05 km 2, equivalent to 51.84% of the total reserve area. (2) Since 1975, the Zhalong Nature Reserve has undergone a dry-wet-dry transformation process. Excluding several wet periods during the mid-1980s to early 1990s, the reserve has remained a dry habitat, with particularly severe conditions from 2000 onwards. (3) The 1975-2018 mean NPP, Rh, and NEP values of the Zhalong Wetland were 500.21±52.76, 337.59±10.80, and 162.62±45.56 gC·m-2·a-1, respectively, and an evaluation of the carbon balance indicated that the reserve served as a carbon sink. (4) From 1975-2018, NPP showed a significant linear increase, Rh showed a highly significant linear increase, while the increase in the carbon absorption rate was smaller than the increase in the carbon release rate. (5) Variations in NPP and NEP were precipitation-driven, with the correlations of NPP and NEP with annual precipitation and summer precipitation being highly significantly positive (P < 0.001); variations in Rh were temperature-driven, with the correlations of Rh with the average annual, summer, and autumn temperatures being highly significantly positive (P < 0.001). The interaction of precipitation and temperature enhances the impact on NPP, Rh and NEP. (6) Under the RCP 4.5 and RCP 8.5 scenarios, the predicted carbon sequestration by the Zhalong Wetland from 2019-2029 was 2.421 (± 0.225) × 1011 gC·a-1 and 2.407 (± 0.382) × 1011 gC·a-1, respectively, which were both lower than the mean carbon sequestration during the last 44 years (2.467 (± 0.950) × 1011 gC·a-1). Future climate change may negatively contribute to the carbon sequestration potential of the Zhalong Wetland. The results of the present study are significant for enhancing the abilities of integrated eco-meteorological monitoring, evaluation, and early warning systems for wetlands.
Key words: net ecosystem productivity; CMIP5; Zhalong Wetland
YU Chenglong , LIU Dan , ZHAO Huiying . Evaluation of the carbon sequestration of Zhalong Wetland under climate change[J]. Journal of Geographical Sciences, 2021 , 31(7) : 938 -964 . DOI: 10.1007/s11442-021-1879-z
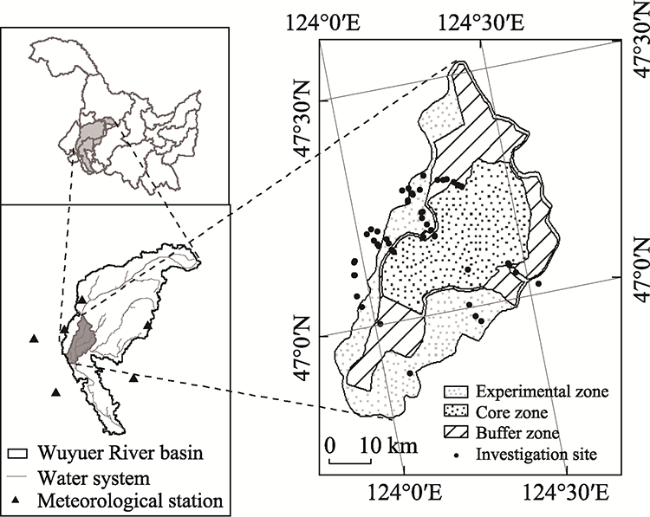
Figure 1 Location of the Zhalong Nature Reserve |
Table 1 Remote sensing classification accuracy of Zhalong Nature Reserve from 1975 to 2018 |
| Time | Classification accuracy (%) | Kappa coefficient | Time | Classification accuracy (%) | Kappa coefficient |
|---|---|---|---|---|---|
| 1975 | 90.44 | 0.8756 | 1997 | 90.80 | 0.8916 |
| 1976 | 90.46 | 0.8778 | 1998 | 90.10 | 0.8711 |
| 1977 | 90.48 | 0.8824 | 1999 | 91.02 | 0.8985 |
| 1978 | 90.83 | 0.8920 | 2000 | 92.15 | 0.9153 |
| 1979 | 91.15 | 0.9022 | 2001 | 91.46 | 0.9074 |
| 1980 | 91.61 | 0.9125 | 2002 | 90.98 | 0.8968 |
| 1981 | 91.65 | 0.9131 | 2003 | 92.19 | 0.9156 |
| 1982 | 90.36 | 0.8711 | 2004 | 91.01 | 0.8981 |
| 1983 | 90.43 | 0.8735 | 2005 | 91.25 | 0.9051 |
| 1984 | 90.47 | 0.8801 | 2006 | 90.55 | 0.8841 |
| 1985 | 90.85 | 0.8929 | 2007 | 90.46 | 0.8771 |
| 1986 | 90.86 | 0.8959 | 2008 | 91.57 | 0.9086 |
| 1987 | 90.88 | 0.8965 | 2009 | 92.41 | 0.9178 |
| 1988 | 91.10 | 0.9005 | 2010 | 90.01 | 0.8701 |
| 1989 | 91.21 | 0.9043 | 2011 | 91.48 | 0.9076 |
| 1990 | 91.45 | 0.9063 | 2012 | 92.26 | 0.9171 |
| 1991 | 91.00 | 0.8974 | 2013 | 92.35 | 0.9174 |
| 1992 | 91.04 | 0.8985 | 2014 | 91.57 | 0.9086 |
| 1993 | 91.17 | 0.9025 | 2015 | 91.99 | 0.9142 |
| 1994 | 91.19 | 0.9036 | 2016 | 92.22 | 0.9162 |
| 1995 | 91.23 | 0.9046 | 2017 | 91.56 | 0.9082 |
| 1996 | 91.44 | 0.9057 | 2018 | 90.80 | 0.8916 |
Figure 2 Taylor plot of meteorological simulation field data relative to meteorological observation field data around the Zhalong Nature Reserve from 1961 to 2018 (a. Maximum air temperature under RCP4.5; b. Maximum air temperature under RCP8.5; c. Minimum air temperature under RCP4.5; d. Minimum air temperature under RCP8.5; e. Precipitation under RCP4.5; f. Precipitation under RCP8.5) ( |
Table 2 Distance between model points and observation points with different meteorological elements and emission scenarios in the Wuyur River basin |
| Meteorological element | Emission scenarios | Pattern | Distance from model point to observation point | Meteorological element | Emission scenarios | Pattern | Distance from model point to observation point |
|---|---|---|---|---|---|---|---|
| Maximum temperature | RCP4.5 | CESM1-BGC | 1.06 | Minimum temperature | RCP4.5 | GFDL-ESM2G | 1.13 |
| CMCC-CM | 1.07 | GFDL-ESM2M | 1.13 | ||||
| GISS-E2-H | 1.04 | MIROC5 | 1.10 | ||||
| GISS-E2-H-CC | 1.03 | NorESM1-M | 1.10 | ||||
| GISS-E2-R | 1.03 | Multimodel set | 0.96 | ||||
| GFDL-ESM2M | 1.07 | RCP8.5 | CanESM2 | 1.12 | |||
| MIROC5 | 1.03 | GFDL-ESM2G | 1.11 | ||||
| Multimodel set | 0.79 | NorESM1-M | 1.13 | ||||
| RCP8.5 | CESM1-BGC | 1.12 | Multimodel set | 0.97 | |||
| FIO-ESM | 1.12 | Precipitation | RCP4.5 | CMCC-CM | 141.98 | ||
| GISS-E2-H | 1.11 | EC-EARTH | 141.53 | ||||
| GISS-E2-H-CC | 1.09 | GFDL-ESM2G | 141.72 | ||||
| GISS-E2-R | 1.08 | Multimodel set | 117.88 | ||||
| INM-CM4 | 1.13 | RCP8.5 | CESM1-BGC | 140.94 | |||
| Multimodel set | 0.86 | GFDL-ESM2G | 137.90 | ||||
| MPI-ESM-LR | 140.68 | ||||||
| Multimodel set | 116.40 |
Figure 3 NPP Box distribution obtained using the actual measurement, and the CASA, TEC, Beijing, Chikugo, Thornthwaite Memorial, Miami and Zhou Guangsheng-Zhang Xinshi models, represented by distributions 1-8 respectively |
Table 3 Comparison between measured values and calculated results of various models |
| NPP acquisition method | R | Sig. | Independent-sample t-test |
|---|---|---|---|
| CASA model | 0.229 | 0.049 | Sig.=0.969 |
| TEC model | -0.134 | 0.329 | Sig.=0.002 |
| Beijing model | 0.049 | 0.722 | Sig.<0.001 |
| Chikugo model | 0.055 | 0.692 | Sig.<0.001 |
| Thornthwaite Memorial model | 0.135 | 0.327 | Sig.<0.001 |
| Miami model | 0.134 | 0.329 | Sig.<0.001 |
| Zhou Guangsheng-Zhang Xinshi model | 0.117 | 0.396 | Sig.=0.077 |
Table 4 Landscape conversion coefficient for the Zhalong Nature Reserve |
| Conversion coefficient | Building land and unused land | Cultivated land | Grass | Herbaceous bog | Water bodies |
|---|---|---|---|---|---|
| Building land and unused land | 0 | 1 | 2 | 3 | 4 |
| Cultivated land | -1 | 0 | 1 | 2 | 3 |
| Grass | -2 | -1 | 0 | 1 | 2 |
| Herbaceous bog | -3 | -2 | -1 | 0 | 1 |
| Water bodies | -4 | -3 | -2 | -1 | 0 |
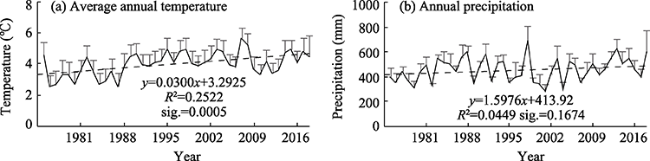
Figure 4 Variation of average annual temperature and annual precipitation in the Zhalong Nature Reserve from 1975 to 2018 |
Table 5 Variation of average temperature and precipitation in four seasons in the Zhalong Nature Reserve from 1975 to 2018 |
| Meteorological factors | Season | Mean value | Maximal value | Minimum value | Standard deviation | Propensity of change Air temperature (℃/10a), Precipitation (mm/10a) | P-value |
|---|---|---|---|---|---|---|---|
| Temperature (℃) | Spring | 5.88 | 3.40 | 8.54 | 1.30 | 0.33 | 0.031 |
| Summer | 21.67 | 19.65 | 23.49 | 0.85 | 0.30 | 0.002 | |
| Autumn | 4.36 | 2.13 | 6.43 | 1.13 | 0.35 | 0.008 | |
| Winter | -16.27 | -20.10 | -11.53 | 1.81 | 0.25 | 0.246 | |
| Precipitation (mm) | Spring | 57.31 | 16.47 | 135.56 | 29.28 | 3.80 | 0.279 |
| Summer | 317.10 | 159.56 | 526.33 | 85.01 | 7.89 | 0.441 | |
| Autumn | 69.01 | 20.40 | 194.45 | 35.73 | 2.86 | 0.506 | |
| Winter | 8.27 | 2.64 | 25.61 | 4.69 | 1.72 | 0.001 |
Figure 5 Change in the area occupied by various land cover types in the Zhalong Nature Reserve from 1975 to 2018 |
Figure 6 Distribution of land cover types with the largest frequency in the Zhalong Nature Reserve from 1975 to 2018 |
Figure 7 Landscape transformation range of the Zhalong Nature Reserve from 1975 to 2018 |
Table 6 Statistical characteristics of average annual NPP, Rh, and NEP in the Zhalong Wetland from 1975 to 2018 |
| Items | NPP | Rh | NEP |
|---|---|---|---|
| Mean value (gC·m-2·a-1) | 500.21 | 337.59 | 162.62 |
| Standard deviation (gC·m-2·a-1) | 52.76 | 10.80 | 45.56 |
| Linear regression correlation coefficient | 0.319 | 0.650 | 0.155 |
| Normalised tendency rate (gC·m-2·10a-1) | 0.06 | 0.14 | 0.003 |
| Sample number | 44 | 44 | 44 |
| Significance | 0.034 | <0.001 | 0.314 |
Figure 8 Spatial variation of NPP (a-c), Rh (d-f) and NEP (g-i) in the Zhalong Nature Reserve from 1975 to 2018 |
Table 7 Current (1975-2018) and future (2019-2029) carbon sequestration in the Zhalong Wetland |
| Time | Climate scenario | Carbon sequestration (1011 gC·a-1) | Standard deviation (1011 gC·a-1) |
|---|---|---|---|
| 1975-1979 | Reality | 2.096 | 0.772 |
| 1980-1989 | 3.126 | 1.024 | |
| 1990-1999 | 2.811 | 0.917 | |
| 2000-2009 | 1.899 | 0.793 | |
| 2010-2018 | 2.404 | 0.737 | |
| 2019-2029 | RCP4.5 | 2.421 | 0.225 |
| RCP8.5 | 2.407 | 0.382 |
Figure 9 Relationship between NPP, Rh, NEP, and meteorological factors in the Zhalong Wetland from 1975 to 2018 |
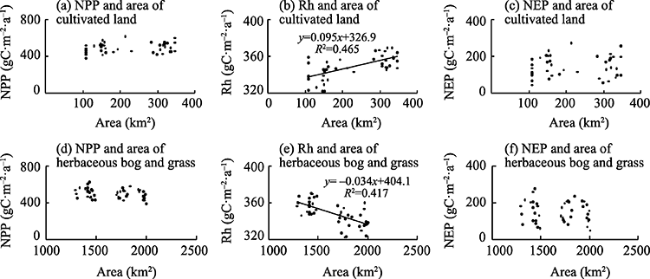
Figure 10 Relationship between NPP, Rh, NEP and land cover types in Zhalong Wetland from 1975 to 2018 |
Table 8 Effects of interaction of environmental factors on carbon exchange components in Zhalong Nature Reserve |
| Dominant interaction | NPP | Rh | NEP |
|---|---|---|---|
| Dominant interaction 1 q | Temperature×Precipitation 0.881 | Temperature×Precipitation 0.218 | Temperature×Precipitation 0.854 |
| Dominant interaction 2 q | Precipitation×Land use type 0.862 | Precipitation×Land use type 0.116 | Precipitation×Land use type 0.842 |
| Dominant interaction 3 q | Precipitation 0.850 | Temperature×Land use type 0.106 | Precipitation 0.837 |
| Dominant interaction 4 q | Temperature×Land use type 0.008 | Temperature 0.104 | Temperature×Land use type 0.016 |
| Dominant interaction 5 q | Temperature 0.005 | Precipitation 0.088 | Temperature 0.015 |
| Dominant interaction 6 q | Land use type 0.002 | Land use type 0.001 | Land use type 0.001 |
The value range of q was [0, 1], and the closer the value of q was to 1, the stronger the dominant driving effect of the impact factors was. The number of samples involved in the calculation was n = 15759. |
Table 9 Comparison of results of heterotrophic soil respiration |
| Land cover type | Method | Microbial heterotrophic respiration (μmol·m-2·s-1) | Research area |
|---|---|---|---|
| Farmland ecosystem | Closed-chamber soil carbon flux system (LI-8100) | March to November: 0.79-1.20 | Shaanxi Province (Zhang et al., 2019) |
| Root biomass extrapolation | Growing season: 1.11-1.96 | Liaoning Province (Han et al., 2009) | |
| Static chamber method | Full year: 0.58 ± 0.08 for waterlogged fields, 0.75 ± 0.10 for dry fields | Sanjiang Plain, Heilongjiang Province (Hao et al., 2007) | |
| Model calculations | Growing season: 0.90-2.42 | Present study | |
| Model calculations | Full year: 0.12-2.42 | Present study | |
| Forest ecosystem | Closed-chamber alkali absorption method | Full year: 0.59-1.37 | Fujian Province (Yang et al., 2006) |
| Closed-chamber soil carbon flux system (LI-8100) | Full year: 0.82-7.11 | Fujian Province (Yang et al., 2018) | |
| Alpine meadow | Soil respiration chamber (Li6400-09) | Growing season: 0.47-0.63 | Tibetan Plateau (Zhang et al., 2006) |
| Static chamber method | Growing season: 0.95-2.53 | Tibetan Plateau (Hu et al., 2008) | |
| Grassland | Root biomass extrapolation | Growing season: 1.54-4.42 | Inner Mongolia (Shi et al., 2014) |
| Wetland ecosystem | Indoor cultivation, gas chromatography | Full year: 0.41 ± 0.22 for the deposition promotion zone, 0.07 ± 0.02 for the natural state | Chongming Island, Shanghai (Tang et al., 2010) |
| Model calculations | Growing season: 0.50-3.67 | Present study | |
| Model calculations | Full year: 0.05-3.67 | Present study |
| [1] |
|
| [2] |
|
| [3] |
|
| [4] |
|
| [5] |
|
| [6] |
|
| [7] |
|
| [8] |
|
| [9] |
|
| [10] |
|
| [11] |
|
| [12] |
|
| [13] |
|
| [14] |
|
| [15] |
|
| [16] |
|
| [17] |
|
| [18] |
|
| [19] |
IPCC, 2018. Special Report on Global Warming of 1.5℃ (SR15). Cambridge: Cambridge University Press, 785.
|
| [20] |
|
| [21] |
|
| [22] |
|
| [23] |
|
| [24] |
|
| [25] |
|
| [26] |
|
| [27] |
|
| [28] |
|
| [29] |
|
| [30] |
|
| [31] |
|
| [32] |
|
| [33] |
|
| [34] |
|
| [35] |
|
| [36] |
|
| [37] |
|
| [38] |
|
| [39] |
|
| [40] |
|
| [41] |
|
| [42] |
|
| [43] |
|
| [44] |
|
| [45] |
|
| [46] |
|
| [47] |
|
| [48] |
|
| [49] |
|
| [50] |
|
| [51] |
|
| [52] |
|
| [53] |
|
| [54] |
|
| [55] |
|
| [56] |
|
| [57] |
|
| [58] |
|
| [59] |
|
/
| 〈 |
|
〉 |
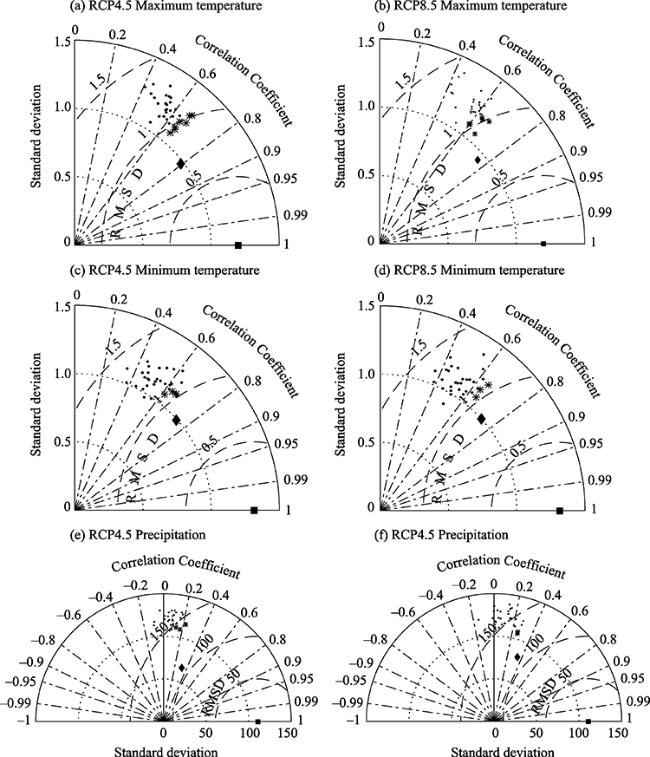
 ,
,  , and
, and  symbolise pattern-point data, where
  is the mode-set data, while n symbolises the observation-point data.)
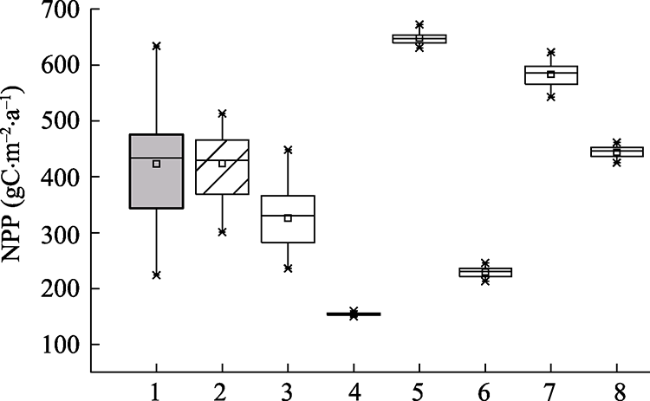
