
Journal of Geographical Sciences >
Visual method of analyzing COVID-19 case information using spatio-temporal objects with multi-granularity
|
Chen Yunhai (1987-), PhD, specialized in spatial information modeling and visualization. E-mail: xwliky@qq.com |
Received date: 2020-10-21
Accepted date: 2021-04-13
Online published: 2021-09-25
Supported by
National Key Research and Development Program of China(2016YFB0502300)
Copyright
Coronavirus disease 2019 (COVID-19) is continuing to spread globally and still poses a great threat to human health. Since its outbreak, it has had catastrophic effects on human society. A visual method of analyzing COVID-19 case information using spatio-temporal objects with multi-granularity is proposed based on the officially provided case information. This analysis reveals the spread of the epidemic, from the perspective of spatio-temporal objects, to provide references for related research and the formulation of epidemic prevention and control measures. The case information is abstracted, descripted, represented, and analyzed in the form of spatio-temporal objects through the construction of spatio-temporal case objects, multi-level visual expressions, and spatial correlation analysis. The rationality of the method is verified through visualization scenarios of case information statistics for China, Henan cases, and cases related to Shulan. The results show that the proposed method is helpful in the research and judgment of the development trend of the epidemic, the discovery of the transmission law, and the spatial traceability of the cases. It has a good portability and good expansion performance, so it can be used for the visual analysis of case information for other regions and can help users quickly discover the potential knowledge this information contains.
CHEN Yunhai , JIANG Nan , CAO Yibing , YANG Zhenkai , ZHAO Xinke . Visual method of analyzing COVID-19 case information using spatio-temporal objects with multi-granularity[J]. Journal of Geographical Sciences, 2021 , 31(7) : 1059 -1081 . DOI: 10.1007/s11442-021-1885-1
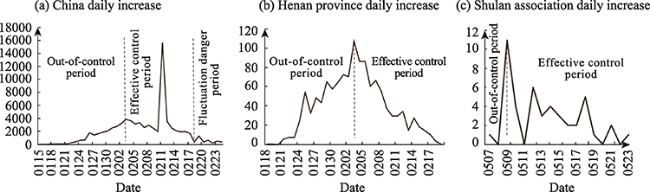
Figure 1 Trend chart of the daily increase in COVID-19 cases in 2020 (a. Daily increase in China’s COVID-19 cases in 2020; b. Daily increase in Henan’s COVID-19 cases in 2020; c. Daily increase in COVID-19 cases associated with Shulan in 2020) |
Table 1 Reasoning results of the infectious relationships of the Shulan cases |
| Case | Source | Case | Source | Case | Source | Case | Source | Case | Source |
|---|---|---|---|---|---|---|---|---|---|
| 1 | / | 11 | 2 | 21 | 11 | 31 | 22 | 41 | 22 |
| 2 | 1 | 12 | 8 | 22 | 15 | 32 | 17 | 42 | 40 |
| 3 | 1 | 13 | 10 | 23 | 11 | 33 | 28 | 43 | 15 |
| 4 | 1 | 14 | 2 | 24 | 16 | 34 | 31 | 44 | 43 |
| 5 | 1 | 15 | 10 | 25 | 17 | 35 | 22 | 45 | 43 |
| 6 | 1 | 16 | 10 | 26 | 4 | 36 | 39 | / | / |
| 7 | 1 | 17 | 10 | 27 | 24 | 37 | 39 | / | / |
| 8 | 1 | 18 | 10 | 28 | 11 | 38 | 4 | / | / |
| 9 | 2 | 19 | 10 | 29 | 17 | 39 | 2, 10 | / | / |
| 10 | 2 | 20 | 13 | 30 | 15 | 40 | 10 | / | / |
1-45 are the codes of the associated Shulan cases; and a default value of “/” indicates no data |
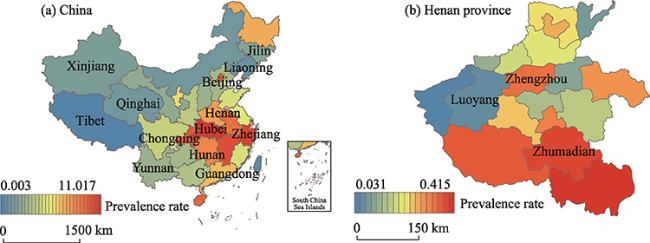
Figure 2 Prevalence of COVID-19 in China (a. Prevalence of COVID-19 in China on February 25, 2020; b. Prevalence of COVID-19 in Henan province, China, on February 20, 2020. This is based on the standard map production with map approval number GS (2019) No.1696 on the standard map service website of the Ministry of Natural Resources, China; the base map has not been modified; and the relevant source of the statistical data is the 2019 Statistical Yearbook of China (CD-ROM version).) |
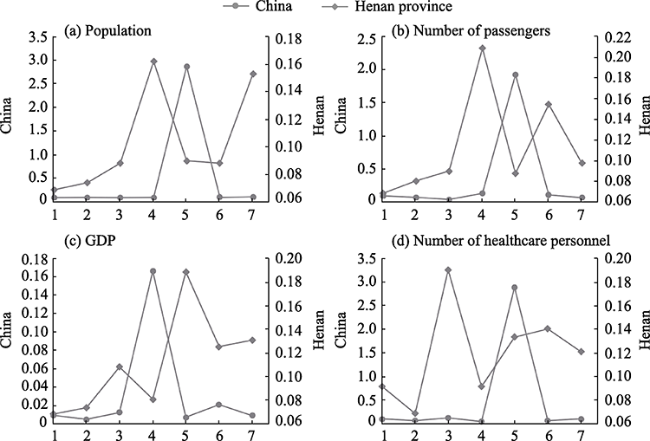
Figure 3 Spatial distributions of the impact factors of COVID-19 in China (a. Spatial distribution of China’s population in 2019; b. Spatial distribution of China’s number of passengers in 2019; c. Spatial distribution of China’s GDP in 2019; d. Spatial distribution of China’s number of healthcare personnel in 2019. This is based on the standard map production with map approval number GS (2019) No.1696 on the standard map service website of the Ministry of Natural Resources, China, and the base map has not been modified.) |
Table 2 Classification of the impact factors of COVID-19 in China |
| Level | Population (104 people) | Number of passengers (108 people) | Number of healthcare personnel (104 people) | GDP (1012 yuan) |
|---|---|---|---|---|
| 1 | < 934.0 | < 1.75 | < 13.25 | < 0.82 |
| 2 | < 2704.0 | < 3.20 | < 27.27 | < 2.04 |
| 2 | < 3941.0 | < 4.81 | < 33.09 | < 3.03 |
| 4 | < 4926.0 | < 7.16 | < 42.70 | < 4.11 |
| 5 | < 6899.0 | < 11.04 | < 62.40 | < 5.62 |
| 6 | < 8341.0 | < 14.21 | < 74.63 | < 7.65 |
| 7 | > 8341.0 | > 14.21 | > 74.63 | > 7.65 |
The relevant statistical data source is the 2019 Statistical Yearbook of China (CD-ROM version), in which Hong Kong and Macao have no statistical indicators of passengers, and the statistics used were the total number of people entering and leaving the region at the end of the year |
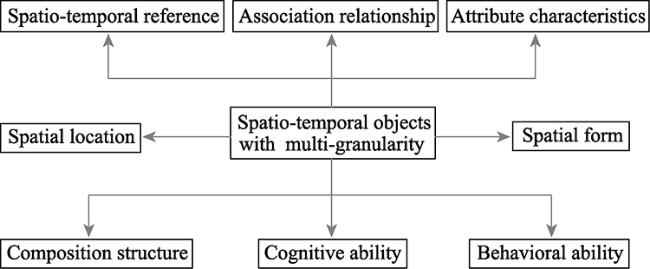
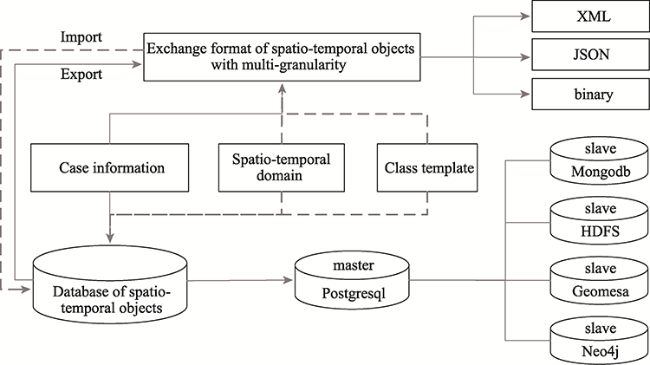
Figure 4 Formal representation of the spatio-temporal objects with multi-granularity |
Figure 5 Modeling process of the suspected infection relationship of the cases |
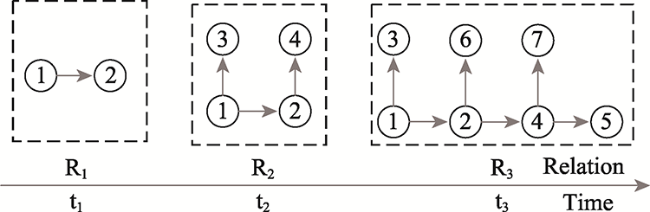
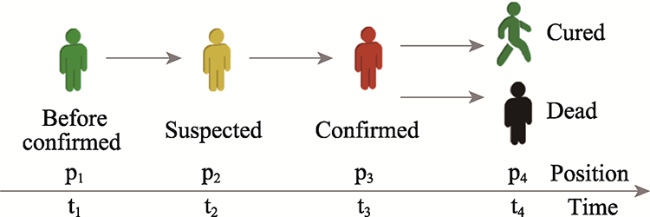
Figure 6 Example of the process of spatio-temporal modeling of the dynamic characteristics of the cases |
Figure 7 Object-oriented processing flow of case information |
Table 3 Multi-level visual expressions of the case information |
| Expression level | Expression method |
|---|---|
| Macro-level | Spatio-temporal process simulation (attribute), three-dimensional dynamic thematic map |
| Meso-level | Spatio-temporal process simulation (spatial form, trajectory, attribute) |
| Micro-level | Spatio-temporal process simulation (spatial form, trajectory, attribute, infection link), dynamic thermodynamic map |
Figure 8 View design involved in the case information visualization |
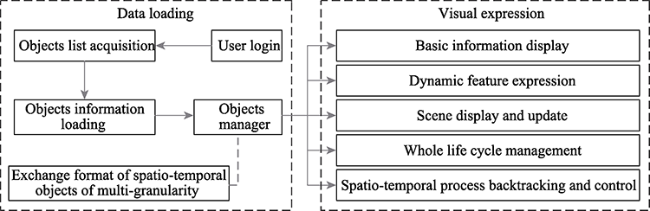
Figure 9 Flow of the visualized expression of case information |
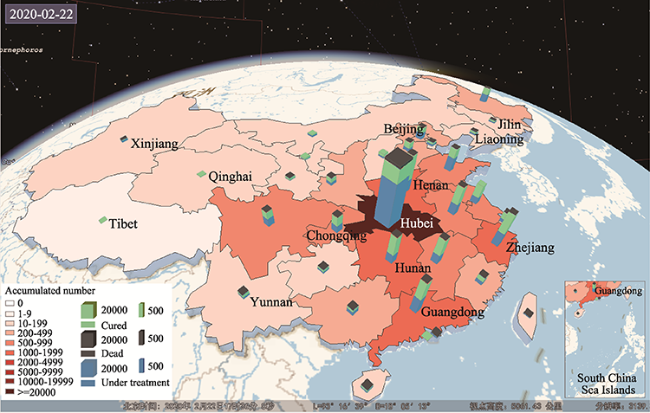
Figure 10 Visual analysis of case information at the macro-level |
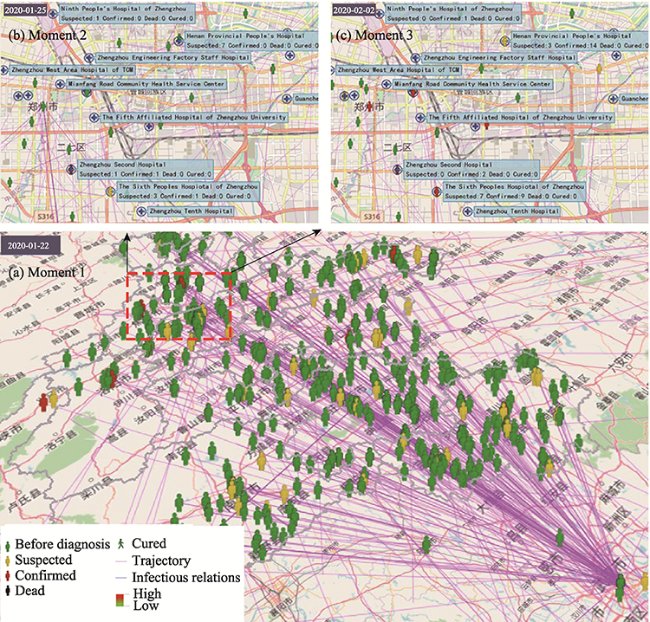
Figure 11 Visual analysis of the case information at the meso-level. (a. Visual analysis of cases in Henan province on January 22, 2020; b. Local amplification effect of visual analysis results of Henan cases on January 25, 2020; c. Local amplification effect of visual analysis results of Henan cases on February 2, 2020) |
Figure 12 Visual analysis of the case information at the micro-level |
Table 4 Results of Global Morin’s I for the prevention of COVID-19 in China |
| Region | Value | Date | ||||||
|---|---|---|---|---|---|---|---|---|
| 2020-01-20 | 2020-01-25 | 2020-01-30 | 2020-02-05 | 2020-02-10 | 2020-02-15 | 2020-02-20 | ||
| China | Moran’s I | -0.06 | -0.02 | -0.03 | -0.04 | -0.05 | -0.05 | -0.05 |
| Z value | -1.02 | 0.19 | -0.01 | -0.34 | -0.48 | -0.67 | -0.70 | |
| P value | 0.31 | 0.85 | 1.00 | 0.73 | 0.64 | 0.50 | 0.48 | |
| Henan province | Moran’s I | 0.01 | -0.05 | 0.02 | 0.14 | 0.11 | 0.12 | 0.11 |
| Z value | 0.74 | 0.03 | 0.41 | 1.22 | 1.12 | 1.18 | 1.17 | |
| P value | 0.46 | 0.98 | 0.68 | 0.22 | 0.26 | 0.24 | 0.24 | |
The statistical inferences in the table are based on the 999 random permutations proposed by Anselin (1995) |
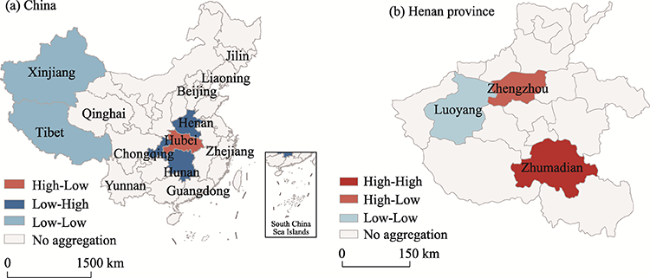
Figure 13 Local spatial clustering characteristics of the prevalence of COVID-19 in China (a. Local spatial clustering characteristics of the prevalence of COVID-19 in China on February 25, 2020; b. Local spatial clustering characteristics of the prevalence of COVID-19 in Henan province, China, on February 20, 2020. This is based on the standard map production with map approval number GS (2019) No.1696 on the standard map service website of the Ministry of Natural Resources, China, and the base map has not been modified.) |
Table 5 Results for the factor detector and interaction detector |
| Region | Impact factors | GDP | Number of passengers | Number of healthcare personnel | Population |
|---|---|---|---|---|---|
| China | GDP | 0.119942 | |||
| Number of passengers | 0.335308↑ | 0.143713 | |||
| Number of healthcare personnel | 0.505342↑ | 0.34431↑↑ | 0.238725 | ||
| Population | 0.999561↑ | 0.510934↑ | 0.34469↑↑ | 0.233914 | |
| Henan province | GDP | 0.272791 | |||
| Number of passengers | 0.560397↑↑ | 0.387768 | |||
| Number of healthcare personnel | 0.905541↑ | 0.952972↑ | 0.230124 | ||
| Population | 0.762325↑ | 0.751544↑ | 0.394333↑↑ | 0.211114 |
“↑” indicates nonlinear enhancement of factor interaction; and “↑↑” indicates bilinear enhancement |
Figure 14 The results of the risk detector |
| [1] |
|
| [2] |
|
| [3] |
|
| [4] |
|
| [5] |
|
| [6] |
|
| [7] |
Disease Control and Prevention Bureau of China (DCPBC), 2020. COVID-19 prevention and control plan (sixth edition). https://china.huanqiu.com/article/9CaKrnKpMVo. (in Chinese)
|
| [8] |
|
| [9] |
|
| [10] |
|
| [11] |
Health Commission of Henan Province (HCHP), 2020. Make every effort to prevent and control New Coronavirus pneumonia epidemic situation. http://wsjkw.henan.gov.cn/zt/2020/778686/index.html. (in Chinese)
|
| [12] |
Health Commission of Liaoning Province (HCLP), 2020. Make every effort to prevent and control New Coronavirus pneumonia epidemic situation. http://wsjk.ln.gov.cn/wst_zdzt/xxgzbd/. (in Chinese)
|
| [13] |
|
| [14] |
|
| [15] |
|
| [16] |
|
| [17] |
|
| [18] |
|
| [19] |
|
| [20] |
|
| [21] |
|
| [22] |
|
| [23] |
|
| [24] |
National Health Commission of China (NHCC), 2020. Notes on continuous stochastic phenomena. http://www.nhc.gov.cn/xcs/xxgzbd/gzbd_index.shtml. (in Chinese)
|
| [25] |
People’s Government of Jilin Province (PGJP), 2020. Fight against COVID-19: Jilin is in action. http://www.jl.gov.cn/szfzt/jlzxd/. (in Chinese)
|
| [26] |
|
| [27] |
Tencent, 2020. Activity track of confirmed patients with COVID-19. https://xw.qq.com/act/fytrace. (in Chinese)
|
| [28] |
|
| [29] |
|
| [30] |
|
| [31] |
|
| [32] |
|
| [33] |
|
| [34] |
|
| [35] |
|
/
| 〈 |
|
〉 |


