Research Articles

Spatiotemporal patterns of the daily relative risk of COVID-19 in China

  • CHENG Changxiu , 1, 2, 3, 4 ,
  • JIANG Yifan 1, 2, 3 ,
  • SONG Changqing , 1, 3, * ,
  • SHEN Shi 1, 2, 3 ,
  • WU Yunfeng 3 ,
  • ZHANG Tianyuan 1, 2, 3
Expand
  • 1. State Key Laboratory of Earth Surface Processes and Resource Ecology, Beijing Normal University, Beijing 100875, China
  • 2. Key Laboratory of Environmental Change and Natural Disaster, Beijing Normal University, Beijing 100875, China
  • 3. Center for Geodata and Analysis, Faculty of Geographical Science, Beijing Normal University, Beijing 100875, China
  • 4. National Tibetan Plateau Data Center, Beijing 100101, China
* Song Changqing, PhD and Professor, E-mail:

Cheng Changxiu, Professor, specialized in spatiotemporal data analysis. E-mail:

Received date: 2021-03-25

  Accepted date: 2021-05-14

  Online published: 2021-09-25

Supported by

National Key Research and Development Plan of China(2019YFA0606901)

The Second Tibetan Plateau Scientific Expedition and Research Program (STEP)(2019QZKK0608)

The Strategic Priority Research Program of the Chinese Academy of Sciences(XDA23100303)

The Fundamental Research Funds for the Central Universities(2019NTST01)

Copyright

Copyright reserved © 2021.

Abstract

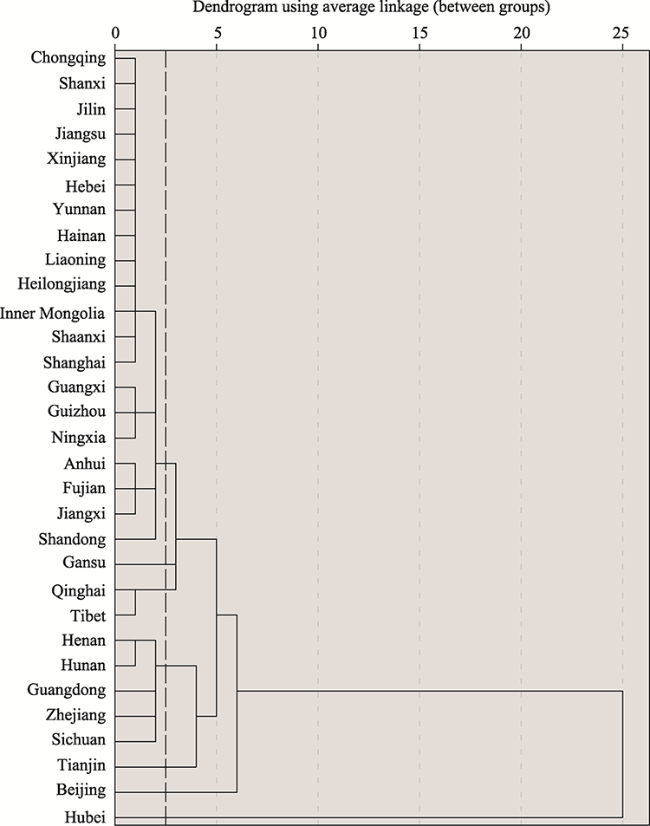
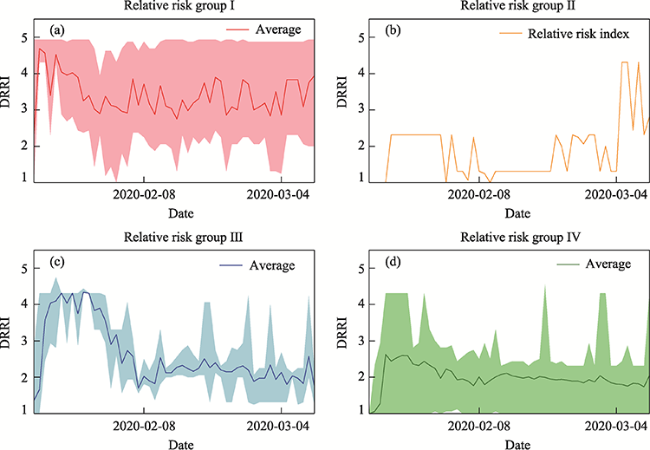
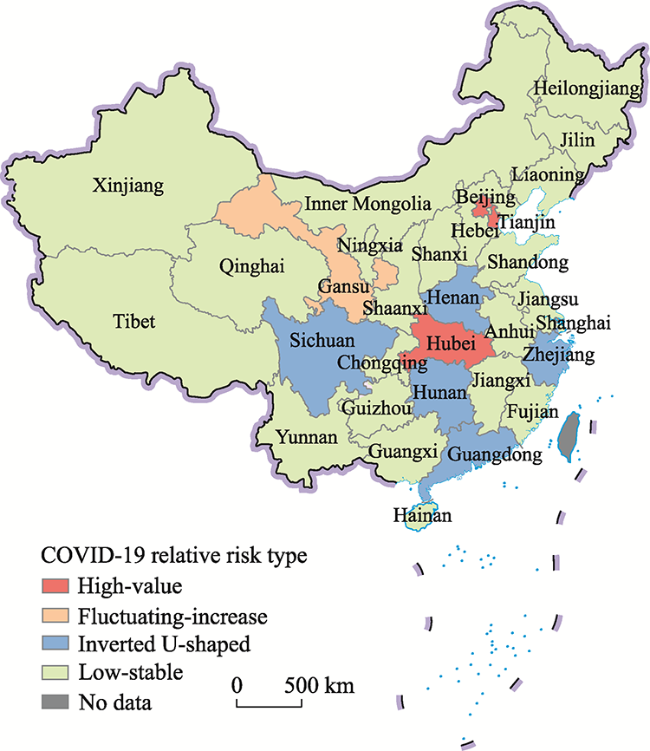
The coronavirus disease 2019 (COVID-19) pandemic continues to threaten lives and the economy around the world. Estimating the risk of COVID-19 can help in predicting spreading trends, identifying risk areas, and making public health decisions. In this study, we proposed a comparative risk assessment method to estimate comprehensive and dynamic COVID-19 risks by considering the pandemic severity and the healthcare system pressure and then employing the z-order curve and fractal theory. We took the COVID-19 cases from January 19-March 10, 2020 in China as our research object. The results and analysis revealed that (1) the proposed method demonstrated its feasibility to assess and illustrate pandemic risk; (2) the temporal patterns of the daily relative risk indices of 31 provinces were clustered into four groups (high-value, fluctuating-increase, inverted U-shaped, and low-stable); (3) the spatial distribution of the relative pandemic risk indicated a significant circular pattern centered on Hubei Province; and (4) healthcare system capacity is the key to reducing relative pandemic risk, and cases imported from abroad should be given more attention. The methods and results of this study will provide a methodological basis and practical guidance for regional pandemic risk assessment and public health decision-making.

Cite this article

CHENG Changxiu , JIANG Yifan , SONG Changqing , SHEN Shi , WU Yunfeng , ZHANG Tianyuan . Spatiotemporal patterns of the daily relative risk of COVID-19 in China[J]. Journal of Geographical Sciences, 2021 , 31(7) : 1039 -1058 . DOI: 10.1007/s11442-021-1884-2

1 Introduction

Since coronavirus disease 2019 (COVID-19) cases first appeared in Wuhan, China, on December 31, 2019, the pandemic has thoroughly impacted and changed China, as well as the world (Dong et al., 2020). Globally, there were 162,184,263 COVID-19 cumulative cases and 3,364,446 COVID-19 cumulative deaths as of May 16, 2021 (WHO, 2021). Meanwhile, the spread of the COVID-19 pandemic in China has been successfully controlled due to the rigorous implementation of public health measures, such as isolation, quarantine, social distancing, case screening, travel restriction, and community containment (Chinazzi et al., 2020; Gu et al., 2020; Kraemer et al., 2020; Maier et al., 2020; Pan et al., 2020; Tian et al., 2020). On March 18, 2020, for the first time since the start of the pandemic, all provinces in China recorded zero new local confirmed or suspected cases of COVID-19. The Chinese National Health Commission reported zero new locally-transmitted cases across China for the last 15 days of August 2020.
With the pandemic under control and the gradual recovery of social and economic activities now occurring in China, the public health strategy for controlling the pandemic is entering a new phase (Zhao et al., 2020). The Chinese government has launched a plan to advance the resumption of work and production based on local health risks. This plan requires administrations to implement precise, fine-scale, and local public health strategies to determine the restriction or restoration of activities. As a fundamental and significant reference indicator, COVID-19 pandemic risk assessment will help to predict the trends, identify risk areas, and affect the decision-making processes of public health strategies (Wang et al., 2020; Watson et al., 2020).
Many researchers have assessed the risk of COVID-19 using various approaches. The risk of COVID-19 assessed using a biological and medical approach is essential for taking appropriate public health measures and informing correct personal protection guidance. The risk assessment via a biological approach evaluates the given pathogen (i.e., SARS-COV-2, the causative agent of COVID-19) and its interaction with humans and the environment in a research setting (Schroder et al., 2020). The personal risk of patients was evaluated by statistically analyzing COVID-19 prevalence, personal clinical characteristics, and patient presentation (Nolan et al., 2020; Yang et al., 2020). The results of biological and medical risk assessment assist in identifying high-risk groups (Chatterjee et al., 2020), protecting medical staff (Nichols et al., 2020; Ran et al., 2020), improving treatment plans (Grassia et al., 2020; Weiss et al., 2020; Yu et al., 2020), and providing the biological and medical information necessary to make healthcare decisions (Schroder, 2020).
COVID-19 pandemic risk assessment via the epidemiological approach illustrates the contagion, development, and distribution scenarios of the pandemic, which is also critical and more practical for administrations as well decision-makers when developing large-scale public health strategies. In terms of evaluation factors, pandemic risk assessment via the epidemiological approach can be classified into three types: (1) only considering confirmed cases; (2) considering both confirmed cases and population flow, and (3) considering confirmed cases, population flow, and socioeconomic factors.
COVID-19 risk only considering confirmed cases was often employed in the early phase of the COVID-19 pandemic. In the beginning, the Wuhan metropolitan area was the epicenter of COVID-19 in China, exhibiting a high incidence rate (Yang et al., 2020). The risk of COVID-19 can be evaluated using the basic regeneration number (R0). Based on the infection cases in Wuhan, a compartmental method, the Susceptible-Exposed-Infectious- Removed model (Pastor-Satorras et al., 2020), was employed that simulates the R0 as well as the epidemic tendency (Kucharski et al., 2020; Liu et al., 2020; Read et al., 2020; Zhou et al., 2020). The number of confirmed cases itself implies the pandemic risk as well. The potential confirmed cases could also be estimated simply through Boltzmann function-based regression and daily cumulative confirmed cases (Fu et al., 2020). Using network analysis and daily confirmed cases, the pandemic risk of COVID-19 has been directly illustrated according to the connectedness degree of different regions (So et al., 2020). In order to assess the daily pandemic risk of megacities, a risk index was presented using the analytic hierarchy process based on the new confirmed cases over the past seven days, cumulative confirmed cases, clustered pandemic cases, and incidence rates in neighborhoods (Zhao et al., 2020). This risk assessment reflects both the apparent and direct pandemic risks, although the underlying risk is impacted by population flow.
The final category of risk assessment considers confirmed cases and socioeconomic factors. Using this approach, the potential pandemic risk is assessed. For example, the specific spatial potential risk zones were mapped by employing the ecological niche model to synthesize the infected cases and socioeconomic factors (e.g., population, densely populated areas, hospitals, and transportation) (Boldog et al., 2020). A comprehensive risk index, which integrates prevalence, mortality, transmission rates, resident population, GDP, and risk areas, was proposed and deployed to evaluate the risk of COVID-19 in China and Hubei Province from January 24-February 18, 2020 (Yuan et al., 2020). Another sophisticated method for assessing risk in the context of urban lockdown utilized the multicriteria approach, with these three criteria: (1) the hazard indicated by infected cases, suspected population, and personal mobility; (2) the vulnerability indicated by population density and densely populated areas; and (3) the exposure indicated by the age of inhabitants (Sangiorgio et al., 2020). After work resumed and schools reopened in China (outside Hubei), the risk of COVID-19 resurgence was estimated by modeling the new confirmed cases, population, and number of enterprises (Zhao et al., 2020). Pandemic risk, which combines pandemic data and socioeconomic factors, helps to identify the potential risk of a given location (Requia et al., 2020). Due to the static nature of socioeconomic factors, however, the monitoring of actual dynamic risk changes using this method is flawed.
In summary, the COVID-19 pandemic lacks a dynamic and comprehensive risk assessment method that reflects the improvement of the healthcare system. Risk that is assessed using confirmed cases and/or population flow is indeed dynamic, yet lacks the function of healthcare systems. In contrast, the risk regarding COVID-19 assessed by leveraging the pandemic data and socioeconomic factors (including some healthcare system statistics) recognizes the effect of the healthcare system but is latent and static. Therefore, the actual risk may either be higher than the estimated value, meaning that there is local spread in neighborhoods, or lower than the estimated value, indicating better implementation of public health measures (Jia et al., 2020). Although the aforementioned risk assessments are essential and helpful for making public health policies and strategies, they are oblivious to the rapid development and changes of the pandemic, as well as the concurrent deepening understanding of the pandemic and the continuous improvement of treatment plans. Hence, there is a great need for a new method that dynamically reflects both the pandemic and the healthcare system.
To satisfy this need, we proposed a new relative pandemic risk index, which simultaneously considers both the pandemic severity and the treatment pressure on the healthcare system in order to comprehensively assess COVID-19 risk. That risk is directly proportional to both pandemic severity and healthcare system pressure (HSP) (Fan et al., 2020). The incidence rate of COVID-19 characterizes the pandemic severity, which is impacted by confirmed cases, population flow, and traffic accessibility. The higher the severity, the larger the risk. The non-recovery rate of COVID-19 characterizes the HSP. If new cases swarm into hospitals and exceed the medical treatment capacity, the healthcare system will face enormous pressure and risks (Requia et al., 2020). Therefore, we utilized daily relative severity and daily HSP as two-dimensional coordinate axes. Through z-order curve and fractal theory encoding of the daily relative risk index, the index can reflect the relationship between severity and HSP comprehensively and accurately. With the proposed new risk index, pandemic control and prevention departments can dynamically and practically assess pandemic risk and identify risk areas.
The remainder of this manuscript is organized as follows. Section 2 first provides a comprehensive diagram introducing the construction of the risk index and its application analysis. The details of the risk index are described in this section as well. In Section 3, we use China as an example to present the risk assessment results of the proposed risk index. In Section 4, we compare this index to other similar indices and describe its limitations. We also provide some advice regarding the control of COVID-19 in China. In the final section, we present our conclusions and suggest potential future research possibilities.

2 Methods

2.1 Case study description

The present case study chose January 19-March 10, 2020 as the study period because the first wave of the COVID-19 pandemic developed in China during this time. On January 19, 2020, COVID-19 was first diagnosed outside Hubei (CCDC, 2020). Subsequently, with the efficient implementation of public health interventions, the domestic pandemic was gradually controlled. On March 10, mobile cabin hospitals in Wuhan were closed (CGTN, 2020), indicating that the COVID-19 pandemic was under control in China. During the study period, of the 81,598 confirmed COVID-19 cases in China, 61,726 patients recovered, while 3165 died.
The data used for the relative risk assessment consists of COVID-19 pandemic data and demographic data. The specific pandemic data include the number of daily existing confirmed cases, the number of daily new confirmed cases, the number of daily new recovered cases, and the number of daily new deaths at the provincial level in China. The COVID-19 Epidemic Spatiotemporal Dataset (Bao et al., 2020) collected pandemic data from the websites of the national and provincial Health Commissions. In addition, the provincial demographic data source was from the 2019 China Statistical Yearbook.

2.2 Flow chart of the relative risk assessment

The flow chart of the relative risk assessment of COVID-19 consists of three steps (Figure 1). In the first step, namely data collection, the daily provincial pandemic data and provincial demographic data are obtained from the COVID-19 Epidemic Spatiotemporal Dataset and 2019 Statistical Yearbook. In the second step, namely indicator calculation, a daily relative risk index (DRRI) is then constructed according to a series of indicators based on the z-order curve encoding method and fractal theory. The detailed process of constructing the DRRI will be described further in the following section. Finally, according to the resultant DRRIs in target regions, the temporal trend of the risk is analyzed using the hierarchical clustering method, and the high-risk areas are then identified and visualized.
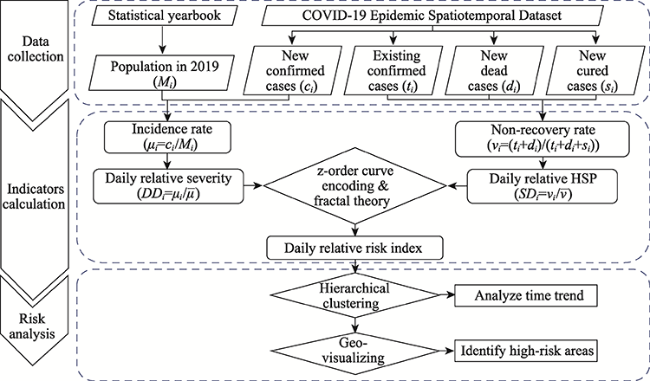
Figure 1 Flow chart of daily relative risk index construction and analysis

2.3 Construction of the daily relative risk index

The daily relative risk index (DRRI) is based on the daily relative severity and the daily relative healthcare system pressure. This index comprehensively reflects the relationship between these parameters and the risk of the COVID-19 pandemic in a specific study area.
2.3.1 Daily relative severity
The daily relative severity of COVID-19 depicts the local pandemic severity relative to the overall pandemic severity each day. The mathematical definition of daily relative severity is the ratio of the daily local incidence rate to the daily overall average incidence rate. Compared with the daily incidence rate of COVID-19, the relative daily severity eliminates the temporal trend and reflects the relative increase or improvement of the pandemic severity in each region. The higher the relative severity, the higher the relative risk. The calculation of the relative daily severity is expressed in Equations (1)-(3).
${{\mu }_{i}}=\frac{{{c}_{i}}}{{{M}_{i}}}$
$\bar{\mu }=\frac{\mathop{\sum }_{i=1}^{n}({{\mu }_{i}})}{n}$
$D{{D}_{i}}=\frac{{{\mu }_{i}}}{{\bar{\mu }}}$
where μi is the daily incidence rate of region i; ci is the number of daily new confirmed cases of region i; Mi is the resident population of region i in 2019; $\bar{\mu }$ is the average daily incidence rate; n is the number of regions; and DDi is the daily relative severity of region i. When DDi is > 0 and < 1, this indicates that the daily relative severity of the pandemic in that region is lower than the national average. When DDi is > 1, this indicates that the daily relative severity of the pandemic in that region is higher than the national average.
2.3.2 Daily relative healthcare system pressure
The daily relative healthcare system pressure (HSP) of COVID-19 not only directly indicates the local HSP relative to the overall HSP, but also indirectly reflects the treatment ability of the local healthcare system relative to the entire healthcare system. The more recovered cases, the higher the treatment capacity and the lower the HSP. The daily relative HSP is defined as the ratio of the daily local non-recovery rate and the daily overall average non-recovery rate. We used daily non-recovery cases (i.e., daily existing confirmed cases and deaths) to measure the daily non-recovery rate. In particular, an HSP equal to zero means that there are no existing COVID-19 cases. The calculation process for the HSP is shown in Equations (4)-(6).
${{v}_{i}}=\left\{ \begin{array}{*{35}{l}} 0,\ {{t}_{i}}={{d}_{i}}={{s}_{i}}=0 \\ \frac{{{t}_{i}}+{{d}_{i}}}{{{t}_{i}}+{{d}_{i}}+{{s}_{i}}},\ {{t}_{i}}+{{d}_{i}}+{{s}_{i}}\ne 0 \\ \end{array} \right.$
where vi is the daily non-recovery rate of region i; and ti, di, and si are the daily existing confirmed cases, daily new deaths, and daily new recovered cases of region i, respectively. Notably, when ti, di, and si are all equal to zero, the non-recovery rate is also zero, meaning that there is no pandemic contagion or healthcare system pressure. There is also a critical time during the dramatic decrease of HSP when ti and di are equal to zero, but si is not.
The formula can be equivalently transformed to 1 - (daily new recovered / existing confirmed cases on the day before), which means healthcare system pressure comes from COVID-19 new confirmed and death. The higher the healthcare system pressure is, the higher the risk. When vi is 0, there are two situations, namely, all confirmed cases recovered today or no existing confirmed cases the day before. The former means high medical level of COVID-19. The latter means low COVID-19 incidence.
After calculating the non-recovery rate, the daily relative HSP can be determined as follows.
$\bar{\nu }=\frac{\mathop{\sum }_{i=1}^{n}{{v}_{i}}}{n}$
$S{{D}_{i}}=\frac{{{\nu }_{i}}}{{\bar{\nu }}}$
where $\bar{\nu }$ represents the daily average relative HSP; n is the number of regions; and SDi indicates the daily relative HSP of region i. When SDi is > 0 and < 1, the daily relative HSP of the COVID-19 pandemic is lower than the overall average. When SDi is > 1, the daily relative treatment capacity of the COVID-19 pandemic is higher than the overall average.
2.3.3 Daily relative risk index
Following the daily relative severity and daily relative HSP described and calculated above, we adopted a panel coordinate system to map the relative risk points and encode them to a one-dimensional value as the daily relative risk index using the z-order curve and fractal theory. In the plane coordinate system, the horizontal and vertical coordinate axes represent the daily relative HSP and daily relative severity, respectively. The risk points of research areas can then be plotted in the coordinate system and updated daily (Figure 2a).
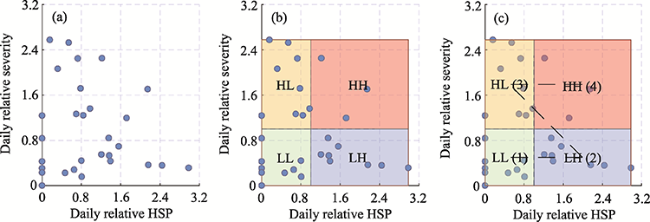
Figure 2 Risk coordinates and z-order curve encoding (Note: HH represents high relative severity and high relative HSP; HL represents high relative severity and low relative HSP; LH represents low relative severity and high relative HSP; LL represents low relative severity and low relative HSP.)
Subsequently, we constructed an envelope rectangle (namely the risk rectangle), of which the four vertices are determined by the maxima and minima of the daily relative severity and daily relative HSP, delineating the outer boundary of the risk points. This risk rectangle was then divided into four sections via the reference lines (daily relative severity = 1 and daily relative HSP = 1) and labeled LL, HL, HH, and LH in a clockwise fashion (Figure 2b). The vertical and horizontal reference lines represent the average relative severity and the average relative HSP, respectively. The points in section LL indicate the risks of these locations having low daily relative severity and low daily relative HSP. Points in section HL indicate the risks of these regions having high daily relative severity and low daily relative HSP. Points in section HH indicate the risks of these regions having high daily relative severity and high daily relative HSP. Points in section LH indicate the risks of these regions having low daily relative severity and high daily relative HSP. The four sections LL, LH, HL, and HH were then assigned values of 1-4 using z-order curve encoding (Figure 2c). These values are referred to as the first-order z-values in this study because the risk rectangles were divided into four sections once.
As a result of fractal theory and the self-similarity of z-order curves (Mandelbrot, 1983; Dai et al., 2003), the envelope rectangle can be repeatedly quartered while keeping the z-order curve encoding consistent with meeting a more complex relationship between daily relative severity and daily relative HSP. For example, the original four sections (Figure 3a) were subdivided into 16 grids assigned the values of 1-16 using the z-order curve encoding method (Figure 3b). The values of the 16 subdivisions are referred to as the third-order z-values given the three quarterings of the risk rectangle. We assumed that the pandemic was likely to occur in each administrative region, and the risks would not be zero anywhere. The lowest relative risk index was set to one, while the highest was the maximum value of every four adjacent grids.
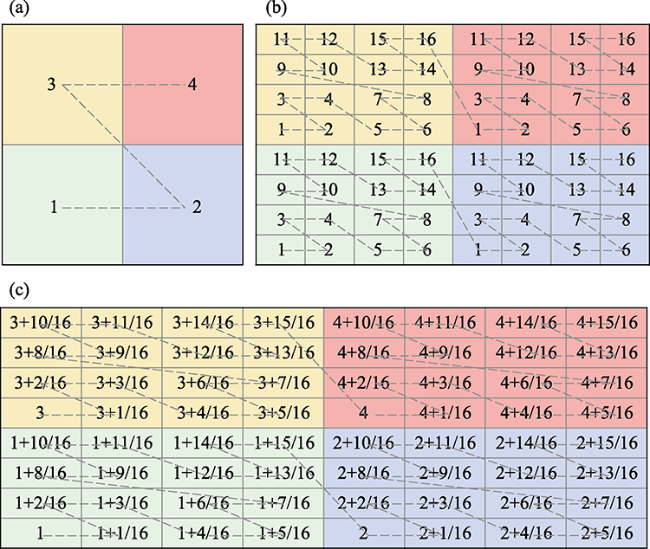
Figure 3 Subdivisions of risk coordinates and calculation of DRRIs
Therefore, the daily relative risk index ranged from 1-5. The DRRI in each grid (Figure 3c) can be calculated using Equation (7):
$DRR{{I}_{g}}={{Z}_{1-order}}+\frac{{{Z}_{n-order}}-1}{{{2}^{n+1}}}$
where DRRIg indicates the DRRI corresponding to grid g; ${{Z}_{1-order}}$ represents the first-order z-value of grid g; ${{Z}_{n-order}}$ represents the n-order z-value of grid g; and n depicts the number of times the risk rectangle was quartered (i.e., the order of the z-value).
From Figure 3, it can be observed that as the relative risk index increases, the pandemic risk increases. The lower-left corner of the risk has the least risk, while the upper right corner has the largest DRRI. Corresponding to the first four sections of the risk rectangle, a DRRI of 1-2, which falls within low relative severity and low relative HSP, indicates low daily relative risk. A DRRI of 2-3, which falls within low relative severity but high relative HSP, indicates moderate daily relative risk, since low relative severity means less spread of the pandemic but infection cases in the healthcare system. A DRRI of 3-4, which falls within high relative severity but low relative HSP, indicates high daily relative risk, since high relative severity indicates that the spread is not under control and may continuously increase the pressure and burden on the healthcare system. A DRRI of 4-5, which falls within high relative severity and high relative HSP, indicates a very high daily relative risk.

2.4 Analytic plan

In order to distinguish the different temporal patterns of COVID-19 pandemic risk in the study areas, hierarchical clustering was employed since it does not require predefined clustering parameters (Bouguettaya et al., 2015). At each step, objects with the shortest squared Euclidean distance were aggregated into a risk group based on the average-linkage criterion (Aldenderfer et al., 1978). The spatial pattern of the COVID-19 pandemic risk was then illustrated by mapping and geo-visualizing the members of each risk group according to the temporal pattern of their DRRIs.

3 Results

3.1 Comparison of incidence and recovery of COVID-19 between Hubei and other provinces in China

Hubei was the province with the most severe COVID-19 pandemic in China from January 19-March 30, 2020. There were 68,551 confirmed cases in total, accounting for 84% of the confirmed COVID-19 cases in China. The incidence rate of COVID-19 in Hubei was 100 times that of other provinces in China (Figure 4a). Thus, the healthcare system in Hubei, especially in Wuhan, bore heavy pressure and received medical assistance from other provinces. Figure 4 shows the daily incidence rates, daily non-recovery rates, and DRRIs of Hubei (blue lines), and their averages for other provinces (green lines).
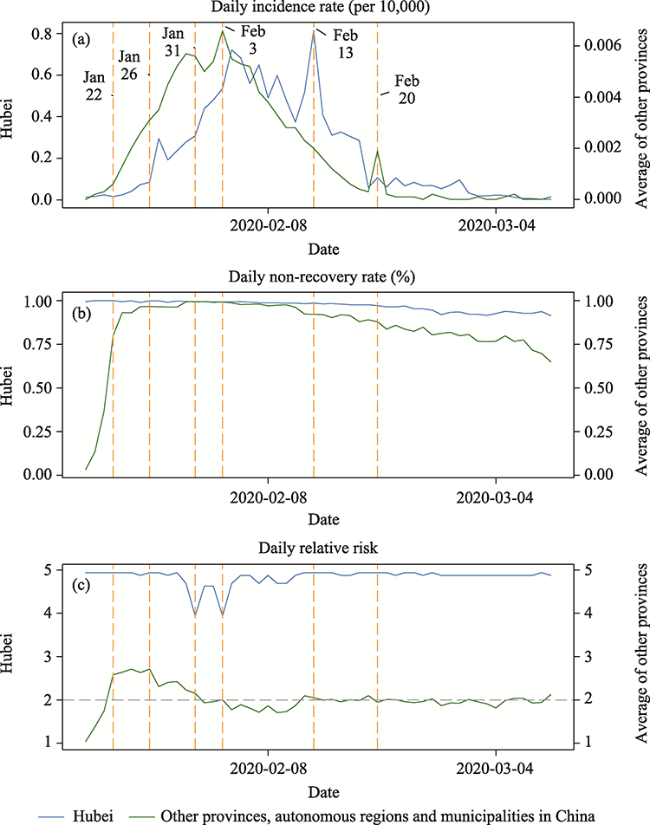
Figure 4 Temporal trends of the pandemic and DRRI in Hubei Province and other provinces, autonomous regions and municipalities in China
The incidence rates in Hubei and other provinces first increased to their peaks and then decreased (Figure 4a). The incidence rate peaks in the other provinces occurred slightly earlier (February 3) than in Hubei (Febuary 4). It should be noted that there was a spike of the incidence rate in Hubei on February 12 because on this date the clinically confirmed cases were added as confirmed cases. In addition, the spike of the average incidence rate of other provinces on February 20 was due to the infection of prison groups in Shandong Province.
Meanwhile, the non-recovery rates, which indicate the HSP, exhibited divergent patterns (Figure 4b). Before January 22, 2020, the non-recovery rate of Hubei was much higher than the average non-recovery rate of the other provinces in China because there were few confirmed cases in China outside Hubei. The average non-recovery rate of the other provinces then dramatically increased to the level of Hubei due to a large number of COVID-19 patients in hospitals. Following the peaks of the daily incidence rate of the other provinces (February 3) and Hubei (February 4), the non-recovery rates both began to decline, although the average non-recovery decline rate of the other provinces was significantly steeper than that of Hubei. This phenomenon indicates that the healthcare system in Hubei was continuously under tremendous pressure, with the cases including greater numbers of severely ill patients, shortages of medical staff and supplies, and a scarcity of specific medication for COVID-19 in Hubei.
Comparing the DRRIs between Hubei and other provinces (Figure 4c), the DRRI of Hubei always maintained a high level. Two obvious valleys in the Hubei DRRI occurred on January 31 and February 3, corresponding to the two peaks of the average incidence rate of the other provinces. On Jan. 30, the average incidence rate of the other provinces reached its first peak, while the DRRI of Hubei began to decrease, since its relative severity declined. The next day (January 31), there were still more newly confirmed cases in other provinces, and the number of non-recovered patients was greater than the previous day. Hence, the relative HSP and relative severity in Hubei reached their minima. When the new confirmed cases in the other provinces reached their second peak on February 3, the confirmed cases in Hubei were still growing and had not reached their peak. Hence, the relative HSP and relative severity in Hubei decreased again, and the DRRI reached its second minimum. It needs to be clarified that even when Hubei’s DRRI reached its two minima of 3.94, its risk was still much higher than those of the other provinces, which had corresponding values of 2.15 and 2. Over the entire period, the DRRI of Hubei maintained a high value due to the relatively high healthcare system pressure.
In contrast, the average DRRI of the other provinces first increased, then slowly decreased and remained at a consistently low level. Between January 22 and January 26, the average DRRIs of the other provinces were high, ranging from 2.58-2.71. This is because during this period, the incidence rate increased faster than that of Hubei, although their non-recovery rates were comparable. After January 26, however, due to the rapid growth of the incidence rate in Hubei, the relative severities of the other provinces decreased until February 13, at which time Hubei exhibited its highest incidence rate. The average DRRI of the other provinces then fluctuated around 2 and maintained a low level due to the low incidence and non-recovery rates.

3.2 Divergent temporal patterns of the daily relative risk in China

To further uncover the spatiotemporal patterns of the daily relative risk of COVID-19 in China, we applied the DRRI to the 31 provinces. We then classified the DRRI values into four categories using the hierarchical clustering method. Following that, the spatial distributions of the four risk groups were mapped.
In order to identify the temporal patterns of the DRRIs, hierarchical clustering was applied to classify the DRRI time series of the 31 provinces in a dendrogram based on the squared Euclidean distance (Figure 5). The grey dashed reference line distinguishes the hierarchical clusters with the seven numbers of clustered categories. Hubei, Beijing, Tianjin, and Gansu are separate categories. Guangdong, Zhejiang, Sichuan, Hunan and Henan are in the same category. Tibet and Qinghai form a category. The other category contains 20 provinces, namely, Shandong, Jiangxi, Fujian, Anhui, Ningxia, Guizhou, Guangxi, Shanghai, Shaanxi, Inner Mongolia, Heilongjiang, Liaoning, Hainan, Yunnan, Hebei, Xinjiang, Jiangsu, Jilin, Chongqing, and Shanxi.
Figure 5 Hierarchical clusters of the DRRIs of 31 provinces, autonomous regions and municipalities in China
The daily relative risk index was calculated for 31 provinces in China (excluding Hong Kong, Macao, and Taiwan) from January 19-March 10, 2020, as shown in Figure 6. According to both the clustered categories and the DRRI trends, we divided the provinces into four risk groups. Group I contains Hubei, Beijing, and Tianjin. Group II contains only one province: Gansu. Group III comprises several provinces, that is, Guangdong, Zhejiang, Sichuan, Hunan, and Henan. Group IV contains other 22 provinces. The color coding of the province names in Figure 6 indicates the clustered risk group. Specifically, red, yellow, blue, and green indicate Groups I, II, III, and IV, respectively. The background color of each subplot in Figure 6 indicates the risk level according to the DRRI intervals. The green, blue, yellow, and red zones in the subplots indicate low, moderate, high, and very high risk, respectively.
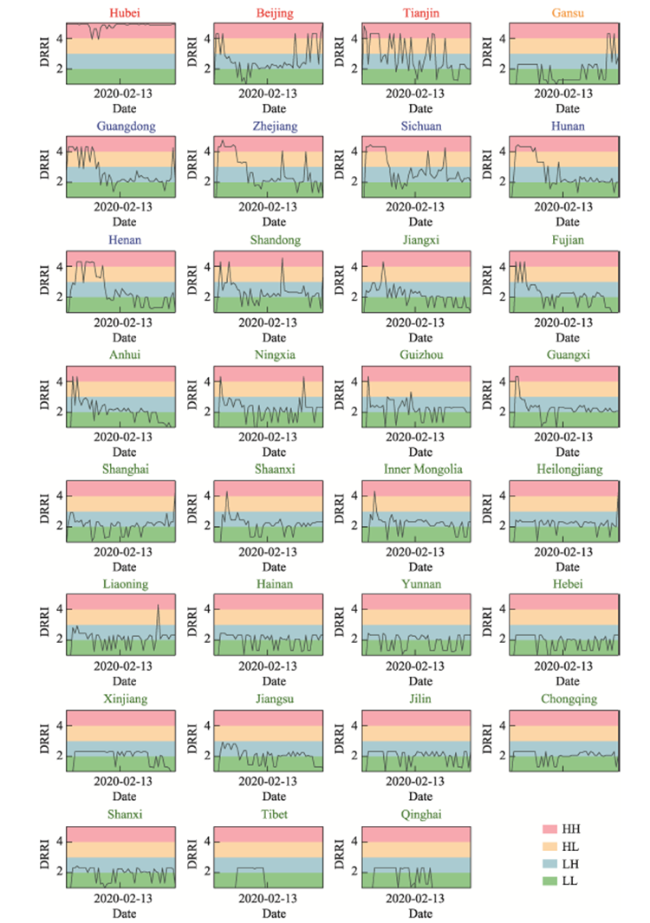
Figure 6 DRRI of 31 provinces, autonomous regions and municipalities in China (HH: High daily relative severity and high daily relative HSP; HL: High daily relative severity and low daily relative HSP; LH: Low daily relative severity and high daily relative HSP; LL: Low daily relative severity and low daily relative HSP)
Overall, the DRRI in the different provinces varied in terms of both magnitude and fluctuation. For example, the DRRIs in Hubei was high in magnitude. The DRRIs in Beijing and Tianjin ware high and fluctuated greatly. Gansu experienced low DRRIs followed by high DRRIs. The DRRIs in Group III exhibited fluctuations and decreases. The DRRIs in Group IV were relatively stable and low.
Furthermore, in order to depict the general temporal patterns of the four groups, we aggregated the members of each group and obtained their mean DRRIs (Figure 7). Since there was just one province in Group II, its temporal pattern is represented by Gansu (Figure 7b). Due to its high DRRI values, we identified Group I as the high-value type group. Group II was identified as the fluctuating-increase type since DRRIs sharply increased from low DRRI values (Figure 7b). In Group III, the DRRIs quickly increased to reach a high, but then dropped steadily (Figure 7c). Hence, we identified this group as the inverted U-shaped type. Given that the DRRIs in Group IV were the lowest and most stable among the four groups, it was identified as the low-stable type.
Figure 7 Temporal patterns of the four aggregated risk groups

3.3 Heterogeneous spatial patterns of the daily relative risk in China

To explore the spatial patterns of the four groups, we mapped and color-coded the members of each group according to the clustering results (Figure 8). Overall, the distribution of the risk groups presents an obvious heterogeneous and circular pattern centered on Hubei Province. This spatial pattern is consistent with the spread of the pandemic. Moreover, some particular individual distributions were the result of other underlying causes, such as imported infection cases from abroad.
Figure 8 Spatial patterns of the four risk groups in China
Hubei, Beijing, and Tianjin, as the provinces in high-value type group, displayed persistently high relative pandemic risk. Although Beijing and Tianjin are far from Hubei, persistent new confirmed cases appeared due to the extensive population flow at home and abroad. These provinces exhibited high relative severity and high HSP.
Gansu, the only province in fluctuating increase type group, experienced a sudden increase of COVID-19 relative risk. The imported COVID-19 cases from Iran to Gansu in March, 2020 resulted in the fluc- tuation.
Members of the inverted U-shaped type group with their relative risk initially increasing due to the large popula- tion flow out of the city of Wuhan and Hubei Province and then decr- easing. The first confirmed cases outside Hubei appeared in Guangdong on January 19, 2020. With the implementation of public health interventions, the relative risk of these provinces dramatically decreased.
The low-stable type group can be separated into two subgroups. One subgroup (Tibet, Qinghai, Xinjiang, Shaanxi, Shanxi, Yunnan, Guizhou, Guangxi, Inner Mongolia, Jilin, and Liaoning) experienced the continuous occurrence of a few confirmed cases. Another subgroup (Shandong, Jiangxi, Fujian, Anhui, Ningxia, Shanghai, Heilongjiang, Hebei, Chongqing, Hainan) suffered relatively severe pandemics, although they maintained low relative risk owing to public health interventions and adequate medical capabilities.

4 Discussion

This study presents a new and effective method for assessing the relative pandemic risk of COVID-19 by considering both the severity of the pandemic and the pressure of the healthcare system. Based on the above results and analysis, this new method is feasible for quantifying and evaluating the dynamic changes and spatial patterns of the pandemic risk.
Compared with the existing pandemic risk tools or methods, the relative risk index proposed here is an alternative indicator which reflects integrated and dynamic pandemic risk with less data source. Existing pandemic risk tools require massive basic data for evaluation. For example, the INFORM Epidemic Risk Index and Infectious Disease Vulnerability Index (Moore et al., 2016; Gilbert et al., 2020) need kinds of data regarding demography, economy, healthcare, public health, disease dynamics and government governance. The DRRI only requires two components: the relative severity and the daily relative HSP. The relative severity illustrates the degree of the pandemic’s spread. The daily relative HSP directly represents the pressure on the healthcare system and indirectly represents the capability of the healthcare system. Compared with the daily recovery rate of COVID-19, the daily HSP measures the healthcare system capacity better when there are no confirmed cases. For example, from Febuary 12, 2020-March 10, 2020, Tibet had no confirmed cases or COVID-19 patients; hence, its recovery rate was zero, lower than other provinces, although its relative HSP was also zero, which was lower than the other provinces. Although some other systems offer real time hospital and ICU service capacity fluctuations in response to COVID-19 healthcare demands and the pandemic situation, it can only illustrate and show pandemic risk qualitatively. Hence, compared with those risk indices tools, the DRRI could reflect the dynamics and improvements of the healthcare system since it depends on the changes and variation of recovered patients, which are determined by the improvement of treatments, medications, and knowledge regarding COVID-19.
In addition, the DRRI is also capable of indicating the development of the pandemic and detecting extreme events during the pandemic using fewer data. For example, the temporal pattern of Hubei Province’s DRRI exactly represents the pandemic development and the changes of HSP. Besides, the DRRI in Shandong Province exhibited an unexpected increase on February 20, 2020 (Figure 6). This timing corresponded to the final peak of the daily incidence rate (Figure 4a). There were 200 new confirmed cases reported in Rencheng Prison of Shandong Province on February 20, 2020, which was also the day with the largest number of new confirmed cases on a single day in the other provinces since February 15, 2020. Hence, the risks in Shandong were eventually promoted by this extreme event, resulting in the DRRI changes.
To solve the shortcoming of direct application of the relative severity and relative HSP, we constructed a risk rectangle based on the coordinates of the two indicators. However, a critical issue exists, when merely using the ratio of the relative severity and the relative HSP for risk assessment. This is due to the fact that when the relative severity and relative HSP in some regions are either both higher or both lower, even though they are obviously in different risk levels, the two situations will be the same in terms of a simple ratio. We then employed the z-order curve to index and calculate the daily relative risk index. Since the risk rectangle construction changes daily and adapts to daily data and the two indicators, the DRRI is more flexible and adaptive to the daily changes of the pandemic than the risk assessment methods using static statistical data (Requia et al., 2020; Sangiorgio et al., 2020; Zhao et al., 2020). Although there is a method (e.g., Yuan et al., 2020) that can indicate the dynamic risks, it is unable to avoid the poor discrimination of risks in other regions resulting from individual regions with abnormally high risks. Due to the fractal features of the risk rectangles and z-order curve, however, the pandemic risk can be continuously subdivided. In this manner, it is possible to avoid the problem of poor risk discrimination.
According to the spatiotemporal and analysis of the DRRI, the healthcare system is the key to coping with the COVID-19 pandemic. The healthcare system of Hubei, Beijing and Tianjin, which experienced greater pandemic severity, was under heavy pressure, which may have resulted in a lower recovery rate. Other provinces (e.g., Guangdong, Zhejiang, Sichuan, Hunan, and Henan), however, suffered severe pandemics but efficiently controlled and reduced the pandemic risk, partially owing to the low pressure on their healthcare systems and high healthcare capability. Therefore, the medical equipment and staff from the areas with relatively high healthcare system capacity could quickly be transferred to the high-risk areas in order to accomplish case-by-case prevention and control.
Infection cases imported from abroad also require more scrutiny. With the exception of Hubei, Beijing was the region with the highest relative risk during the novel coronavirus pandemic, with higher pandemic and HSP severity. During the latter part of the study period, Beijing became a hub for the most infection cases imported from abroad. The official administration of Beijing had to shut down international airlines in order to reduce the spread due to cases from abroad. Similarly, Gansu exhibited a high daily risk in the latter period due to imported cases. Therefore, it is necessary to strengthen the prevention and control of the pandemic risk from abroad and improve the healthcare system capacity associated with customs.
There are some aspects of this study that should be noted, and some limitations that need to be addressed. Because the DRRI is a relative index, the reference objects and risk assessment areas are critical. With a different reference object, the risk indicated by the DRRI will differ. For example, if the reference object is the average severity and HSP of a province, the DRRI reflects the pandemic risk associated with the province. If the reference object is the average severity and HSP of a country, however, it will reflect the pandemic risk relative to the country. In addition, the DRRI did not distinguish the severe patients from the mild patients when calculating the relative HSP, since during the early stage of the pandemic in China, patients were treated equally, and all exerted heavy pressure on the healthcare system. For a more careful assessment of the HSP in small-scale regions, differentiating patients' types will be both practical and instructive.
This study emphasized the significance of healthcare system capacity and imported cases to pandemic risk assessment. Nowadays, large-scale lockdown and long-term traffic control would hinder social development. The pandemic interventions should be advanced to prevent and improve healthcare system capacity. China’s experiences showed that quickly initiating an emergency response can effectively control the spread of COVID-19, such as reducing human-to-human contact and cutting off the route of virus transmission (Cheng et al., 2020). Based on risk classification, the government enables targeted prevention and ensures society’s smooth operation (Ye et al., 2020). According to the above analysis, the government should manage pandemic risk dynamically both from absolute risk and relative risk, transferring medical resources from lower-risk regions to higher-risk regions. Meanwhile, using the DRRI as the indicator, the administrators can comprehensively evaluate the pandemic risk to avoid overreacting and unnecessary high-cost pandemic interventions (e.g., large-scale lockdown).

5 Conclusions

Based on the severity of the COVID-19 pandemic and its pressure on the healthcare system, this study evaluated the relative risk of the pandemic and accurately distinguished its various spatiotemporal risk patterns, with promising findings. The results of the spatiotemporal risk analysis revealed that the proposed method is able to finely illustrate the dynamic changes of the pandemic risks associated with COVID-19. Based on these results, healthcare system capacity is a critical factor in reducing relative pandemic risks. In addition, COVID-19 cases imported from abroad also require special attention. In the future, the separation of patient types and the determination of reference objects will be two critical factors in assessing the relative pandemic risk of small-scale regions.

Abbreviations

COVID-19: Coronavirus disease 2019; SARS-COV-2: Severe acute respiratory syndrome coronavirus 2; GDP: Gross Domestic Product; HSP: Healthcare system pressure; DRRI: daily relative risk index; LL: Low daily relative severity and low daily relative HSP; HL: High daily relative severity and low daily relative HSP; HH: High daily relative severity and high daily relative HSP; LH: Low daily relative severity and high daily relative HSP.
[1]
Aldenderfer M S, Blashfield R K, 1978. Computer programs for performing hierarchical cluster analysis. Applied Psychological Measurement, 2(3):405-413.

DOI

[2]
Bao J Y, Lin H, Zhou Q, 2020. COVID-19 epidemic spatio-temporal dataset. https://github.com/Estelle0217/COVID-19-Epidemic-Dataset. Accessed 1 Apr 2020.

[3]
Boldog P, Tekeli T, Vizi Z et al., 2020. Risk assessment of novel coronavirus COVID-19 outbreaks outside China. Journal of Clinical Medicine, 9(2):571.

DOI

[4]
Bouguettaya A, Yu Q, Liu X M et al., 2015. Efficient agglomerative hierarchical clustering. Expert Systems with Application, 42(5):2785-2797.

DOI

[5]
CGTN, 2020. Last two temporary hospitals in Wuhan close, finalizing phaseout. https://news.cgtn.com/news/2020-03-10/Last-two-temporary-hospitals-in-Wuhan-close-finalizing-phaseout-OKuAJwwXsI/index.html. Accessed 7 Sept 2020.

[6]
Chatterjee R, Bajwa S, Dwivedi D et al., 2020. COVID-19 risk assessment tool: Dual application of risk communication and risk governance. Progress in Disaster Science, 7:100109.

DOI

[7]
Cheng C X, Shi P J, Song C Q et al., 2018. Geographic big-data: A new opportunity for geography complexity study. Acta Geographica Sinica, 73(8):1397-1406. (in Chinese)

[8]
Cheng C X, Zhang T Y, Song C Q et al., 2020. The coupled impact of emergency responses and population flows on the COVID-19 pandemic in China. GeoHealth, 4(12):e2020GH000332.

[9]
Chinazzi M, Davis J T, Ajelli M et al., 2020. The effect of travel restrictions on the spread of the 2019 novel coronavirus (COVID-19) outbreak. Science, 368(6489):395-400.

DOI

[10]
Chinese Center for Disease Control and Prevention (CCDC), 2020. The epidemiological characteristics of an outbreak of 2019 novel coronavirus diseases (COVID-19)-China, 2020. http://weekly.chinacdc.cn/en/article/id/e53946e2-c6c4-41e9-9a9b-fea8db1a8f51. Accessed 7 Sept 2020.

[11]
Dai H K, Su H C, 2003. Approximation and analytical studies of inter-clustering performances of space-filling curves. Discrete Mathematics and Theoretical Computer Science, AC:53-68.

[12]
Dong E S, Du H R, Gardner L M, 2020. An interactive web-based dashboard to track COVID-19 in real time. The Lancet: Infectious Diseases, 20(9):533-534.

DOI

[13]
Fan C J, Cai T M, Gai Z Y et al., 2020. The relationship between the migrant population’s migration network and the risk of COVID-19 transmission in China: Empirical analysis and prediction in prefecture-level cities. International Journal of Environmental Research and Public Health, 17(8):2630.

DOI

[14]
Feng Z M, Xiao C W, Li P et al., 2020. Comparison of spatio-temporal transmission characteristics of COVID-19 and its mitigation strategies in China and the US. Journal of Geographical Sciences, 30(12):1963-1984.

DOI

[15]
Fu X M, Ying Q, Zeng T Y et al., 2020. Simulating and forecasting the cumulative confirmed cases of SARS- CoV-2 in China by Boltzmann function-based regression analyses. Journal of Infection, 80(5):578-606.

[16]
Gilbert M, Pullano G, Pinotti F et al., 2020. Preparedness and vulnerability of African countries against importations of COVID-19: A modelling study. Lancet, 395:10227:871-877.

DOI PMID

[17]
Grassia R, Testa S, De Silvestri A et al., 2020. Lights and shadows of SARS-CoV-2 infection risk assessment in endoscopy. Digestive and Liver Disease, 52(8):816-8.

DOI

[18]
Gu C L, Zhu J, Sun Y F et al., 2020. The inflection point about COVID-19 may have passed. Science Bulletin, 65(11):865-7.

DOI

[19]
Hu J X, He G H, Liu T et al., 2020. Risk assessment of exported risk of novel coronavirus pneumonia from Hubei Province. Chinese Preventive Medicine, 54:362-6. (in Chinese)

[20]
INFORM Epidemic Risk Index. https://drmkc.jrc.ec.europa.eu/inform-index/INFORM-Risk/INFORM-Epidemic-Risk-Index.

[21]
Jia J S, Lu X, Yuan Y et al., 2020. Population flow drives spatio-temporal distribution of COVID-19 in China. Nature, 582:389-394.

DOI

[22]
Kraemer M U G, Yang C H, Gutierrez B et al., 2020. The effect of human mobility and control measures on the COVID-19 epidemic in China. Science, 368(6490):493-497.

DOI

[23]
Kucharski A J, Russell T W, Diamond C et al., 2020. Early dynamics of transmission and control of COVID-19: A mathematical modelling study. Lancet: Infectious Diseases, 20(5):553-8.

DOI

[24]
Liu Q H, Liu Z C, Li D Q et al., 2020. Assessing the tendency of 2019-nCoV (COVID-19) outbreak in China. medRxiv: The preprint server for health sciences, doi: 10.1101/2020.02.09.20021444.

DOI

[25]
Liu Y, Yang D Y, Dong G P et al., 2020. The spatio-temporal spread characteristics of 2019 novel coronavirus pneumonia and risk assessment based on population movement in Henan Province: Analysis of 1243 individual case reports. Economic Geography, 40(3):24-32. (in Chinese)

[26]
Maier B F, Brockmann D, 2020. Effective containment explains subexponential growth in recent confirmed COVID-19 cases in China. Science, 368(6492):742-746.

DOI

[27]
Mandelbrot B B, 1983. The Fractal Geometry of Nature. San Francisco: Freeman.

[28]
Moore M, Gelfeld B, Okunogbe A T et al., 2016. Identifying future disease hot spots: Infectious disease vulnerability index. Rand Health Quarterly, 6(3):5.

[29]
Nichols J H, Rauch C A, 2020. A laboratory risk assessment during the coronavirus (COVID-19) pandemic. Journal of Applied Laboratory Medicine, 5(4):808-811.

DOI

[30]
Nolan J P, Monsieurs K G, Bossaert L et al., 2020. European resuscitation council COVID-19 guidelines executive summary. Resuscitation, 153:45-55.

DOI PMID

[31]
Pan A, Liu L, Wang C L et al., 2020. Association of public health interventions with the epidemiology of the COVID-19 outbreak in Wuhan, China. JAMA: Journal of American Medical Association, 323(19):1915-1923.

DOI

[32]
Pastor-Satorras R, Castellano C, Van Mieghem P et al., 2015. Epidemic processes in complex networks. Reviews of Modern Physics, 87(3):925-979.

DOI

[33]
Prather K A, Wang C C, Schooley R T, 2020. Reducing transmission of SARS-CoV-2. Science, 368(6498):1422-1424.

DOI

[34]
Ran L, Chen X Y, Wang Y et al., 2020. Risk factors of healthcare workers with coronavirus disease 2019: A retrospective cohort study in a designated hospital of Wuhan in China. Clinical Infectctious Disease: an Official Publication of the Infectious Diseases Society of America, doi: 10.1093/cid/ciaa287.

DOI

[35]
Read J M, Bridgen J R, Cummings D A et al., 2020. Novel coronavirus 2019-nCoV: Early estimation of epidemiological parameters and epidemic predictions. medRxiv: The preprint server for health sciences, doi: 10.1101/2020.01.23.20018549.

DOI

[36]
Requia W J, Kondo E K, Adams M D et al., 2020. Risk of the Brazilian health care system over 5572 municipalities to exceed health care capacity due to the 2019 novel coronavirus (COVID-19). Science of the Total Environment, 730:139144.

DOI

[37]
Sangiorgio V, Parisi F, 2020. A multicriteria approach for risk assessment of Covid-19 in urban district lockdown. Safety Science, 130:104862.

DOI PMID

[38]
Schroder I, 2020. COVID-19: A risk assessment perspective. ACS Chemical Health & Safety, 27(3):160-9.

[39]
Watson C, Mullen L, 2020. Risk-informed decision making: More critical today than ever before. Health Security, 18(3):153-4.

DOI

[40]
Shen S P, Wei Y Y, Zhao Y et al., 2020. Risk assessment of global COVID-19 imported cases into China. Chinese Journal of Epidemiology, doi: 10.3760/cma.j.cn112338-20200415-00577. (in Chinese)

DOI

[41]
So M K P, Tiwari A, Chu A M Y et al., 2020. Visualizing COVID-19 pandemic risk through network connectedness. International Journal of Infectious Diseases, 96:558-561.

DOI

[42]
Tian H Y, Liu Y H, Li Y D et al., 2020. An investigation of transmission control measures during the first 50 days of the COVID-19 epidemic in China. Science, 368(6491):638-642.

DOI

[43]
Tu H W, Zhong R X, Xiao J P et al., 2020. Region- and risk-specific strategies for coronavirus disease 2019 epidemic control and prevention in Guangdong province: A risk assessment study. Chinese Journal of Public Health, 36:486-492. (in Chinese)

[44]
Wang J, Shi X M, 2020. Harmonizing the COVID-19 pandemic response with economic and social recovery. http://weekly.chinacdc.cn/en/article/doi/10.46234/ccdcw2020.171. Accessed 7 Sept 2020.

[45]
Weiss P, Murdoch D R, 2020. Clinical course and mortality risk of severe COVID-19. Lancet, 395(10229):1014-5.

DOI PMID

[46]
World Health Organization (WHO), 2021. COVID-19 Weekly Epidemiological Update. https://www.who.int/publications/m/item/weekly-epidemiological-update-on-covid-19-18-may-2021. Accessed 24 May 2021.

[47]
Wu J T, Leung K, Leung G M, 2020. Nowcasting and forecasting the potential domestic and international spread of the 2019-nCoV outbreak originating in Wuhan, China: A modelling study. Lancet, 395(10225):689-697.

DOI

[48]
Yang P, Wang X, Liu P et al., 2020. Clinical characteristics and risk assessment of newborns born to mothers with COVID-19. Journal of Clinical Virology, 127:104356.

DOI

[49]
Yang W T, Deng M, Li C K et al., 2020. Spatio-temporal patterns of the 2019-nCoV epidemic at the county level in Hubei Province, China. International Journal of Environmental Research and Public Health, 17(7):2563.

DOI

[50]
Ye Y Y, Wang C J, Zhang H et al., 2020. Spatiotemporal analysis of COVID-19 risk in Guangdong Province based on population migration. Journal of Geographical Sciences, 30(12):1985-2001.

DOI

[51]
Yu C Z, Lei Q, Li WK et al., 2020. Clinical characteristics, associated factors, and predicting COVID-19 mortality risk: A retrospective study in Wuhan, China. American Journal of Preventive Medicine, 59(2):168-175.

DOI

[52]
Yuan H Y, Chen T, Huang L D et al., 2020. Analysis and comparison of comprehensive risk index of COVID-19 in China and Hubei province. Science & Technology Review, 38(4):21-28. (in Chinese)

[53]
Zhao H B, We J C, Wang S et al., 2020. The risk assessment of Covid-2019 epidemic in metropolis and precise prevention and control measures: A case study of Zhengzhou City. Economic Geography, 40(4):103-109, 124. (in Chinese)

[54]
Zhao K D, Long C, Wang Y et al., 2020. Negligible risk of the COVID-19 resurgence caused by work resuming in China (outside Hubei): A statistical probability study. Journal of Public Health-UK, 42(3):651-2.

[55]
Zhou T, Liu Q H, Yang Z M et al., 2020. Preliminary prediction of the basic reproduction number of the Wuhan novel coronavirus 2019-nCoV. Journal of Evidence-Based Medicine, 13(1):3-7.

DOI

[56]
Zhu X L, Zhang A Y, Xu S et al., 2020. Spatially explicit modeling of 2019-nCoV epidemic trend based on mobile phone data in mainland of China. medRxiv: The preprint server for health sciences, doi: 10.1101/2020.02.09.20021360.

DOI

Outlines

/