
Journal of Geographical Sciences >
Evaluation of ontological value of regional tourism resources: A case study of Hainan Island, China
|
Zhang Tongyan (1987-), PhD Candidate, specialized in GIS and geo-visualization. E-mail: zhangtyan.17b@igsnrr.ac.cn |
Received date: 2020-09-30
Accepted date: 2021-03-10
Online published: 2021-09-25
Supported by
The Project of Hainan Province Tourism Resources Survey and Planning Information(2018Y88M2001AL)
Copyright
Evaluation of tourism resources is necessary for tourism regionalization and planning and for the development of tourism destinations. Furthermore, the scientific evaluation of the status of existing tourism resources is important for optimally combining and rationally developing regional tourism resources. In this study, a conceptual model for estimating the ontological value of tourism resources was developed and an evaluation indicator system was designed for the ontological value. On the basis of the quantitative and spatial characteristics of regional tourism resources, six indicators were constructed: quantitative density, richness, dominance, combination, aggregation, and accessibility. Furthermore, spatial differentiation characteristics of the ontological value indicators of county-level tourism resources on Hainan Island were analyzed, and the ontological value of the tourism resources was comprehensively evaluated and ranked by using a fuzzy clustering evaluation method. Finally, the evaluation results were verified on the basis of the quantity, quality, and accessibility of regional tourism resources by using an expert scoring method. The results showed that the test results were consistent with the inferences drawn from the ontological value, indicating that the evaluation indicator system is scientific and reliable and that it is an effective alternative to existing evaluation indexes of regional tourism resources, which are inconsistent. The fuzzy clustering evaluation method overcomes the subjectivity in the evaluation process and is practical for the quantitative evaluation of regional tourism resources. The evaluation indicator system for regional tourism resources designed in this study can provide a reference for the evaluation of the tourism resource development value on a regional scale, and the evaluation results can facilitate informed policymaking for the rational development of regional tourism resources.
ZHANG Tongyan , WANG Yingjie , ZHANG Shengrui , WANG Yingying , YU Hu . Evaluation of ontological value of regional tourism resources: A case study of Hainan Island, China[J]. Journal of Geographical Sciences, 2021 , 31(7) : 1015 -1038 . DOI: 10.1007/s11442-021-1883-3
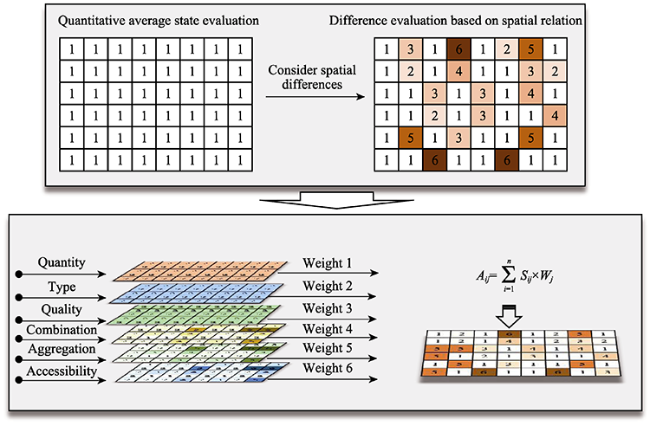
Figure 1 Principle of tourism resource evaluation on the basis of spatial differences |
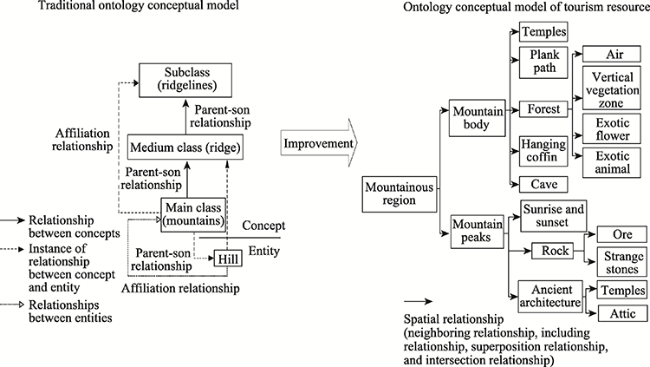
Figure 2 Contrast between traditional ontology and tourism resource ontology |
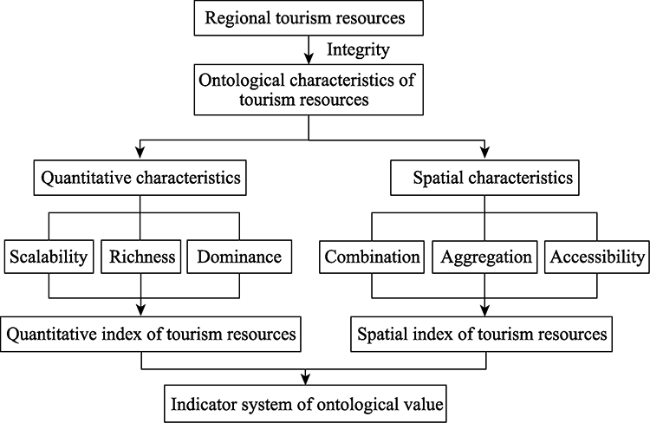
Figure 3 Conceptual model for estimating the ontological value of regional tourism resources |
Table 1 Quantitative-relationship-based evaluation indicator system for tourism resources |
| Evaluation factor | Quantitative characteristics indicator | Calculation method | Method description |
|---|---|---|---|
| Quantity | Scalability | ${{S}_{r}}=m/A$ | The quantity of tourism resources per unit area in a region (district, county, and city). In the formula, Sr is the quantitative density, m is the total quantity of regional tourism resources, and A is the area. |
| Type | Richness | ${{R}_{r}}=n/N$ | The proportion of fundamental types of tourism resources in cities and counties. In the formula, Rr is the type abundance, n is the number of fundamental types in the region, and N is the total number of fundamental types in the province. |
| Quality | Dominance | ${{D}_{r}}=\underset{i=1}{\overset{5}{\mathop \sum }}\,{{w}_{i}}\times {{m}_{i}}/m$ | The proportion of tourism resources at all levels in the region. In the formula, Dr is the quality proportion, i is the level of tourism resources, wi is the weight of level i (level 5 is 1.0, level 4 is 0.7, level 3 is 0.5, level 2 is 0.2, and level 1 is 0.1), mi is the quantity of tourism resources of level i, and m is the total quantity of regional tourism resources. |
Notes: *In the last row, the weight of each level is determined through expert scoring. |
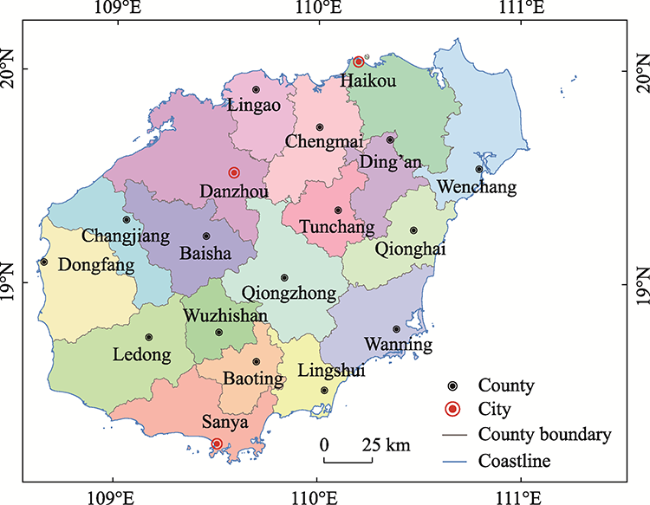
Figure 4 Location of the Hainan Island |
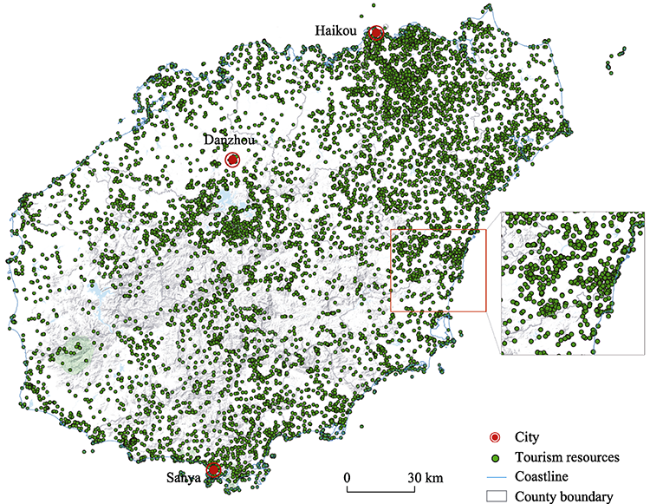
Figure 5 Spatial distribution of tourism resources on Hainan Island |
Table 2 Classification of tourism resources on Hainan Island |
| Main type | Subtype |
|---|---|
| Geographical landscapes | Natural landscape complex |
| Geographical and structural features | |
| Surface morphology | |
| Natural markers and natural phenomena | |
| Water landscapes | River system |
| Lake marsh | |
| Groundwater | |
| Sea surface | |
| River or lake | |
| Biological landscapes | Vegetation landscape |
| Wildlife habitat | |
| Astronomical phenomena and meteorological landscapes | Astronomical phenomena |
| Weather and climate phenomena | |
| Buildings and facilities | Human landscape complex |
| Practical buildings and core facilities | |
| Landscape and sketch architecture | |
| Ruins and remains | Material cultural relics |
| Intangible cultural remains | |
| Tourism commodities | Agricultural products |
| Industrial products | |
| Handmade crafts | |
| Human activities | Personnel activity record |
| Season | |
| Ocean and coastal landscapes | Coastal landscape |
| Marine landscape |
Notes: The above classification is based on China’s national standard, which is specified in “Classification, Investigation and Evaluation of Tourism Resources” (GBT 18972-2017). |
Table 3 Evaluation grades of tourism resources |
| Score interval | Grade of tourism resources |
|---|---|
| ≥90 | Level five |
| 75-89 | Level four |
| 60-74 | Level three |
| 45-59 | Level two |
| 30-44 | Level one |
Notes: The above grading is based on China’s national standard, which is specified in “Classification, Investigation and Evaluation of Tourism Resources” (GBT 18972-2017). |
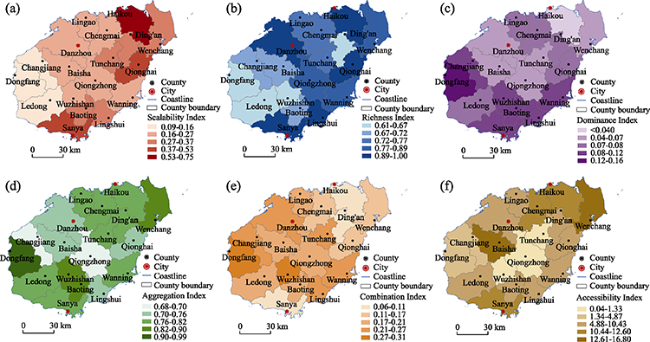
Figure 6 Spatial distributions of the (a) scalability index, (b) richness index, (c) dominance index, (d) aggregation index, (e) combination index, and (f) accessibility index of tourism resources |
Table 4 Standardization of the ontological value index of tourism resources on Hainan Island |
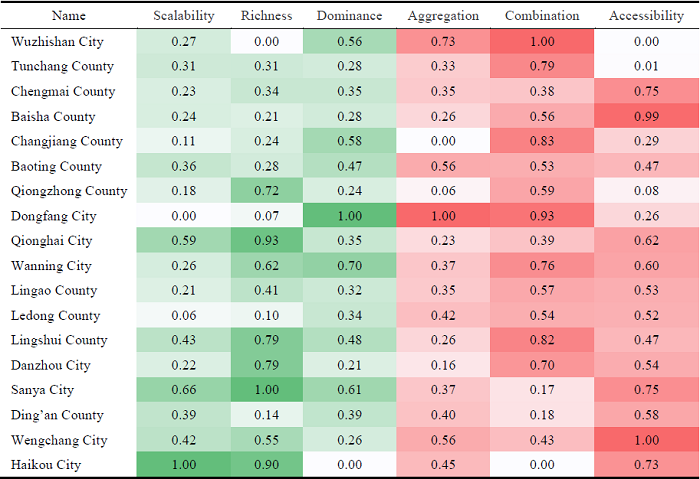 |
Low value |
Figure 7 Fuzzy clustering pedigree of tourism resources on Hainan Island |
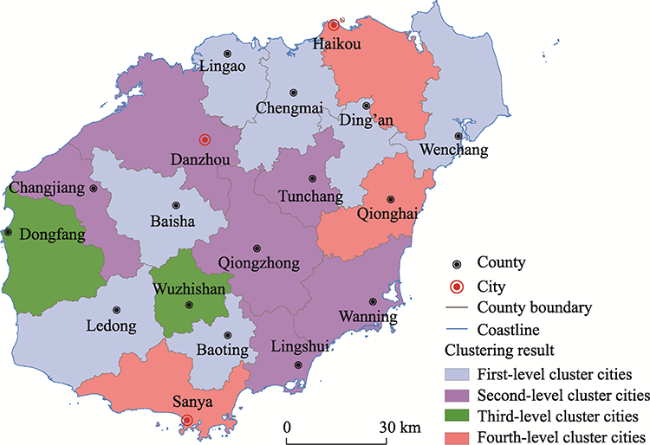
Figure 8 Cluster distribution of the tourism resource ontological value for Hainan Island |
Table 5 Standardization of the ontological value index of tourism resources on Hainan Island |
| Panel composition | Number of participants | Weight |
|---|---|---|
| Tourism experts | 6 | 0.4 |
| Geography experts | 6 | 0.3 |
| Local government tourism managers | 18 | 0.2 |
| Census enumerators | 30 | 0.1 |
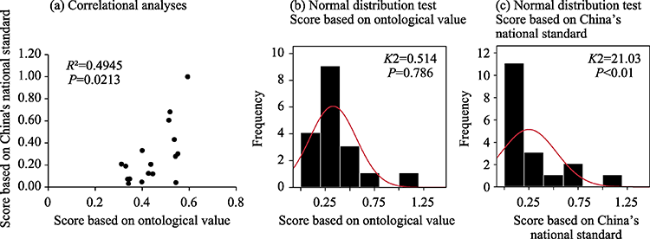
Figure 9 Correlational analyses and normal distribution test |
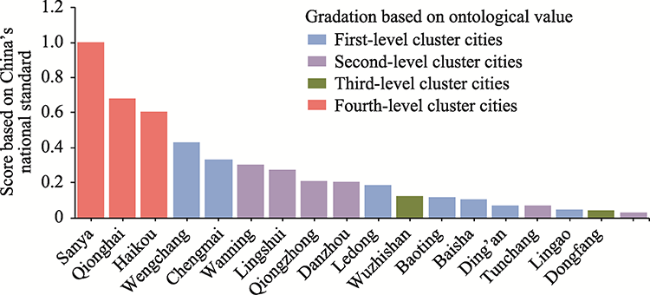
Figure 10 Comparison and contrast between China’s National Standard and ontological value |
| [1] |
|
| [2] |
|
| [3] |
|
| [4] |
|
| [5] |
|
| [6] |
Department of Resource Development of State Bureau of Tourism Administration, Institute of Geographic Sciences and Natural Resources Research of CAS, 2017. Criterion of General Investigation of Tourism Resource in China (GB/T 18972-2017). Beijing: China Tourism Press. (in Chinese)
|
| [7] |
|
| [8] |
|
| [9] |
|
| [10] |
|
| [11] |
|
| [12] |
|
| [13] |
|
| [14] |
|
| [15] |
|
| [16] |
|
| [17] |
|
| [18] |
|
| [19] |
|
| [20] |
|
| [21] |
|
| [22] |
|
| [23] |
|
| [24] |
|
| [25] |
|
| [26] |
|
| [27] |
|
| [28] |
|
| [29] |
|
| [30] |
|
| [31] |
|
| [32] |
|
| [33] |
|
| [34] |
|
| [35] |
|
| [36] |
|
| [37] |
|
| [38] |
|
| [39] |
|
| [40] |
|
| [41] |
|
| [42] |
|
| [43] |
|
| [44] |
|
| [45] |
|
| [46] |
|
| [47] |
|
| [48] |
|
/
| 〈 |
|
〉 |
 High value; Low value
  High value
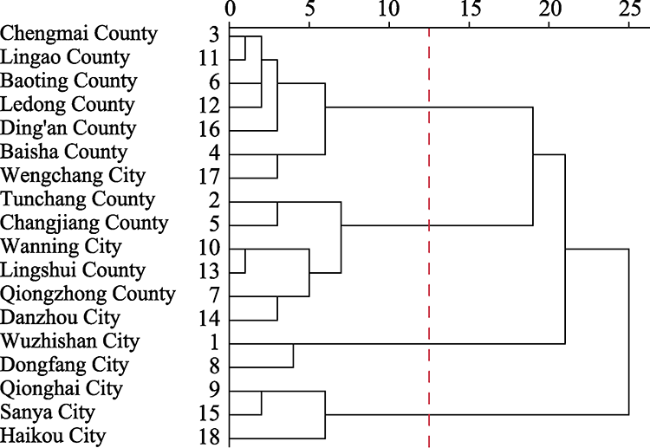