
Journal of Geographical Sciences >
Spatiotemporal evolution of PM2.5 concentrations in urban agglomerations of China
|
Wang Zhenbo, PhD and Associate Professor, specialized in urbanization. E-mail: wangzb@igsnrr.ac.cn |
Received date: 2021-01-02
Accepted date: 2021-03-20
Online published: 2021-08-25
Supported by
National Natural Science Foundation of China(41771181)
National Key Research and Development Plan(2017YFC0505702)
Open Fund Project of New Urbanization Research Institute of Tsinghua University(TUCSU-K-17015-01)
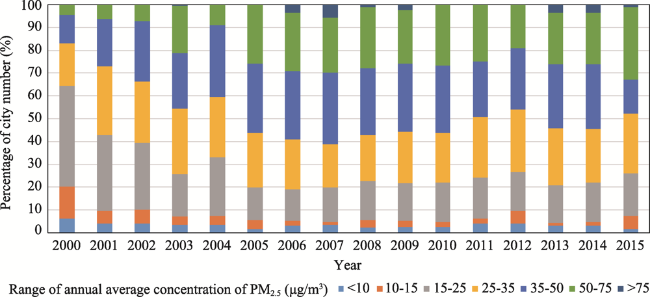
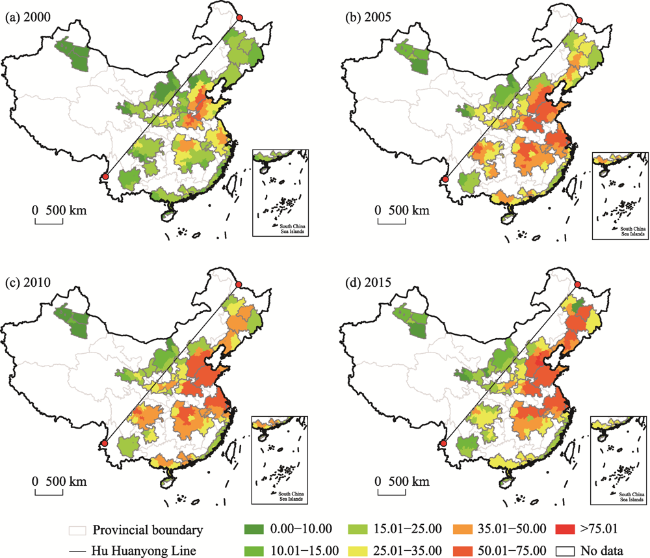
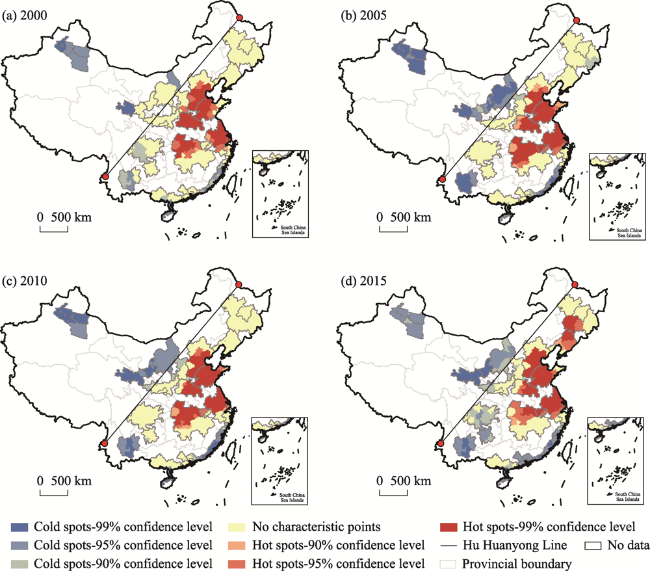
As the main form of new urbanization in China, urban agglomerations are an important platform to support national economic growth, promote coordinated regional development, and participate in international competition and cooperation. However, they have become core areas for air pollution. This study used PM2.5 data from NASA atmospheric remote sensing image inversion from 2000 to 2015 and spatial analysis including a spatial Durbin model to reveal the spatio-temporal evolution characteristics and main factors controlling PM2.5 in China’s urban agglomerations. The main conclusions are as follows: (1) From 2000 to 2015, the PM2.5 concentrations of China’s urban agglomerations showed a growing trend with some volatility. In 2007, there was an inflection point. The number of low-concentration cities decreased, while the number of high-concentration cities increased. (2) The concentrations of PM2.5 in urban agglomerations were high in the west and low in the east, with the “Hu Line” as the boundary. The spatial differences were significant and increasing. The concentration of PM 2.5 grew faster in urban agglomerations in the eastern and northeastern regions. (3) The urban agglomeration of PM2.5 had significant spatial concentrations. The hot spots were concentrated to the east of the Hu Line, and the number of hot-spot cities continued to rise. The cold spots were concentrated to the west of the Hu Line, and the number of cold-spot cities continued to decline. (4) There was a significant spatial spillover effect of PM2.5 pollution among cities within urban agglomerations. The main factors controlling PM2.5 pollution in different urban agglomerations had significant differences. Industrialization and energy consumption had a significant positive impact on PM2.5 pollution. Foreign direct investment had a significant negative impact on PM2.5 pollution in the southeast coastal and border urban agglomerations. Population density had a significant positive impact on PM2.5 pollution in a particular region, but this had the opposite effect in neighboring areas. Urbanization rate had a negative impact on PM2.5 pollution in national-level urban agglomerations, but this had the opposite effect in regional and local urban agglomerations. A high degree of industrial structure had a significant negative impact on PM2.5 pollution in a region, but this had an opposite effect in neighboring regions. Technical support level had a significant impact on PM2.5 pollution, but there were lag effects and rebound effects.
WANG Zhenbo , LIANG Longwu , WANG Xujing . Spatiotemporal evolution of PM2.5 concentrations in urban agglomerations of China[J]. Journal of Geographical Sciences, 2021 , 31(6) : 878 -898 . DOI: 10.1007/s11442-021-1876-2
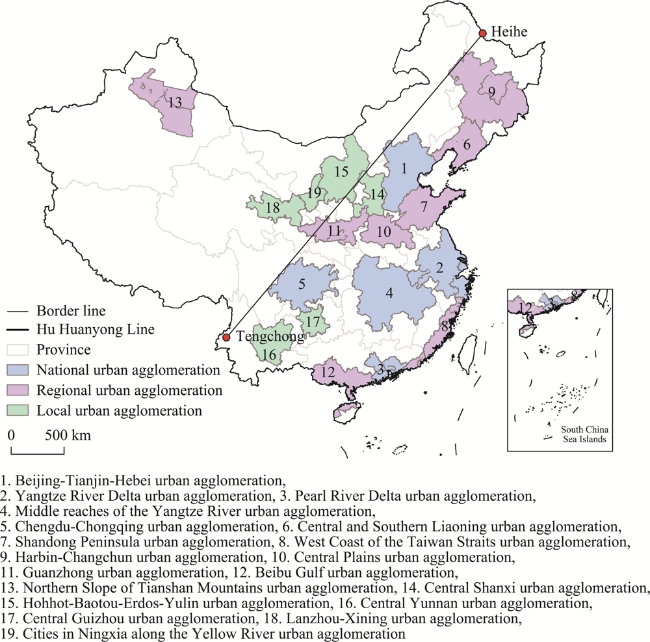
Figure 1 Map of urban agglomeration planning areas in China |
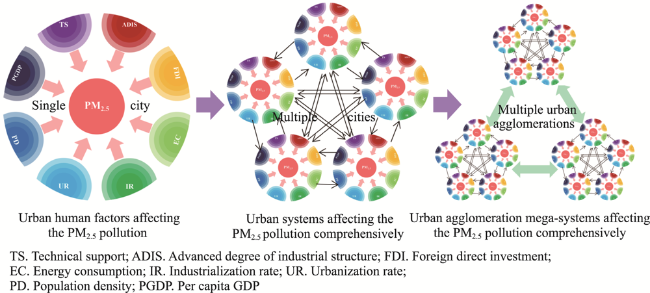
Figure 2 Interactive coupling of human elements comprehensively affecting PM2.5 pollution in China’s urban agglomerations |
Table 1 The collinearity test results of indexes |
| Index | Index | |||||||
|---|---|---|---|---|---|---|---|---|
| Per capita GDP | Population density | Urbanization rate | Industrialization rate | High degree of industrial structure | Dependence on foreign trade | Technical support | Energy consumption | |
| Per capita GDP | 1 | |||||||
| Population density | 0.017 | 1 | ||||||
| Urbanization rate | 0.002 | 0.061** | 1 | |||||
| Industrialization rate | 0.009 | 0.045** | 0.000 | 1 | ||||
| High degree of industrial structure | 0.036* | 0.166** | 0.054** | 0.049** | 1 | |||
| Dependence on foreign trade | 0.019 | 0.226** | 0.049** | 0.036* | 0.183** | 1 | ||
| Technical support | 0.161** | 0.096** | -0.018 | 0.006 | 0.070** | 0.109** | 1 | |
| Energy consumption | 0.010 | 0.014 | -0.007 | 0.002 | 0.031 | 0.003 | 0.019 | 1 |
Note: ** represents significant correlation at the 0.01 level on both sides and * represents the 0.05 level. The mean value of the condition index is 43.47; the variance inflation factors of each variable are all less than 3, with a mean value of 2.51. |
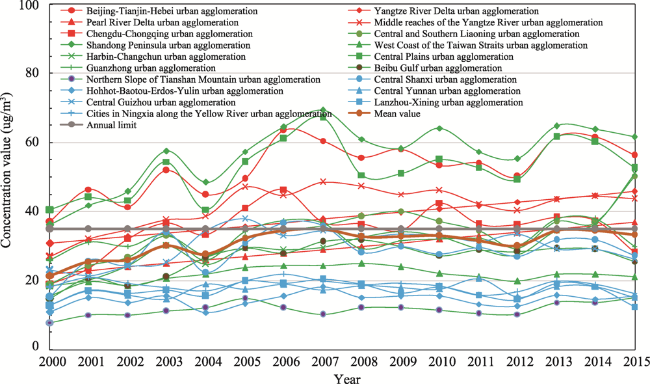
Figure 3 PM2.5 concentrations time series in China’s urban agglomerations for the period 2000-2015 |
Table 2 Standard values of PM2.5 concentrations set by the WHO and China |
| WHO Guidelines for Air Quality (2005) | China’s Ambient Air Quality Standard (GB3095-2012) (2016) | ||||
|---|---|---|---|---|---|
| Type | Annual average (μg/m3) | Daily average (μg/m3) | Type | Annual average (μg/m3) | Daily average (μg/m3) |
| Guideline level | 10 | 25 | Standard level | 35 | 75 |
| Interim target 1 | 35 | 75 | — | — | — |
| Interim target 2 | 25 | 50 | — | — | — |
| Interim target 3 | 15 | 37.5 | — | — | — |
Note: — indicates no corresponding value exists. |
Figure 4 Changing trend in proportions of annual average PM2.5 concentration range in China’s urban agglomerations for 2000-2015 |
Figure 5 Evolution of the spatial patterns in PM2.5 concentration (µg/m3) in China’s urban agglomerations for 2000-2015 |
Table 3 Spatial autocorrelation indexes of annual average PM2.5 concentrations in China’s urban agglomerations from 2000 to 2015 |
| Year | 2000 | 2001 | 2002 | 2003 | 2004 | 2005 | 2006 | 2007 | 2008 | 2009 | 2010 | 2011 | 2012 | 2013 | 2014 | 2015 |
|---|---|---|---|---|---|---|---|---|---|---|---|---|---|---|---|---|
| All | 0.82*** | 0.79*** | 0.77*** | 0.84*** | 0.74*** | 0.75*** | 0.80*** | 0.82*** | 0.76*** | 0.76*** | 0.78*** | 0.79*** | 0.79*** | 0.83*** | 0.81*** | 0.80*** |
| BTH | 0.33** | 0.41** | 0.41** | 0.39** | 0.36** | 0.37** | 0.36** | 0.36** | 0.33** | 0.33** | 0.33** | 0.33** | 0.34** | 0.35** | 0.35** | 0.34** |
| YRD | 0.68*** | 0.66*** | 0.68*** | 0.67*** | 0.68*** | 0.65*** | 0.66*** | 0.64*** | 0.69*** | 0.66*** | 0.66*** | 0.68*** | 0.67*** | 0.67*** | 0.67*** | 0.68*** |
| PRD | 0.13* | 0.16* | -0.10 | 0.20* | 0.18* | -0.16* | 0.11 | -0.14* | 0.13* | 0.15* | 0.17* | 0.12* | 0.14* | 0.17* | 0.25* | 0.23* |
| MYR | 0.84*** | 0.77*** | 0.55*** | 0.73*** | 0.19*** | 0.49*** | 0.57*** | 0.40*** | 0.38*** | 0.43*** | 0.59*** | 0.68*** | 0.41*** | 0.66*** | 0.64*** | 0.61*** |
| CC | 0.38** | 0.54*** | 0.32** | 0.30* | 0.31** | 0.27* | 0.19 | 0.23 | 0.15 | 0.12 | 0.19 | 0.20 | 0.20 | 0.19 | 0.12 | 0.19 |
| CSL | 0.11* | 0.11* | 0.12* | 0.28*** | 0.15* | 0.15* | 0.14* | 0.21** | 0.15* | 0.21** | 0.10 | 0.15* | 0.20** | 0.18** | 0.12* | 0.13* |
| SP | 0.44*** | 0.49*** | 0.46*** | 0.51*** | 0.48*** | 0.54*** | 0.53*** | 0.50*** | 0.49*** | 0.51*** | 0.58*** | 0.53*** | 0.53*** | 0.52*** | 0.53*** | 0.47*** |
| WTS | 0.25* | -0.16* | -0.29 | 0.10* | -0.14 | 0.11* | 0.24 | 0.12* | 0.10 | 0.24* | 0.11* | 0.10* | 0.17 | 0.11* | 0.13* | 0.21 |
| HC | 0.55** | 0.67*** | 0.57*** | 0.62*** | 0.74*** | 0.74*** | 0.71*** | 0.75*** | 0.81*** | 0.72*** | 0.68*** | 0.77*** | 0.75*** | 0.61*** | 0.61*** | 0.52*** |
| CCP | 0.55*** | 0.52*** | 0.28* | 0.41** | 0.42** | 0.38** | 0.41** | 0.47** | 0.47** | 0.49*** | 0.48*** | 0.42** | 0.41** | 0.45*** | 0.53*** | 0.49*** |
| GZ | -0.41* | -0.31* | -0.09* | -0.13 | -0.23* | 0.09* | 0.11* | 0.19** | 0.12* | 0.10 | 0.09* | 0.08 | 0.10* | 0.11 | 0.10* | 0.11* |
| BG | 0.79*** | 0.76*** | 0.85*** | 0.92*** | 0.93*** | 0.93*** | 0.93*** | 0.87*** | 0.97*** | 0.95*** | 0.96*** | 0.96*** | 0.97*** | 0.92*** | 0.93*** | 0.90*** |
| CS | 0.23* | -0.10* | -0.44 | -0.59* | -0.52* | -0.10 | -0.34* | -0.25* | 0.20 | 0.12* | 0.31* | 0.11* | 0.13* | 0.10* | 0.12 | 0.15* |
| HBEY | -0.18* | 0.15 | -0.43 | -0.77* | -0.78* | -0.56* | -0.47* | -0.36 | 0.58* | 0.79* | 0.67* | 0.50* | 0.91* | 0.87* | 0.88* | 0.93* |
| CY | 0.42* | 0.46* | 0.57* | 0.85* | 0.87* | 0.65* | 0.13* | 0.80* | 0.61* | 0.73* | 0.81* | 0.45* | 0.82* | 0.78* | 0.67* | 0.73* |
| CG | -0.45* | 0.10 | -0.42* | -0.17* | -0.16* | -0.16* | -0.17* | -0.10 | 0.11 | 0.25* | 0.26* | 0.24 | 0.23* | 0.38* | 0.19* | 0.29* |
| LX | 0.81** | 0.81** | 0.83** | 0.79** | 0.76** | 0.90** | 0.87** | 0.84** | 0.77** | 0.67* | 0.59* | 0.74** | 0.66* | 0.68* | 0.75** | 0.76** |
| NX | 0.33* | 0.19* | 0.13 | 0.18* | 0.23* | 0.23* | 0.15* | 0.25* | 0.30* | 0.22 | 0.28* | 0.21* | 0.25* | 0.12 | 0.21* | 0.32* |
Note: * represents 10% significance level; ** represents 5% significance level; *** represents 1% significance level. |
Figure 6 Spatial clustering characteristics of PM2.5 concentrations in China’s urban agglomerations for 2000-2015 |
Table 4 Results of different factors influencing PM2.5 pollution in China's urban agglomerations from 2000 to 2015 |
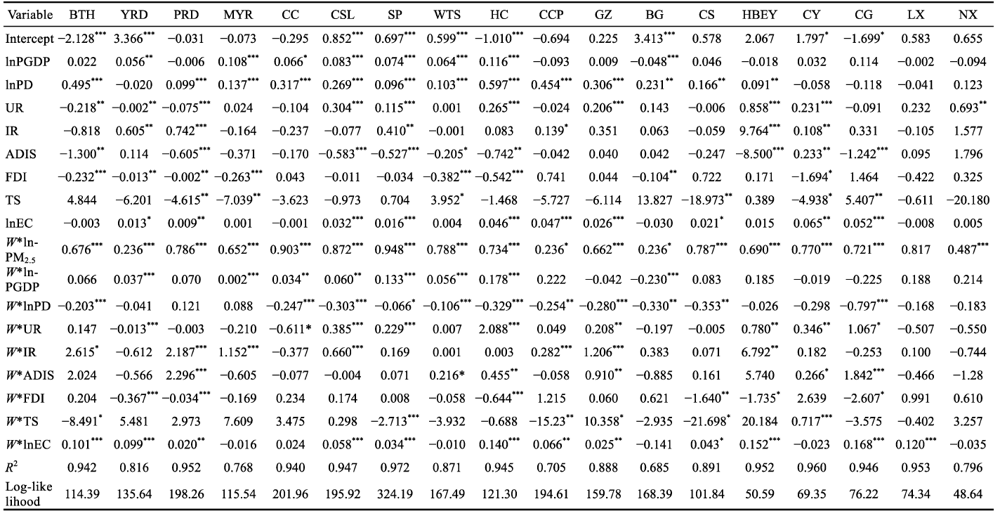 |
Note: * represents 10% significance level; ** represents 5% significance level; *** represents 1% significance level. Due to significant data missing in Northern Slope of Tian-shan Mountains, this area could not be analyzed. |
| [1] |
|
| [2] |
|
| [3] |
|
| [4] |
|
| [5] |
|
| [6] |
|
| [7] |
|
| [8] |
|
| [9] |
|
| [10] |
|
| [11] |
|
| [12] |
|
| [13] |
|
| [14] |
|
| [15] |
|
| [16] |
|
| [17] |
|
| [18] |
|
| [19] |
|
| [20] |
|
| [21] |
|
| [22] |
|
| [23] |
|
| [24] |
|
| [25] |
|
| [26] |
|
| [27] |
|
| [28] |
Ministry of Environmental Protection MEP of the People’s Republic of China. Ambient Air Quality Standards (on trial), 2012. National Environmental Protection Standards of the People’s Republic of China (GB3095-2012), 2012-02-29. (in Chinese)
|
| [29] |
|
| [30] |
|
| [31] |
|
| [32] |
|
| [33] |
|
| [34] |
|
| [35] |
|
| [36] |
|
| [37] |
|
| [38] |
|
| [39] |
|
| [40] |
|
| [41] |
|
| [42] |
|
| [43] |
|
| [44] |
|
| [45] |
|
| [46] |
|
| [47] |
|
| [48] |
|
| [49] |
|
| [50] |
|
/
| 〈 |
|
〉 |