Research Articles

Effect of human settlements on urban thermal environment and factor analysis based on multi-source data: A case study of Changsha city

  • XIONG Ying , 1, 2, 3 ,
  • ZHANG Fang 1
Expand
  • 1. College of Architecture, Changsha University of Science and Technology, Changsha 410076, China
  • 2. Hunan Key Lab of Land Resource Evaluation & Utilization, Changsha 410007, China
  • 3. Research Center of Resource Environment and Urban Planning, Changsha 410114, China

Xiong Ying (1977-), Professor, specialized in land use and urban sprawl, regional and urban planning. E-mail:

Received date: 2021-01-27

  Accepted date: 2021-03-20

  Online published: 2021-08-25

Supported by

National Social Science Foundation of China(15BJY051)

Open Topic of Hunan Key Laboratory of Land Resources Evaluation and Utilization(SYS-ZX-202002)

Research Project of Appraisement Committee of Social Sciences Research Achievements of Hunan Province(XSP18ZDI031)

Abstract

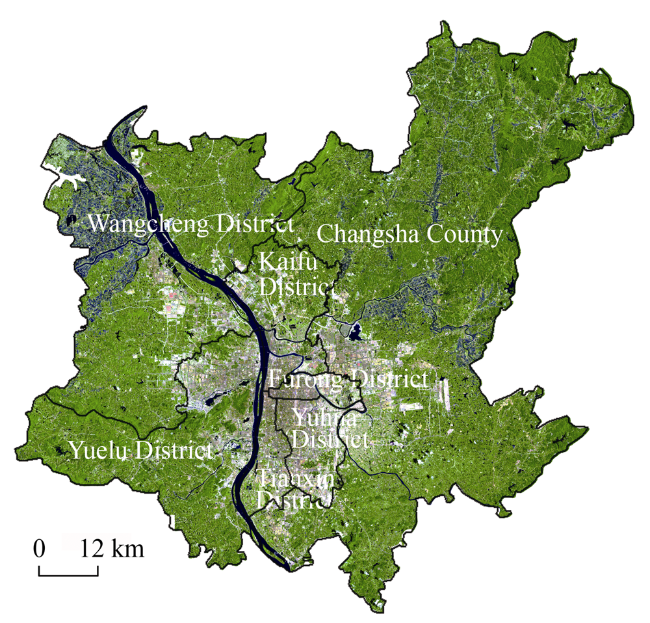
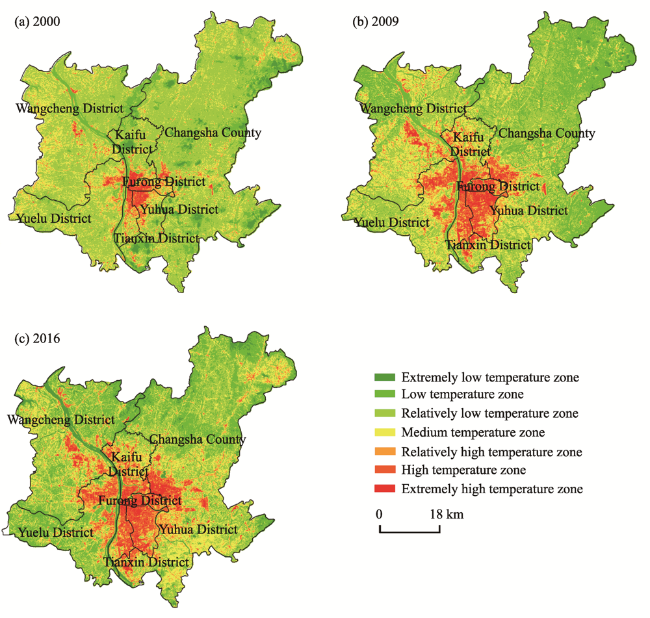
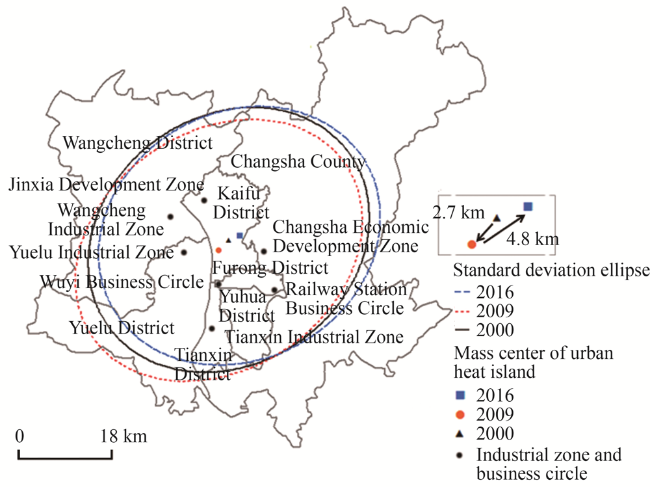
In view of the lack of comprehensive evaluation and analysis from the combination of natural and human multi-dimensional factors, the urban surface temperature patterns of Changsha in 2000, 2009 and 2016 are retrieved based on multi-source spatial data (Landsat 5 and Landsat 8 satellite image data, POI spatial big data, digital elevation model, etc.), and 12 natural and human factors closely related to urban thermal environment are quickly obtained. The standard deviation ellipse and spatial principal component analysis (PCA) methods are used to analyze the effect of urban human residential thermal environment and its influencing factors. The results showed that the heat island area increased by 547 km2 and the maximum surface temperature difference reached 10.1℃ during the period 2000-2016. The spatial distribution of urban heat island was mainly concentrated in urban built-up areas, such as industrial and commercial agglomerations and densely populated urban centers. The spatial distribution pattern of heat island is gradually decreasing from the urban center to the suburbs. There were multiple high-temperature centers, such as Wuyi square business circle, Xingsha economic and technological development zone in Changsha County, Wangcheng industrial zone, Yuelu industrial agglomeration, and Tianxin industrial zone. From 2000 to 2016, the main axis of spatial development of heat island remained in the northeast-southwest direction. The center of gravity of heat island shifted 2.7 km to the southwest with the deflection angle of 54.9° in 2000-2009. The center of gravity of heat island shifted to the northeast by 4.8 km with the deflection angle of 60.9° in 2009-2016. On the whole, the change of spatial pattern of thermal environment in Changsha was related to the change of urban construction intensity. Through the PCA method, it was concluded that landscape pattern, urban construction intensity and topographic landforms were the main factors affecting the spatial pattern of urban thermal environment of Changsha. The promotion effect of human factors on the formation of heat island effect was obviously greater than that of natural factors. The temperature would rise by 0.293℃ under the synthetic effect of human and natural factors. Due to the complexity of factors influencing the urban thermal environment of human settlements, the utilization of multi-source data could help to reveal the spatial pattern and evolution law of urban thermal environment, deepen the understanding of the causes of urban heat island effect, and clarify the correlation between human and natural factors, so as to provide scientific supports for the improvement of the quality of urban human settlements.

Cite this article

XIONG Ying , ZHANG Fang . Effect of human settlements on urban thermal environment and factor analysis based on multi-source data: A case study of Changsha city[J]. Journal of Geographical Sciences, 2021 , 31(6) : 819 -838 . DOI: 10.1007/s11442-021-1873-5

1 Introduction

In the process of rapid urbanization, human activities such as urban transportation, industrial production, and residents’ life consume a lot of fuel. Due to inefficient utilization and disordered management, the “three wastes” generated are discharged into the urban ecosystem in the form of “non-point source”, resulting in the prominent problems of urban human settlements (Shenet al., 2012), and accelerating the generation and expansion of urban heat island (UHI) effect. The UHI effect can bring many hazards, such as affecting human comfort because of long-term high temperature, increasing the frequency of high-temperature heat wave weather, intensifying the degree of urban air pollution caused by heat island circulation, which influence significantly the construction of healthy, comfortable, livable, and sustainable urban living environment. Thermal environment is not only directly related to the quality of urban living environment and residents’ health status, but also has a profound impact on the consumption of urban energy and water resources, the evolution of ecosystem process, biological phenology, and the sustainable development of urban economy (Akbariet al., 2001; White et al., 2002; Grimm et al., 2008; Kovats and Hajat, 2008). The thermal environment effect of urban human settlements has presently become one of the hot spots in geography, environmental science, urban planning, architecture and other disciplines (Peng et al., 2013).
Recently, more and more researches have been carried out at home and abroad on the effect of urban human settlements on the thermal environment and its influencing factors. Bokaie et al. (2016) found that the urban surface heterogeneity caused by the replacement of natural surface by impervious surface is the root cause for the UHI effect formation. Baldingelli and Bonafoni (2015) found that the decrease of surface albedo of urban underlying surface is also an important reason for the UHI formation. Yuan and Bauer (2007) analyzed the quantitative relationship between surface temperature, vegetation coverage, and impervious surface by using TM/ETM+ images at three different seasons in Minnesota, the United States. Grover and Singh (2015) built the fitting relationship between the spatial pattern of the UHI and Normalized Difference Vegetation Index (NDVI), and found that the negative correlation between NDVI and heat island effect was more obvious based on the retrieved urban surface temperature using Landsat 7 remote sensing image in Mumbai and Delinha. Zhou (2006) studied the effect of urban expansion and the landscape pattern change on the spatial distribution of UHI effect on the basis of analyzing the evolution of Beijing’s urban landscape pattern. Zhanget al. (2006) collected vegetation cover, underlying surface type and surface temperature based on Landsat ETM+ data in Shenzhen, and analyzed the relationship between the surface temperature and underlying surface information. This study found that the intensity of UHI effect was significantly affected by underlying surface and vegetation coverage. Xiao (2016) analyzed the influence of remote sensing index on surface temperature change. The results showed that the extracted remote sensing index was related to surface temperature change, and the correlation coefficients from high to low were respectively Normalized Difference Impervious Surface Index (NDISI), Normalized Difference Building Index (NDBI), Modified Normalized Difference Water Index (MNDWI), and NDVI. Although domestic and foreign scholars have carried out a lot of research on the impact mechanism of urban residential thermal environment, and achieved fruitful results. However, the current researches mostly studied a single influencing factor, and lacked analysis from the natural and cultural perspectives, including landscape pattern, urban construction, topographic landforms, and socio-economic activities. The reason is that the study of urban residential thermal environment involves many disciplines such as geography, meteorology, urban planning, computer science, geostatistics, and so on, traditional methods and data sources cannot effectively make full use of many relatively independent knowledge.
Therefore, with the support of RS and GIS technology, this study takes the remote sensing image data, POI spatial big data as the data sources, then uses standard deviation ellipse and spatial principal component analysis (PCA) methods to explore the urban residential thermal environment effect and its influencing factors, and identify the relationship between the natural and human multidimensional factors and the urban thermal environment effect, in order to better understand the urban thermal environment pattern and evolution, understand the inherent law of development of urban thermal environment factor and driving mechanism, for the urban planning, urban construction and improving the quality of living environment for providing theoretical basis and decision support.

2 Study area and data sources

2.1 Study area

Changsha city is located in the northeast of Hunan Province, the lower reaches of Xiangjiang River and the western Xiangliu basin, with an altitude of ‒16.8 to 326.1 m, as shown in Figures 1 and 2. Changsha has a subtropical monsoon climate, which is hot in summer and cold in winter. The average annual temperature in the urban area is about 17.2℃, and the average annual precipitation in the urban area is about 1361.6 mm. Due to the rapid expansion of urban construction areas in recent years (Zhou and He, 2006), and the continuous increases of car ownership and total urban energy consumption, the study area is facing obvious thermal environmental problems, thus becoming one of the “four furnaces” of the country. According to the statistical data from 1951 to 2014, the average annual high temperature days in Changsha are up to 30.6 and the average annual high temperature heat wave event reaches 2.16 times, revealing the serious UHI effect (Fu et al., 2016). How to alleviate the effect of urban thermal environment and improve the quality of urban living environment is an urgent and realistic problem in pursuing the urban development of Changsha.
Figure 1 The study area (Changsha city)
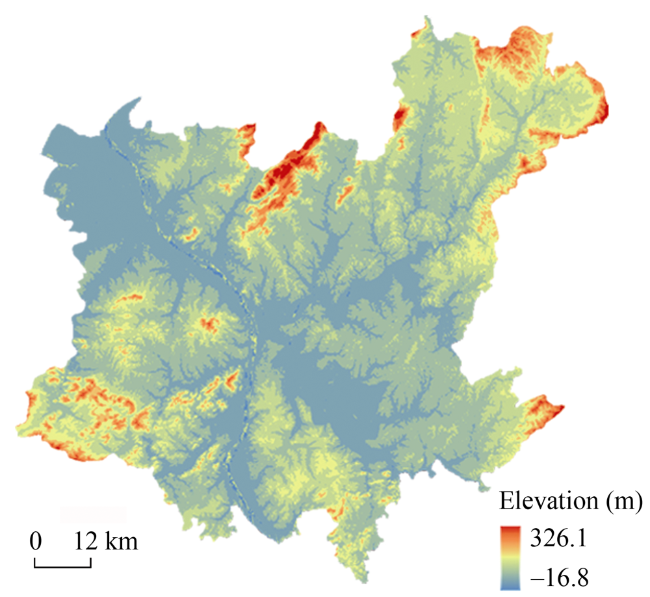
Figure 2 DEM of Changsha city
Changsha city includes six districts and three counties. The six administrative districts (Yuelu district, Kaifu district, Furong district, Yuhua district, Tianxin district, and Wangcheng district) and Changsha county are selected as the study area, because of the large distance between Liuyang and Ningxiang city downtown and the main urban areas of Changsha city. The study area totals about 3903.39 km2 with a resident population of 5.356 million at the end of 2018.

2.2 Data sources and preprocessing

In this study, we selected Landsat 5 TM images with a strip number of 123 and shape numbers of 40 and 41 at 10:33 a.m. on July 22, 2000 and 10:46 a.m. on August 21, 2009, and Landsat 8 OLI multi-spectral and thermal infrared remote sensing images with a strip number of 123 and shape numbers of 40 and 41 at 10:58 a.m. on July 23, 2016. The time of collected remote sensing image data is hot summer with clear weather, and the cloud cover is less than 10% with high quality remote sensing image data sources. The remote sensing image is preprocessed by Envi software versions 5.3, such as radiometric calibration, atmospheric correction, and study area clipping. In addition, 13 types of POI data of Changsha city in 2016 were collected on the map of Gaode by using Geosharp1.0 software, including catering, life and entertainment, scenic spots, public service facilities, companies and enterprises, shopping centers, science, education and sports, finance and insurance, business housing, government agencies, accommodation, sports and leisure, medical care and so on. The preprocessing of projection conversion, mosaic, and clipping of DEM data were implemented using ArcGIS10.5 software. Administrative boundary of Changsha city is also collected as the data sources. All data were uniformly transformed into the horizontal Mercato projection with the WGS84 ellipsoid and the spatial resolution of 30 m. All data were uniformly incorporated into the GIS database. All data sources are shown in Table 1.
Table 1 Data sources
Data series Name of the data Data source Use Time
Remote sensing
data
Landsat 5 TM, Landsat 8 OLI TIRS http://www.gscloud Inversion of surface temperature and extraction of surface
information
2000.7; 2009.8; 2016.7
DEM http://www.gscloud Calculation of elevation and slope 2016
Vector data Administrative boundary vector data of Changsha city China Earth System Science Data Sharing Network Extraction of boundary of the
study area
2016
Big spatial data POI data of Changsha city Scott map Extraction of index of economic activity 2016

3 Methodology

3.1 Retrieval of surface temperature

In this study, thermal infrared band 6 of Landsat 5 TM and TIRS band 10 of Landsat 8 OLI are used to retrieve surface temperature. The thermal infrared radiation luminance value L received by the satellite airborne sensor is composed of the radiant luminance values of Lup, Ldown and ground radiation reaching the sensor after passing through the atmospheric conduction. The calculation equations are presented as follows (Jin and Gong, 2018):
$L=\left[ \varepsilon B({{T}_{S}})+(1-\varepsilon ){{L}_{down}} \right]\tau +{{L}_{up}}$
${{T}_{s}}={{K}_{2}}/\text{ln}(1+{{K}_{1}}/B({{T}_{s}}))$
where B(Ts) is the blackbody thermal radiance, Ts is the surface temperature, Lup is the atmospheric upward radiance, Ldown is the atmospheric downward radiance, and K1 andK2 are constants. Landsat 5 TM thermal infrared band 6Lup was 0.38W/(m2•sr•μm),Ldown was 3.65 W/(m2•sr•μm),K1 was 607.76, and K2 was 1260.56. Landsat 8 OLI thermal infrared band 10Lup was 1.25 W/(m2•sr•μm),Ldown was 2.37 W/(m2•sr•μm),K1 was 774.89, and K2 was 1321.08.

3.2 Index calculation of representing surface information

(1) NDISI can be used to represent the impervious surface. Impervious surface is the main component of the urban underlying surface, such as traffic roads, building roofs, which can prevent water from penetrating below the ground. The calculation equation of NDISI is shown below (Xu, 2008):
$N D I S I=\frac{T I R S 1-(M N D W I+N I R+S W I R 1) / 3}{T I R S 1+(M N D W I+N I R+S W I R 1) / 3}$
(2) FVC is the proportion of the vertical projected area of ground vegetation leaves in the calculated total area. Its calculation equation is as follows:
$FVC={{\left[ \frac{NDVI-NDV{{I}_{\text{min}}}}{NDV{{I}_{\max }}-NDV{{I}_{\min }}} \right]}^{2}}$
$NDVI=\frac{NIR-Red}{NIR+Red}$
(3) MNDWI is used to process the image bands representing water information. The calculation equation is as follows:
$MNDWI=\frac{Green-SWIR1}{Green+SWIR1}$
(4) NDBBI can help directly remove water body and vegetation information for obtaining bare land and built-up land information.
$NDBBI=\frac{\text{1}\text{.5}SWIR2-(NIR+Green)/2}{\text{1}\text{.5}SWIR2+(NIR+Green)/2}$
where Green, Red, NIR, SWIR1, SWIR2, and TIRS1 correspond respectively to bands 3, 4, 5, 6, 7, and 10 in Landsat8 OIL remote sensing image.
(5) Landscape pattern index of representing landscape structure characteristics and spatial pattern is used to study the distribution characteristics and changes of landscape and to build the relationship between landscape structure and spatial pattern. It is the most important indicator in landscape ecological research (Zheng and Fu, 2010). This study chooses the four landscape indexes closely related to UHI.
① Contagion index (CONTAG) describes the aggregation degree and expansion degree of different patch types in landscape pattern. The calculation equation is as follows:
$CONTAG=\left[ \text{1}+\frac{\sum\limits_{i=1}^{m}{\sum\limits_{k=1}^{m}{\left[ ({{p}_{i}})(\frac{{{g}_{ik}}}{\sum\limits_{k=1}^{m}{{{g}_{ik}}}}) \right]\cdot \left[ \ln ({{p}_{i}})(\frac{{{g}_{ik}}}{\sum\limits_{k=1}^{m}{{{g}_{ik}}}}) \right]}}}{2\ln (m)} \right]\times (100)$
where pi is the proportion of patch type, gik is the connection coefficient between pixels of patch type i and k, and m is the number of current patch types.
② Shannon diversity index (SHDI) depicts the diversity of landscape types. Its calculation formula is as follows:
$S H D I=-\sum_{i=1}^{n} p_{i} \times \ln p_{i}$
where n is the number of landscape patches, pi is the proportion of landscape patch type area to the total landscape patch area.
③ DIVISION describes the dispersion degree of each patch distribution in a certain landscape type. The calculation formula is as follows:
$D I V I S I O N=\frac{D_{i}}{A_{i}}$
where Di is the distance of type i, and Ai is the area of type i.
④ COHESION describes a measure of the physical connectivity between patch types. The calculation equation is as follows:
$\text { COHESION }=\left[1-\frac{\sum_{i=1}^{m} \sum_{j=1}^{n} p_{i j}}{\sum_{i=1}^{m} \sum_{j=1}^{n} p_{i j} \sqrt{a_{i j}}}\right]\left[1-\frac{1}{\sqrt{A}}\right]^{-1} \times(100)$
wherepij is the proportion of the ij plaque type; aij is the number of pixels of the ij patch; A is the total number of pixels.
The above four indexes are calculated by Fragstats4.2 based on the land use type of the study area. The land use type is obtained by supervised classification method. The overall accuracy is 91.20%, and the Kappa coefficient is 0.88, meeting the use requirements.
(6) Albedo is the ratio of incident solar radiation energy that can be reflected by the earth’s surface. It is an important parameter to determine the solar radiation energy absorbed by the surface and the surface energy budget.
$\text { Albedo }=\left(0.356 a_{2}+0.13 a_{4}+0.373 a_{5}+0.085 a_{6}+0.072 a_{7}\right) / 225-0.0018$
whereai is the gray value of the ith band of Landsat 8 image.
(7) Elevation refers to the lead-straight distance from the ground point to the height starting surface. Temperature is highly correlated with elevation, that is, for every 100 m rise in elevation, the temperature decreases by about 0.6℃.
(8) Slope refers to the amplitude of surface relief in an area, which is calculated using slope analysis tool in the ArcGIS10.5 software.
(9) The socio-economic activity index can be used to evaluate the impact of socio-economic activities on urban thermal environment. In this study, the POI data of Changsha city is used to characterize the socio-economic activity index. The spatial point information of urban socio-economic departments carried by POI data can not only represent the spatial pattern of human land system elements, but also provide the information of human activities and socio-economic activities hidden in the attributes of departments, which provides the possibility for researchers to quantitatively explore the spatial distribution information of human activities (Xue et al., 2019). The density analysis tool in ArcGIS10.5 software was used to calculate the socio-economic activity index.

3.3 Spatial PCA

Based on the natural and human factors that affect the distribution pattern of urban land surface temperature, this study uses SPSS version 24.0 and ArcGIS10.5 software to conduct correlation and spatial PCA analysis. Spatial PCA is a method to change many indexes into several independent comprehensive indexes (Lu, 2004). The principal components in the multivariate system are independent indicators, and the principal components are ranked from large to small according to their contribution rates (Pan et al., 2011; Feng et al., 2012).

3.4 Standard deviation ellipse

The standard deviation ellipse method is a spatial econometric analysis method to study the spatial distribution characteristics and direction differences of spatial data. The length of main axis indicates the spatial distribution direction and agglomeration dispersion degree of data, and the angle of rotation represents the dominant trend direction of spatial data change (Zhao and Zhao, 2014). This paper uses the standard deviation ellipse method to analyze the evolution of standard deviation ellipse of thermal environment in 2000, 2009 and 2016, and to identify the development direction and moving track of UHI.

4 Results

4.1 Evolution characteristics of urban thermal environment

4.1.1 Surface temperature classification

In order to directly describe the difference of surface temperature in the study area, the standard deviation method is used to divide the surface temperature into seven categories in Table 2: extremely low temperature, low temperature, relatively low temperature, medium temperature, relatively high temperature, high temperature, and extremely high temperature. According to the statistical results in 2016, the average surface temperature is 36.9℃, and the surface temperature of 92% of the area is between 31℃ and 42℃, which is consistent with the air temperature of that day (29-37℃), indicating that the land surface temperature retrieved by this method is reliable. The relatively high temperature zone, high temperature zone and extremely high temperature zone in this study are classified as UHI areas.
Table 2 Classification of surface temperature
Temperature rating Extremely low temperature zone Low
temperature zone
Relatively low temperature zone Medium
temperature zone
Relatively high temperature zone High
temperature zone
Extremely high temperature zone
Temperature range $T<u-2.5std$ $\begin{matrix} & u-2.5std \le T \\ & <u-1.5std \\ \end{matrix}$ $\begin{matrix} & u-1.5std \le T \\ & <u-0.5std \\ \end{matrix}$ $\begin{matrix} & u-0.5std \le T \\ & <u+0.5std \\ \end{matrix}$ $\begin{matrix} & u+0.5std \le T \\ & <u+1.5std \\ \end{matrix}$ $\begin{matrix} & u+1.5std \le T \\ & <u+2.5std \\ \end{matrix}$ $T\ge u+2.5std$

Note: u represents the mean value of surface temperature in the study area, and std represents the standard deviation of surface temperature.

4.1.2 Spatial distribution characteristics of urban thermal environment

The spatial distribution of UHI in Changsha city in 2000, 2009 and 2016 is shown in Figure 3. The spatial pattern of UHI reveals an irregular circular distribution, and the surface temperature gradually changes from the center to the surrounding areas. The highest temperature occurs in the areas with dense industrial buildings and concentrated pedestrian flow, i.e. Changsha Economic Development Zone, Xingsha industrial base, and railway station business circle. The lowest temperature zones are concentrated in Xiangjiang river water area and northeast forest park. The spatial distribution characteristics of UHI in the three periods are similar, that is, the four temperature zones representing the UHI covered scope are mainly found in the built-up areas with high population density and along the urban traffic roads. The relatively low temperature zones are mainly distributed in the vegetation covered areas such as rivers, parks, green spaces, and lakes. However, the mountainous areas of Xiangjiang River and Changsha county basically belong to low temperature and extremely low temperature zones, showing obvious “cold island” effect. It can be found that the medium temperature zone, relatively high temperature zone, high temperature zone and extremely high temperature zone in 2000-2016 continue to expand along the urban built-up area, and the extension direction of the UHI area is basically the same as that of the built-up area of Changsha city.
Figure 3 Spatial distribution of UHI in Changsha city in 2000, 2009 and 2016
The UHI area in Changsha was relatively small, and its average surface temperature 34.5℃ in 2000. The high temperature zones were concentrated in the old urban areas (Furong district, Yuhua district, Tianxin district, Kaifu district, Yuelu district) as well as Wangcheng district and Changsha county urban built-up area. The maximum surface temperature in urban area reached 52.5℃. The average temperature of “cold island” such as mountains was 32.2℃, a 20.3℃ difference compared to the highest surface temperature, and the average temperature of water body was 22.3℃, lower than that of the urban surface. The high temperature zone showed an irregular ring expansion in 2009, and the average surface temperature increased by 1.4℃ compared with that in 2000. Most of the central area of the city was covered in UHI area. The average surface temperature of the study area was 35.9℃, and the temperature of mountains and waters in the urban area increased to 32.8℃ and 31.3℃. Changsha Economic Development Zone, Xingsha industrial base and railway station business circle are obvious high temperature concentrated areas, with the highest surface temperature of 59.8℃. The distribution of high temperature zones in Changsha city in 2016 further expanded, and the average surface temperature of the study area reached 36.9℃. The UHI center was transferred to Changsha Economic Development Zone and Xingsha industrial base, and the highest surface temperature was 63.3℃.
Figure 4 shows that the spatial development axis of UHI in 2000-2016 kept in the northeast-southwest direction. From 2000 to 2009, the center of gravity of UHI shifted 2.7 km to the southwest, and the deflection angle was 54.9° due to the rapid development of Yuelu high tech zone and Jinxia development zone in northern Changsha. From 2009 to 2016, the center of gravity of the UHI shifted 4.8 km to the northeast with a deflection angle of 60.9°, mainly due to the development of Xingsha development zone, which changed the spatial pattern of thermal environment. There is generally a certain correlation between the change of spatial pattern of thermal environment and the change of urban construction intensity.
Figure 4 Development direction and centroid migration of UHI in Changsha city in 2000, 2009, and 2016

4.1.3 Temporal evolution characteristics of urban thermal environment

In order to understand the spatio-temporal evolution of UHI in Changsha, the area and proportion of differnet temperature categories in 2000, 2009 and 2016 were calculated in Table 3. The proportions of relatively low temperature zone in Changsha in 2000, 2009 and 2016 were respectively 59.57%, 36.64% and 32.34%. The proportion of relatively low temperature zone gradually decreased from 2000 to 2016, with a decrease rate of nearly 50%, showing a change from relatively low temperature zone to medium temperature zone. At the same time, the area of UHI in Changsha has also changed significantly. The total area of UHI in 2000 was 1060 km2, increased to 1481 km2 in 2009, reached 1607 km2 in 2016, and increased by 547 km2from 2000 to 2016, with an increase rate of 51.6%. The area of medium temperature zone increased from 781.76 km2 in 2000 to 871.76 km2 in 2009, and reached 852.05 km2 in 2016. From 2000 to 2016, the area of medium temperature zone showed an overall growth trend. Compared with 2000, the area of relatively high temperature zone increased by about 1.1 times in 2016, and increased by about 100 km2 in 2009. The high temperature area shows a continuous and rapid growth trend, which increased by 213.46 km2 from 2000 to 2016, or 3.3 times of increase, at an average annual rate of 9.5%. The area of high temperature area in 2009 is three times more than that in 2000. From 2000 to 2016, it increased by 72.27 km2, or 2.19 times of increase compared with 2000, which showed a decreasing trend from 2009 to 2016.
Table 3 Area (km2) and proportion (%) of different temperature categories in 2000, 2009, and 2016
Year Extremely low Low Relatively low Medium Relatively high High Extremely high
Area Proportion Area Proportion Area Proportion Area Proportion Area Proportion Area Proportion Area Proportion
2000 76.04 1.93 456.42 11.59 2346.89 59.57 781.76 19.84 180.58 4.58 64.75 1.64 33.07 0.84
2009 11.67 0.30 1003.43 25.47 1443.27 36.64 871.28 22.12 280.12 7.11 227.68 5.78 102.07 2.59
2016 149.68 3.80 908.47 23.06 1274.13 32.34 852.05 21.63 371.64 9.43 278.21 7.06 105.34 2.67
The average UHI area of Yuhua, Furong and Tianxin districts in recent 16 years exceeded 80% (Table 4 and Figure 5). The area of UHI in 2009 increased significantly compared with 2000, while the UHI area of other administrative districts changed little or increased slowly except Changsha county in 2016 compared with 2009. The reason for the increase of UHI area in Changsha county was mainly due to the essential effect of the rapid development of urban construction (e.g. road infrastructure, real estate, industrialization) of Xingsha economic and technological development zone, and the UHI effect spread from the central urban areas to the surroundings.
Table 4 Statistics of surface temperature categories in administrative districts of Changsha city (km2)
Category
(temperature zone)
Furong Tianxin Yuelu Kaifu
2000 2009 2016 2000 2009 2016 2000 2009 2016 2000 2009 2016
Extremely low 0.15 0.00 0.49 0.00 0.00 6.12 0.00 0.00 17.67 6.85 0.09 7.86
Low 0.79 0.39 0.95 7.42 6.15 1.85 27.41 43.35 160.79 28.27 16.24 15.77
Relatively low 5.53 1.40 0.80 23.41 4.12 3.64 304.21 194.52 145.28 105.07 40.88 36.57
Medium 8.91 4.45 2.30 17.06 11.68 9.72 139.86 162.65 80.28 28.03 62.51 50.41
Relatively high 13.39 9.15 8.78 14.02 16.26 16.52 34.94 55.74 62.31 13.59 37.60 42.48
High 8.98 16.99 16.29 9.85 26.46 28.14 10.31 47.48 45.48 6.77 27.05 32.25
Extremely high 5.93 11.30 14.06 3.75 10.86 9.53 3.33 16.33 8.26 7.61 11.83 10.86
Category
(temperature zone)
Yuhua Wangcheng Changsha
2000 2009 2016 2000 2009 2016 2000 2009 2016
Extremely low 1.63 0.00 0.24 1.04 0.02 65.80 66.37 11.55 51.51
Low 7.96 0.30 1.30 83.00 213.84 249.37 301.57 723.16 478.44
Relatively low 38.20 3.20 3.70 582.09 361.73 347.29 1288.38 837.42 736.84
Medium 24.50 13.72 9.03 275.08 304.85 211.57 288.31 311.42 488.74
Relatively high 18.44 21.57 24.15 35.62 68.61 69.31 50.59 71.20 148.09
High 12.87 42.28 51.56 6.04 27.05 32.25 9.92 40.38 72.24
Extremely high 7.48 30.00 21.09 2.61 9.39 9.89 2.35 12.38 31.64
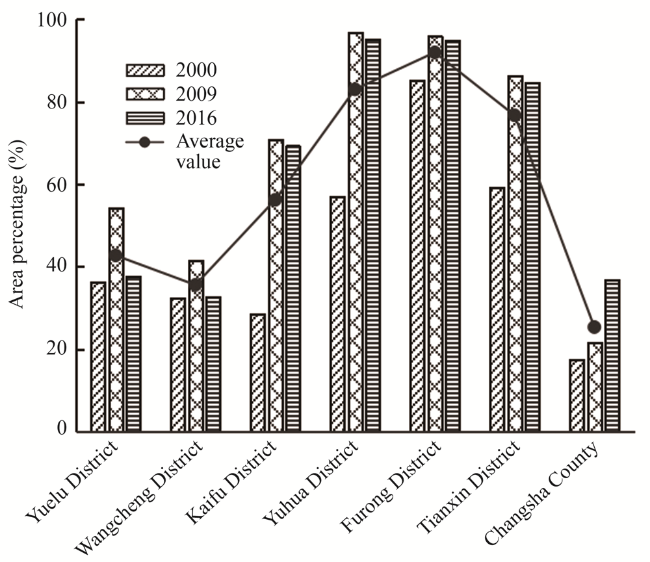
Figure 5 Percentage of UHI area in administrative districts of Changsha city in 2000, 2009 and 2016

4.2 Influencing factors of urban thermal environment

4.2.1 Correlation analysis with influencing factors

The appearance change of anything is reflected by the synergy of internal and external fac-tors, so exploring the influencing factors and driving mechanism of urban residential thermal environment effect is the key to analyze the evolution of urban human settlements thermal environment effect. These factors affecting the urban thermal environment can be summed up in two categories. One is the positive factor that leads to the increase of urban surface temperature and intensifies the UHI effect. For example, the expansion of urban built-up area changes the underlying surface type and increases the impervious area. Human economic activities (e.g. clothing, food, housing, transportation, automobile exhaust, industrial production) produce the artificial heat source. Urban meteorological factors are the external causes of the UHI effect, which will not directly affect the urban thermal environment, but change the urban residential thermal environment by affecting vegetation, surface albedo and other factors. The other one is to reduce the urban surface temperature and alleviate the UHI effect. For example, vegetation coverage, water distribution, elevation and other factors can be used to analyze the spatio-temporal changes of urban residential thermal environment. Many studies found that natural factors such as underlying surface properties and vegetation cover changes, and human factors such as population, economy, industrial form, architectural layout, building density and floor area ratio are important factors affecting urban residential thermal environment (Yuan and Bauer, 2007). In this study, according to the urban terrain characteristics and location characteristics of Changsha city, relevant natural and human factors are selected for analysis. The specific indicators are shown in Table 5. Among them, natural factors include vegetation, water body, topographic landforms, while human factors include landscape pattern index, urban construction intensity and socio-economic activity index. Landscape pattern index includes CONTAG, SHDI, DIVISION, and COHESION. Urban construction intensity is characterized by NDISI, NDBBI, and surface albedo index. The socio-economic activity index mainly reflects the intensity of human activities, that is, the impact of socio-economic development on heat island, which is expressed by POI density index. At the same time, according to the thermal environment effect analysis of Changsha city in 2000, 2009, and 2016, the UHI effect was the most obvious in 2016, so the influencing factors were analyzed based on the data of 2016.
Table 5 Indicators influencing urban thermal environment
First level indicators Second level
indicators
Third level indicators
Natural factors Vegetation and water body FVC
MNDWI
Topographic
features
DEM
Slope
Human factors Landscape
pattern index
CONTAG
SHDI
DIVISION
COHESION
Intensity of urban construction NDISI
NDBBI
Albedo
Socio-economic activities POI
The correlation analysis between influencing factors and surface temperature was developed. In the study area, 700 sample points were randomly selected. Then the indicators and surface temperature of sample points were imported into SPSS24.0 software for obtaining the Pearson correlation coefficients of each indicator and surface temperature. The correlation coefficients in Table 6 showed that surface temperature and FVC, MNDWI, elevation, slope, DIVISION, SHDI and CONTAG showed significant negative correlation. It indicates that vegetation, water body and high terrain have the cooling effect to alleviate the UHI effect, which is consistent with most existing research results. Surface temperature and NDISI, NDBBI, POI, COHESIO, and surface albedo have a significant positive correlation. These indexes reflect the influence of the construction intensity of the surface and human activities on the thermal environment effect of urban human settlements. The heat generated by human activities in high-intensity urban areas is difficult to dissipate heat quickly, which is easy to cause UHI phenomenon.
Table 6 Correlation coefficients between factors and surface temperature
Index NDISI FVC MNDWI NDBBI POI DEM
Pearson correlation coefficient 0.369** -0.508** -0.326** 0.815** 0.519** -0.514**
Correlation results significant significant significant significant significant significant
Index Slope DIVISION SHDI CONTAG COHESION Albedo
Pearson correlation coefficient -0.270** -0.276** -0.373** -0.338* 0.433** 0.395**
Correlation results significant significant significant significant significant significant

Note: **donates that the correlation was significant at the level of 0.01 (detection<0.01); *donates that correlation was significant at the level of 0.05 (p<0.05).

Considering that the dimensions of parameters are not uniform, there are differences between positive and negative values. To normalize the parameters according to the requirements of statistics, their values should be quantified to 0-1. The calculation equations are as follows:
${N}'=1-\frac{N-{{N}_{\min }}}{{{N}_{\max }}-{{N}_{\min }}}$
${N}'=\tfrac{N-{{N}_{\text{min}}}}{{{N}_{\max }}-{{N}_{\text{min}}}_{{}}}$
Equation (13) is used when the influencing factor is negatively correlated with temperature, and equation (14) is used when the influencing factor is positively correlated with temperature. ${N}'$ is the normalized value, the value is between 0 and 1; N is the original value; Nmin is the minimum value, and Nmax is the maximum value.
Figure 6 shows the spatial distribution of normalized indicators. The vegetation coverage is consistent with the distribution and abundance of vegetation in the study area. The value of built-up area is smaller than that of suburbs. The distribution of improved MNDWI is generally consistent with that of water body and paddy field in the study area. The elevation values around the study area are large, indicating that the study area is a basin topography, and there is a positive correlation between slope and elevation. The spatial distribution of CONTAG, SHDI, DIVISION, and COHESION were correlated with land use types, reflecting the agglomeration and fragmentation of urban landscape in the study area. The spatial patterns of NDISI, NDBBI, and surface albedo are related to the types of urban underlying surface, and the high values gather in the densely distributed building areas. The spatial distribution of POI index is generally consistent with that of urban built-up areas, and coincides with densely populated areas and road traffic trunk lines.
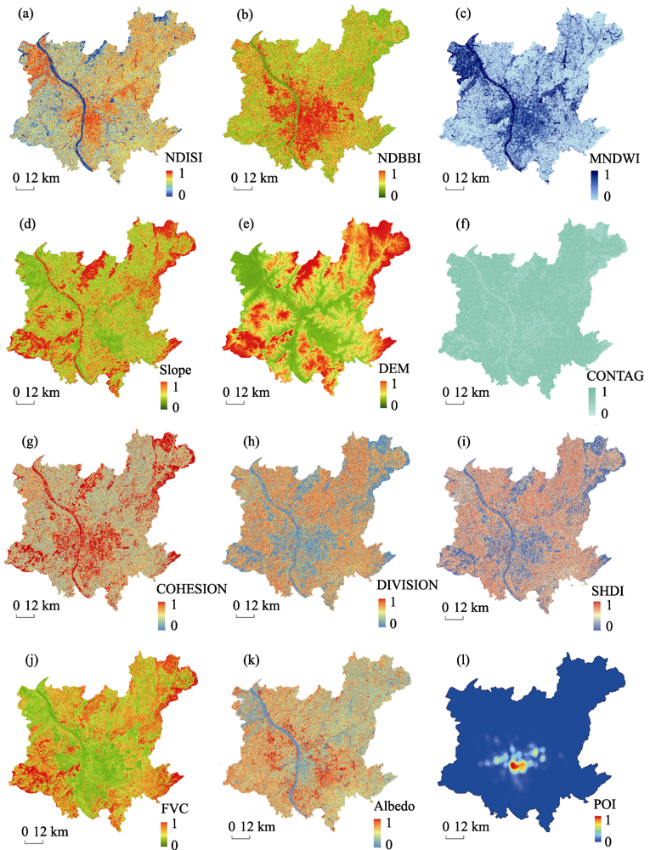
Figure 6 Spatial distribution of normalized indicators in Changsha city

4.2.2 Spatial PCA

Table 7 shows that the characteristic values of the first three principal components are more than 1.The three principal components can reflect the composition of the spatial pattern of thermal environment of urban human settlements. The natural and social factors influencing thermal environment pattern of Changsha city mainly include these three factors.
Table 7 Eigenvalue and contribution rate of principal components
Component Initial eigenvalue The load sum of squares
Eigenvalue Contribution rate (%) Cumulative contribution rate (%) Eigenvalue Variance percentage (%) Cumulative contribution rate (%)
1 3.557 29.644 29.644 3.557 29.644 29.644
2 2.637 21.978 51.622 2.637 21.978 51.622
3 1.893 15.778 67.400 1.893 15.778 67.400
4 0.991 8.254 75.654
5 0.786 6.554 82.208
6 0.762 6.354 88.562
7 0.514 4.286 92.848
8 0.428 3.569 96.417
9 0.259 2.159 98.575
10 0.134 1.114 99.689
11 0.030 0.246 99.935
12 0.008 0.065 100.000
Table 8 shows the information load of each principal component including the original 12 variables. The larger the corresponding coefficient of principal component is, the higher the component including the original variable. These can help analyze the composition of each principal component. According to Table 8, the three main factors affecting the urban thermal pattern of Changsha are landscape pattern, urban construction intensity and topography, as shown in Figure 7.
Table 8 Principal component scoring load matrix
Impact factors First principal component Second principal component Third principal component
POI 0.085 0.207 -0.295
MNDWI -0.506 -0.470 0.136
FVC 0.395 -0.457 0.284
DIVISION 0.930 -0.175 -0.219
SHDI 0.936 -0.188 -0.227
CONTAG 0.511 0.054 -0.180
COHESION -0.918 0.193 0.004
NDISI 0.431 0.687 0.243
Slope -0.206 -0.600 0.432
DEM 0.086 -0.269 0.762
Albedo -0.144 0.817 -0.125
NDBBI 0.192 0.699 -0.331
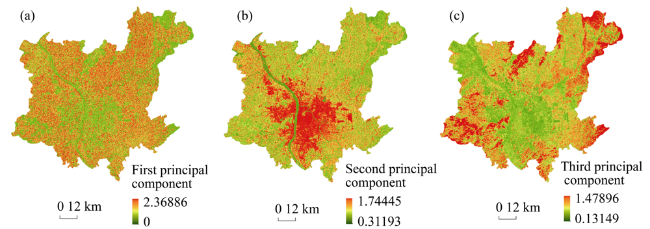
Figure 7 Spatial patterns of the first three principal components of Changsha city
The first principal component mainly reflects the impact of landscape pattern on the urban residential thermal environment in the study area. The landscape types in the central urban area of Changsha are mainly construction land, cultivated land, woodland and water area. The nature of the underlying surface and the distribution pattern of each landscape type have a significant impact on the urban thermal environment, of which the green landscape pattern is one of the main influencing factors. According to the scores of SHDI and COHESION in Table 8, the large SHDI and the small COHESION indicate the small proportion of green landscape pattern in the area of landscape types that affects the urban cooling and leads to higher surface temperature. The second principal component can be summarized as the influence of heat generated by urban construction activities on thermal environment, and its spatial distribution is generally consistent with that of urban built-up areas. The third principal component is the influence of slope and elevation on the thermal environment. The terrain of Changsha city is low in the center and high in the surroundings, and the urban development space is limited. In addition, the special terrain characteristics of the basin make the air flow poor, which is not conducive to heat diffusion, which has a great impact on the urban thermal environment. According to Table 8, the linear relationship between the first three principal components and indicators is as follows:
$\begin{align} & {{F}_{\text{1}}}=\text{0}\text{.085}{{x}_{1}}-\text{0}\text{.506}{{x}_{2}}+0.\text{395}{{x}_{3}}+0.\text{930}{{x}_{4}}+\text{0}\text{.936}{{x}_{5}}+\text{0}\text{.511}{{x}_{6}} \\ & \ \ \ \ \ \ -0.\text{918}{{x}_{7}}+0.\text{431}{{x}_{8}}-0.\text{206}{{x}_{9}}+\text{0}\text{.086}{{x}_{10}}-0.\text{144}{{x}_{11}}+\text{0}\text{.192}{{x}_{12}} \\ \end{align}$
$\begin{align} & {{F}_{\text{2}}}=\text{0}\text{.207}{{x}_{1}}-0.\text{470}{{x}_{2}}-0.\text{457}{{x}_{3}}-\text{0}\text{.175}{{x}_{4}}-\text{0}\text{.188}{{x}_{5}}+\text{0}\text{.054}{{x}_{6}} \\ & \ \ \ \ \ \ \ +\text{0}\text{.193}{{x}_{7}}+0.\text{687}{{x}_{8}}-\text{0}\text{.600}{{x}_{9}}+\text{0}\text{.269}{{x}_{10}}+0.\text{817}{{x}_{11}}+\text{0}\text{.699}{{x}_{12}} \\ \end{align}$
$\begin{align} & {{F}_{\text{3}}}=-\text{0}\text{.295}{{x}_{1}}+\text{0}\text{.136}{{x}_{2}}+0.\text{284}{{x}_{3}}-\text{0}\text{.219}{{x}_{4}}-\text{0}\text{.227}{{x}_{5}}-\text{0}\text{.180}{{x}_{6}} \\ & \ \ \ \ \ \ \ +\text{0}\text{.234}{{x}_{7}}+0.\text{243}{{x}_{8}}+\text{0}\text{.432}{{x}_{9}}+0.\text{762}{{x}_{10}}-0.\text{125}{{x}_{11}}-0.\text{331}{{x}_{12}} \\ \end{align}$

4.2.3 Relationship between principal component simulation and surface temperature

Linear regression analysis is further used to test the fitting effect of principal component factors on the spatial pattern of urban thermal environment. According to the scores of the above leading factors, the composite index of principal component simulation was calculated, and then were extracted at 700 randomly sample points. The index values of sample points and normalized surface temperature values were further substituted into SPSS24.0 software for regression analysis. According to the regression coefficient and test results in Table 9, the surface temperature of Changsha city and the natural and human factors has a good fitting degree. The regression equation F value is 957.765, the significance coefficient of the first three principal components is less than 1%, and the variance inflation factor (VIF) is less than 10, which demonstrate the principal components have no collinearity. Therefore, these three principal components are important factors affecting the urban residential thermal environment.
Table 9 Regression coefficient and test results
Impact factors Nonstandardized coefficient Standardization coefficient Beta t Significance Collinearity statistics
B Standard error Tolerance VIF
Constant 0.361 0.010 - 35.175 0.000 - -
1 0.116 0.007 0.327 15.442 0.000 0.625 1.601
2 0.012 0.008 0.031 1.471 0.000 0.644 1.553
3 -0.289 0.011 -0.640 -26.032 0.006 0.463 2.159

Note: R2 = 0.805; F = 957.765; significance coefficient is less than 1%.

In order to compare the degree of action between different dimensional indicators of each principal component, a standardized regression model is applied:
$S=0.\text{327}{{F}_{1}}+\text{0}\text{.031}{{F}_{2}}-\text{0}\text{.640}{{F}_{3}}$
The above principal component equations (15)-(17) is substituted into equation (18), and the model is further transformed into:
$\begin{align} & S=\text{0}\text{.223}{{x}_{1}}-\text{0}\text{.267}{{x}_{2}}-\text{0}\text{.068}{{x}_{3}}+\text{0}\text{.439}{{x}_{4}}+\text{0}\text{.446}{{x}_{5}}\text{0}+\text{0}\text{.284}{{x}_{6}} \\ & \ \ \ \ \ -\text{0}\text{.444}{{x}_{7}}+\text{0}\text{.007}{{x}_{8}}-\text{0}\text{.362}{{x}_{9}}-\text{0}\text{.468}{{x}_{10}}+\text{0}\text{.058}{{x}_{11}}+\text{0}\text{.296}{{x}_{12}} \\ \end{align}$
According to equation (19), for each unit change of the above 12 factors, the temperature in Changsha will change by 0.223, -0.267, -0.068, 0.439, 0.446, 0.284, -0.444, 0.007, -0.362, -0.468, 0.058 and 0.296, respectively. According to the analysis, the human factors in the study area aggravate the UHI effect, and the positive effects of the three landscape pattern indexes are more prominent, with contribution degrees of 0.439, 0.446 and 0.284 respectively. The slightly positive effects of POI index x1, normalized impervious indexx8, normalized difference bare land and building indexx12, and surface albedo indexx11 are found. Among the natural factors, the contribution of elevationx10 and slopex9 is greater, and the total contribution of water and surface vegetation, which has a negative impact on the UHI effect of Changsha, is significantly higher than that of elevation and slope. According to the interaction between the temperature and these factors, changing a single unit of the human and natural factors will respectively make the temperature change 1.753 and -1.460 units. The influence of human factors on the formation of intensified UHI effect is greater than that of natural factors. The overall temperature rise is 0.293℃. If the interaction between the temperature and the two factors changed proportionally, it can be seen that when the effect of human factors drops to 80% and the effect of natural factors increases to 20%, the temperature drops significantly in Table 10.
Table 10 Interaction between temperature and human and natural factors
Human factors Natural factors Temperature (℃)
Degree of action Grade (%) Degree of action Grade (%)
1.754 100 -1.460 100 0.293
1.5786 90 -1.606 110 -0.0274
1.4032 80 -1.752 120 -0.3488

5 Conclusions and discussion

5.1 Conclusions

Due to the single data source and influencing factor in the present thermal environment studies, this study takes Changsha city as the study area. The multi-source remote sensing data with high precision of Changsha are used to simulate the surface temperature. This study collected the multi-source spatial data (e.g. land use type data, DEM data) and used quantitative remote sensing and spatial analysis methods to quickly and accurately evaluated 12 natural and human factors closely related to the urban thermal environment. Then, a PCA method is used to investigate the formation and driving mechanisms of the UHI effect. In addition, a synthetic analysis of the thermal environment effect of human settlements in Changsha was carried out by combining quantitative and qualitative methods for providing decision support for urban planning, improvement of human settlements quality, summer high temperature disaster management and urban emergency response.
(1) From 2000 to 2016, the UHI area of Changsha city increased by 547 km2, and the maximum surface temperature difference reached 10.1℃. The results show that the UHI area is mainly concentrated in the built-up areas, such as industrial and commercial agglomerations and densely populated areas, and presents the changing trend of gradual decrease from the city center to the suburbs. There are many high temperature centers, such as Wuyi square business district, Changsha railway station, Xingsha economic and technological development zone of Changsha county, Wangcheng industrial zone, Yuelu industrial agglomeration, Tianxin industrial areas and so on.
(2) From 2000 to 2016, the main axis of spatial development of UHI remained in the northeast-southwest direction. From 2000 to 2009, the center of gravity of UHI shifted by 2.7 km to the southwest, with a deflection angle of 54.9°. Due to the rapid development of Yuelu high-tech zone and northern Jinxia development zone, the surface temperature in this area increased. From 2009 to 2016, the center of gravity of UHI shifted by 4.8 km to the northeast with a deflection angle of 60.9°, mainly due to the development of Xingsha development zone, which changed the spatial pattern of the thermal environment. The correlation between the change of the spatial pattern of thermal environment and the change of urban construction intensity in Changsha is generally demonstrated.
(3) The human factors aggravated the formation of the UHI effect in Changsha, and made greater contribution than the natural factors. The surface temperature in the study area rises by 0.293 units with the interaction between the human factors and the natural factors. Among the human factors, three landscape pattern indexes are significantly positively correlated with temperature, with contribution degrees of 0.439, 0.446 and 0.284, respectively. POI index, normalized impervious surface index, normalized difference bare land and building index surface albedo index are slightly positively correlated with temperature. Natural factors are negatively correlated with development of the UHI effect in Changsha city. The cooling effect of elevation and slope is significant, and the sum of the cooling effect of water body and surface vegetation is obviously higher than that of elevation and slope.

5.2 Discussion

(1) Urbanization leads to changes in land use/land cover types, urban atmospheric dynamic characteristics, and underlying surface heat exchange properties, and thus affecting the formation and development of the UHI effect. Therefore, properly controlling the intensity of urban construction, reasonably controlling the growth scale of construction land, increasing the area of non-built-up land, and promoting intensive, green and low-carbon land use will help to alleviate the UHI effect (Peng et al., 2013). According to the results of these studies on the origin mechanism of the UHI effect, to improve the urban thermal environment, it is necessary to strengthen the protection and maintenance of parks, green space, river course, wetland, and other natural eco-environmental systems, and to increase the area of water body, green space and other ecological land appropriately. The cooling effect of green space can be improved by homogenizing, dispersing, irregular boundary and centralizing the green space (Pan and Li, 2011). In addition, optimizing the spatial structure and morphology of the city, highlighting the layout characteristics of Changsha “landscape island city”, and controlling the high-density development of urban buildings are also helpful to improve the urban thermal environment. Based on the topographic features of the basin, the layout and arrangement of urban buildings and the energy consumption layout should be rationally planned, and the construction of urban ventilation corridors and sponge cities should be actively guided.
(2) City is a complex dynamic system composed of infrastructure, human activities and social connections (Jiao et al., 2017). Urban thermal effect is the result of multiple factors of human activities and local climate. The study of urban residential thermal environment based on multi-source data is helpful to reflect the spatial pattern and evolution law of UHI caused by these influencing factors, and to analyze and explore the cause and mechanism of the UHI effect. This study is helpful to deepen the cognition of the spatio-temporal evolution and driving mechanism of urban residential thermal environment effect, and reveal the correlation between human and natural influencing factors. Due to the problem of data acquisition these factors of the density of industrial land, building density and plot ratio analysis need to be further calculated and analyzed. Work should also be done on the studies on the forecast analysis of the spatial change of urban thermal environment, the establishment of early warning system of the UHI, and the improvement of the retrieval accuracy of surface temperature by combining the field observation data with remote sensing image data for reducing the UHI effect via technology and strategy selection, so as to make the studies on the formation mechanism of urban residential thermal environment effect to be more comprehensive in the future.
[1]
Akbari H, Pomerantz M, Taha H, 2001. Cool surfaces and shade trees to reduce energy use and improve air quality in urban areas. Solar Energy, 70(3):295-310.

DOI

[2]
Baldinelli G, Bonafoni S, 2015. Analysis of albedo influence on surface urban heat island by space borne detection and airborne thermography. New Trends in Image Analysis and Processing-ICIAP 2015 Workshops.

[3]
Bokaie M, Zarkesh M K, Arasteh P D et al., 2016. Assessment of urban heat island based on the relationship between land surface temperature and land use/land cover in Tehran. Sustainable Cities and Society, 23:94-104.

DOI

[4]
Feng X G, Sa L W, Shi H, 2012. Study on the urban heat island effect based on the PCA of multi-purpose. Journal of Xi'an Architecture and Technology University, 44(4):507-511. (in Chinese)

[5]
Fu S, Jiang Y, Zhang X Q et al., 2016. Statistics analysis of heat wave events in Changsha in recent 64 years. Meteorological Science and Technology, 44(6):991-997. (in Chinese)

[6]
Grimm N B, Faeth S H, Golubiewski N E et al., 2008. Global change and the ecology of cities. Science, 319(5864):756-760.

DOI

[7]
Grover A, Singh R B, 2015. Analysis of urban heat island (UHI) in relation to normalized difference vegetation index (NDVI): A comparative study of Delhi and Mumbai. Environments, 2:125-138.

DOI

[8]
Jiao L M, Li Z H, Xu G et al., 2017. The characteristics and patterns of spatially aggregated elements in urban areas of Wuhan. Acta Geographica Sinica, 72(8):1432-1443. (in Chinese)

[9]
Jin D D, Gong Z N, 2018. Algorithms comparison of land surface temperature retrieval from landsat series data: A case study in Qiqihar, China. Remote Sensing Technology and Application, 33(5):830-841. (in Chinese)

[10]
Kovats R S, Hajat S, 2008. Heat stress and public health: A critical review. Annual Review of Public Health, 29(1):41-55.

DOI

[11]
Lu S Y, 2004. Geographic Information System. Beijing: Higher Education Press. (in Chinese)

[12]
Pan J H, Li B J, 2011. Simulation and analysis of human dimensions of urban thermal environment in valley-city: A case study of Lanzhou City. Arid Land Geography, 34(4):662-670. (in Chinese)

[13]
Peng B F, Shi Y S, Wang H F, 2013. The impacting mechanism and laws of function of urban heat islands effect: A case study of Shanghai. Acta Geographica Sinica, 68(11):1461-1471. (in Chinese)

[14]
Shen Q J, Zhang X, Zhou Y T, 2012. Urban ecological crisis: Characteristics, factors and analysis. Urban Planning Forum, (6):23-33. (in Chinese)

[15]
White M A, Nemani R R, Thornton P E et al., 2002. Satellite evidence of phenological differences between urbanized and rural areas of the eastern United States deciduous broad leaf forest. Ecosystems, 5(3):260-273.

DOI

[16]
Xiao F, 2016. Study on the change of Changsha heat island effect based on multi-index[D]. Changsha: Hunan Normal University. (in Chinese)

[17]
Xu H Q, 2008. A new remote sensing index for fastly extracting impervious surface information. Geomatics and Information Science of Wuhan University, 33(11):1150-1153. (in Chinese)

[18]
Xue B, Li J Z, Xiao X et al., 2019. Overview of man-land relationship research based on POI data: Theory, method and application. Geography and Geo-information Science, 35(6):51-60. (in Chinese)

[19]
Yuan F, Bauer M E, 2007. Comparison of impervious surface area and normalized difference vegetation index as indicators of surface urban heat island effects in landsat imagery. Remote Sensing of Environment, 106:375-386.

DOI

[20]
Zhang X F, Wang Y L, Wu J S et al., 2006. Study on land surface temperature vegetation cover relationship in urban region: A case in Shenzhen city. Geographical Research, 25(3):369-377. (in Chinese)

[21]
Zhao L, Zhao Z Q, 2014. Projecting the spatial variation of economic based on the specific ellipses in China. Scientia Geographica Sinica, 34(8):979-986. (in Chinese)

[22]
Zheng X Q, Fu M J, 2010. Spatial Analysis Technique of Landscape Pattern and Its Application. Beijing: Science Press. (in Chinese)

[23]
Zhou G H, He Y H, 2006. Characteristics and influencing factors of urban land expansion in Changsha. Acta Geographica Sinica, 61(11):1171-1180. (in Chinese)

[24]
Zhou L, 2006. Study on landscape pattern evolution and heat island effect in the process of urbanization in Beijing[D]. Beijing: Beijing Forestry University. (in Chinese)

Outlines

/