
Journal of Geographical Sciences >
Sensitivity and areal differentiation of vegetation responses to hydrothermal dynamics on the northern and southern slopes of the Qinling Mountains in Shaanxi province
|
Qi Guizeng (1994-), Master Candidate; specialized in regional climate change and vegetation response. E-mail: 1553271382@qq.com |
Received date: 2021-01-20
Accepted date: 2021-03-28
Online published: 2021-08-25
Supported by
Key Research and Development Program of Shaanxi Province(2019ZDLSF05-02)
Key Research and Development Program of Shaanxi Province(2020SF-400)
Shaanxi Province Water Conservancy Science and Technology Project(2020slkj-13)
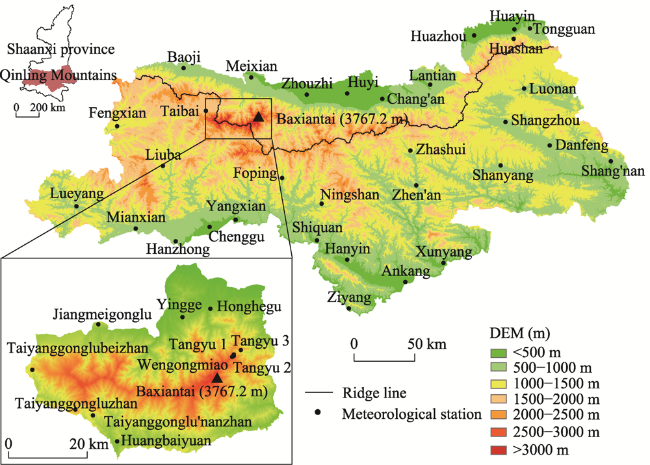
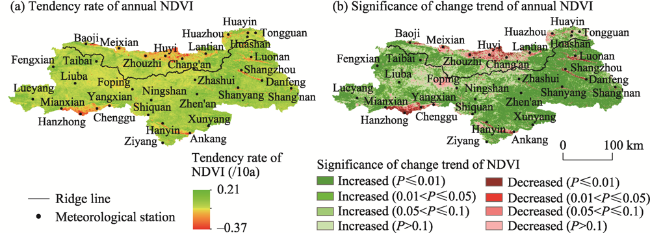
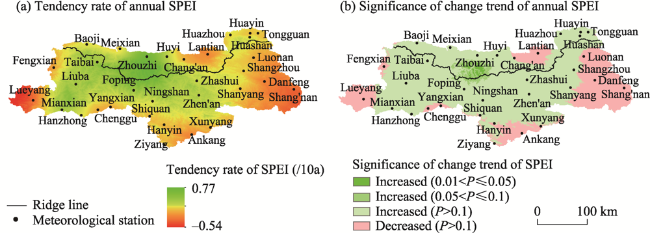
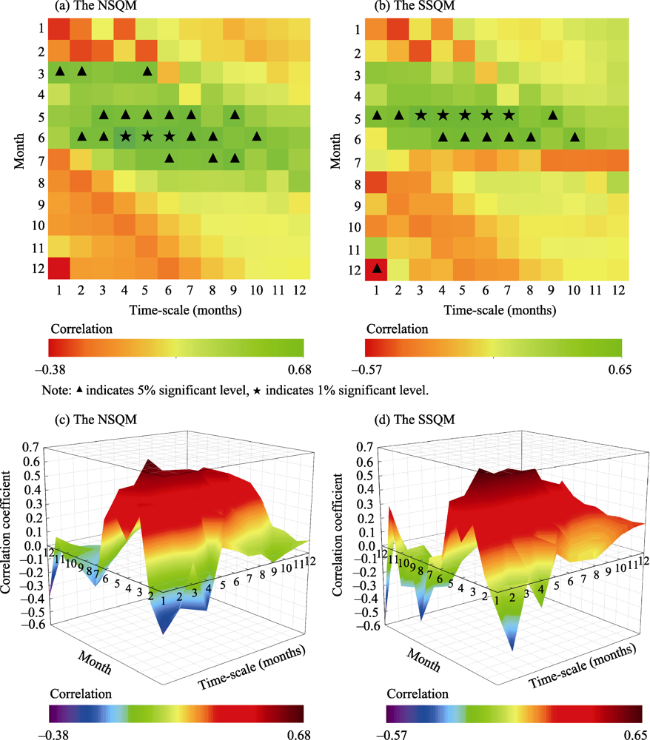
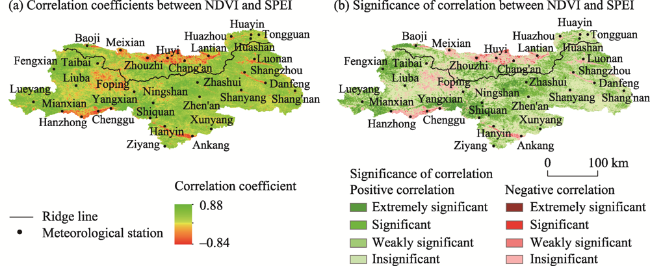
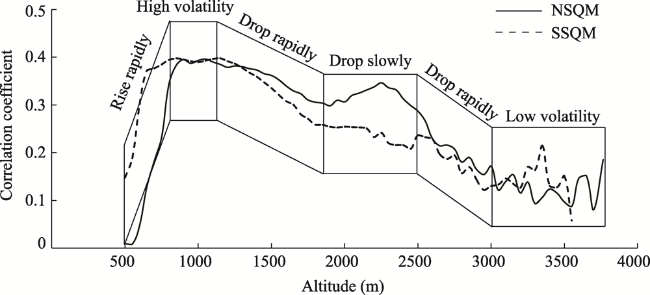
The Qinling Mountains, located at the junction of warm temperate and subtropical zones, serve as the boundary between north and south China. Exploring the sensitivity of the response of vegetation there to hydrothermal dynamics elucidates the dynamics and mechanisms of the main vegetation types in the context of changes in temperature and moisture. Importance should be attached to changes in vegetation in different climate zones. To reveal the sensitivity and areal differentiation of vegetation responses to hydrothermal dynamics, the spatio-temporal variation characteristics of the normalized vegetation index (NDVI) and the standardized precipitation evapotranspiration index (SPEI) on the northern and southern slopes of the Qinling Mountains from 2000 to 2018 are explored using the meteorological data of 32 meteorological stations and the MODIS NDVI datasets. The results show that: 1) The overall vegetation coverage of the Qinling Mountains improved significantly from 2000 to 2018. The NDVI rise rate and area ratio on the southern slope were higher than those on the northern slope, and the vegetation on the southern slope improved more than that on the northern slope. The Qinling Mountains showed an insignificant humidification trend. The humidification rate and humidification area of the northern slope were greater than those on the southern slope. 2) Vegetation on the northern slope of the Qinling Mountains was more sensitive to hydrothermal dynamics than that on the southern slope. Vegetation was most sensitive to hydrothermal dynamics from March to June on the northern slope, and from March to May (spring) on the southern slope. The vegetation on the northern and southern slopes was mainly affected by hydrothermal dynamics on a scale of 3-7 months, responding weakly to hydrothermal dynamics on a scale of 11-12 months. 3) Some 90.34% of NDVI and SPEI was positively correlated in the Qinling Mountains. Spring humidification in most parts of the study area promoted the growth of vegetation all the year round. The sensitivity of vegetation responses to hydrothermal dynamics with increasing altitude increased first and then decreased. Elevations of 800 to 1200 m were the most sensitive range for vegetation response to hydrothermal dynamics. The sensitivity of the vegetation response at elevations of 1200-3000 m decreased with increasing altitude. As regards to vegetation type, grass was most sensitive to hydrothermal dynamics on both the northern and southern slopes of the Qinling Mountains; but most other vegetation types on the northern slope were more sensitive to hydrothermal dynamics than those on the southern slope.
Key words: Qinling Mountains in Shaanxi province; NDVI; SPEI; sensitivity; spatial difference
QI Guizeng , BAI Hongying , ZHAO Ting , MENG Qing , ZHANG Shanhong . Sensitivity and areal differentiation of vegetation responses to hydrothermal dynamics on the northern and southern slopes of the Qinling Mountains in Shaanxi province[J]. Journal of Geographical Sciences, 2021 , 31(6) : 785 -801 . DOI: 10.1007/s11442-021-1871-7
Figure 1 Geographical environment and distribution of meteorological stations on the northern and southern slopes of the Qinling Mountains |
Table 1 Results of SPEI spatial interpolation on the northern and southern slopes of the Qinling Mountains |
| Year | MAE | RMSE | ||
|---|---|---|---|---|
| Yearly interpolation test | Spring interpolation test | Yearly interpolation test | Spring interpolation test | |
| 2013 | 0.137 | 0.140 | 0.171 | 0.173 |
| 2014 | 0.043 | 0.062 | 0.064 | 0.093 |
| 2015 | 0.240 | 0.343 | 0.318 | 0.449 |
Figure 2 Spatial distribution of the trend and significance of the NDVI on the northern and southern slopes of the Qinling Mountains during 2000-2018 |
Figure 3 Spatial distribution of the tendency rate and significance of SPEI on the northern and southern slopes of the Qinling Mountains during 2000-2018 |
Figure 4 Correlation coefficients between annual NDVI and SPEI of each month |
Figure 5 Spatial distribution of correlation coefficients and significance between NDVI and SPEI |
Table 2 Land cover reclassification |
| Vegetation type | Reclassification | Vegetation type | Reclassification |
|---|---|---|---|
| Montane cold temperate evergreen needle-leaved forest | Needle-leaved forest | Alpine and sub-alpine meadow | Alpine meadow |
| Montane cold temperate deciduous needle-leaved forest | Typical meadow | Grasses | |
| Montane temperate evergreen needle-leaved forest | Temperate sparse shrubby-grass slopes | ||
| Warm evergreen needle-leaved forest | Croplands | Farmland crops | |
| Montane deciduous broad-leaved forest | Broad-leaved forest | Snow and ice | Water bodies |
| Typical deciduous broad-leaved forest | Water bodies | ||
| Warm-temperate evergreen broad-leaved deciduous mixed forest | Wetlands | Wetlands | |
| Temperate deciduous broad-leaved forest | Construction land | Urban areas | |
| Alpine-subalpine evergreen deciduous shrubs | Shrubs | Barren or sparsely vegetated | Bare land |
| Subalpine deciduous broad-leaved shrubs | |||
| Warm deciduous broad-leaved shrubs | |||
| Temperate deciduous shrubs | |||
| Temperate deciduous broad-leaved shrubs |
Table 3 Correlation coefficients between NDVI and SPEI for different vegetation types on the northern and southern slopes of the Qinling Mountains |
| Grasses | Shrubs | Broad-leaved forest | Needle-leaved forest | Alpine meadow | Farmland crops | Bare land | Water bodies | Urban areas | |
|---|---|---|---|---|---|---|---|---|---|
| NSQM | 0.35 | 0.35 | 0.33 | 0.30 | 0.20 | 0.06 | 0.23 | 0.09 | -0.07 |
| SSQM | 0.37 | 0.33 | 0.31 | 0.28 | 0.19 | 0.31 | 0.09 | 0.18 | -0.02 |
Figure 6 Correlation coefficients between NDVI and SPEI with altitude on the northern and southern slopes of the Qinling Mountains |
| [1] |
|
| [2] |
|
| [3] |
|
| [4] |
|
| [5] |
|
| [6] |
|
| [7] |
|
| [8] |
|
| [9] |
|
| [10] |
|
| [11] |
|
| [12] |
|
| [13] |
|
| [14] |
|
| [15] |
|
| [16] |
|
| [17] |
|
| [18] |
|
| [19] |
|
| [20] |
|
| [21] |
|
| [22] |
|
| [23] |
|
| [24] |
|
| [25] |
|
| [26] |
|
| [27] |
|
| [28] |
|
| [29] |
|
| [30] |
|
| [31] |
|
| [32] |
|
| [33] |
|
| [34] |
|
| [35] |
|
| [36] |
|
| [37] |
|
| [38] |
|
/
| 〈 |
|
〉 |