Spatiotemporal evolution and driving factors of global production networks: An analysis based on the input-output technique

  • ZHENG Zhi , 1, 2, 3 ,
  • CHEN Wei , 1, 2, * ,
  • LIANG Yi 4 ,
  • ZHANG Yajing 1, 2, 3
Expand
  • 1. Institute of Geographic Sciences and Natural Resources Research, CAS, Beijing 100101, China
  • 2. Key Laboratory of Regional Sustainable Development Modeling, CAS, Beijing 100101, China
  • 3. College of Resources and Environment, University of Chinese Academy of Sciences, Beijing 100049, China
  • 4. Land Consolidation and Rehabilitation Center, Ministry of Natural Resources, Beijing 100035, China
*Chen Wei (1989–), PhD, E-mail:

Zheng Zhi (1993-), PhD Candidate, specialized in economic geography, regional development and global production networks. E-mail:

Received date: 2020-10-28

  Accepted date: 2021-03-18

  Online published: 2021-07-25

Supported by

Strategic Priority Research Program of Chinese Academy of Sciences(XDA20080000)

National Natural Science Foundation of China(41901154)

Copyright

Copyright reserved © 2021. Office of Journal of Geographical Sciences All articles published represent the opinions of the authors, and do not reflect the official policy of the Chinese Medical Association or the Editorial Board, unless this is clearly specified.

Abstract

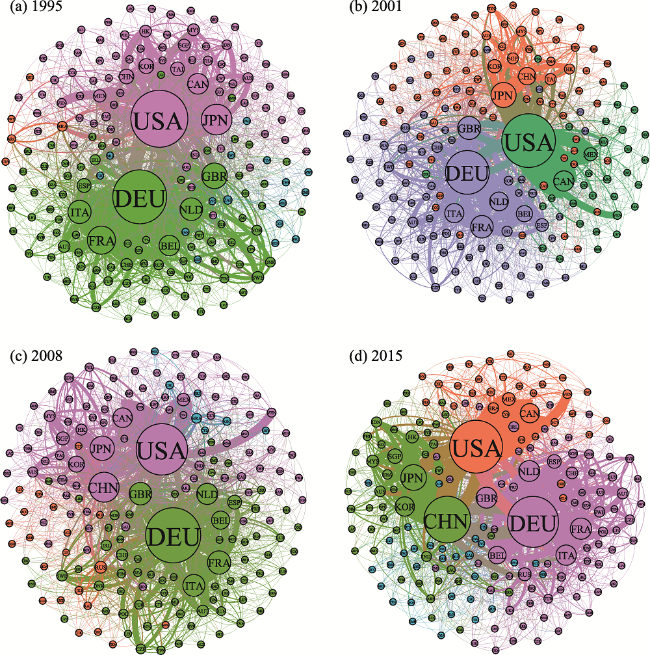
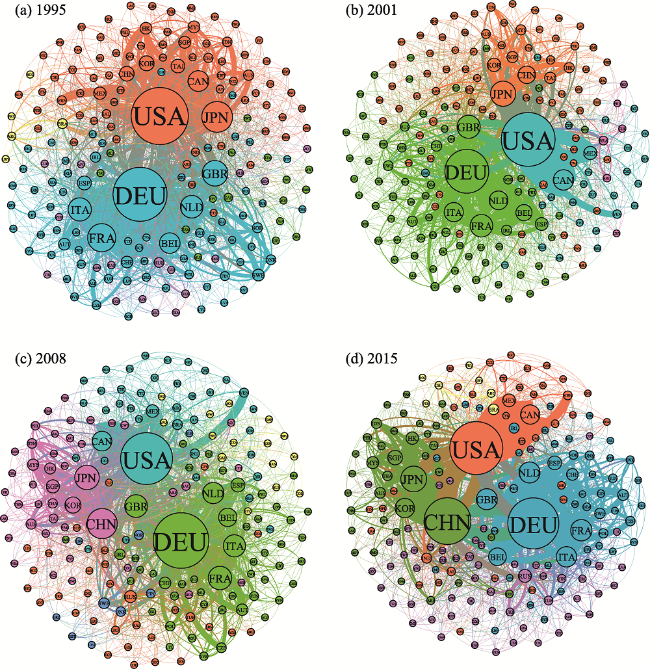
Global production networks have become the most important organizational platforms for coordinating international production activities, and their evolution patterns profoundly affect value distribution across the world. In this study, we shall firstly carry out an in-depth quantitative research to analyze the patterns and evolution of global production networks, using a long time-sequenced multi-region input-output table and the network analysis approach. Then based on the method of value-added decomposition, we will develop an index system to measure the degree of participation of regions in global production networks. Finally, we will try to identify the factors affecting the degree of participation of countries in global production networks by constructing a regression model. The results show that from 1995 to 2015, the evolution of global production networks measured by input-output linkages experienced four stages: expansion, contraction, re-expansion, and re-contraction. In addition, the core communities of global production networks evolved from two major production communities (Europe and the Americas) to three pillars (Europe, Americas, and Asia) while more segmented communities are mainly affected by geographical proximity. The latter consists of European, North American, South American, African and Asian communities. The evolution of the global production network pattern primarily manifests as a process of cooperation strengthening or weakening among communities, based on changes in the external environment and the need for individual development strategies. Meanwhile, the United States, Germany, and the United Kingdom have consistently ranked among the top entities in global production networks, whereas China, Russia, and Southeast Asia have the fastest rises in ranking. In addition, government efficiency, resources endowment, infrastructure conditions and technology levels play important roles in the participation in global production networks.

Cite this article

ZHENG Zhi , CHEN Wei , LIANG Yi , ZHANG Yajing . Spatiotemporal evolution and driving factors of global production networks: An analysis based on the input-output technique[J]. Journal of Geographical Sciences, 2021 , 31(5) : 641 -663 . DOI: 10.1007/s11442-021-1863-7

1 Introduction

Global production networks (GPNs) have become the most important organizational platforms for coordinating and organizing global production activities. Accordingly, the global economy has changed from “the world that trade created” to “the world that production created” (Pomeranz and Topik, 2008; Yeung and Coe, 2015). The development of GPNs has profoundly affected value distribution and trade patterns worldwide. The United Nations Conference on Trade and Development (2013) estimated that 80% of world trade was carried out in GPNs. With the continuous expansion of GPNs, no country can develop completely independently of other countries (Dicken, 2015). Thus, the level of participation in and the ability to capture value from GPNs are critical to a country’s development.
The GPN research, since proposed, has attracted a lot of academic attention and gained fruitful achievements. In addition to its core theoretical developments such as GPN1.0, GPN 2.0 and strategic coupling (Dicken and Thrift, 1992; Henderson et al., 2002; Coe et al., 2004; Coe and Hess, 2010; Yeung and Coe, 2015), the approach has been widely applied to different areas of studies (e.g., Pauls and Franz, 2013; Coe, 2014; Dorry, 2015; Baker and Sovacool, 2016; Christian, 2016; Kleibert, 2016; Yeung, 2016; Niewiadomski, 2017; Kano, 2018; Lema et al., 2018; Yeung, 2018; Chor, 2019; Kim et al., 2019). However, so far, GPN studies are focused on qualitative researches at the micro-level. This overemphasis on micro-scale processes is widely criticized and many scholars have argued that GPN research is still not yet fully operational at the macro level through quantitative analysis (Sunley, 2008; Yeung, 2016; Neilson et al., 2018). Proponents of the GPN approach also admit that it requires a convergence of the quantitative analyses and case studies to mitigate the potential ‘‘blind spots” of micro-scale analyses and enhance the GPN explanatory power (Coe and Hess, 2010; Coe, 2012).
It is increasingly recognized that more diffuse forms of power are enacted across networks and chains, such that privileging any single scale risks neglecting the multi-scalar processes (Dallas et al., 2017; Neilson et al., 2018). Thus, overemphasis on micro-scale processes may neglect the laws showed on a larger scale. Against this background, this paper attempts to make a quantitative study of the pattern and evolution of GPNs based on the input-output technique. While recognizing that an international input-output table is country-based and a GPN delineated by input-output linkages is very general and maybe too macro, we tend to believe that such a quantitative study may offer a complement to existing GPN studies. Compared to firm-based GPN research, country-based research can better explore the GPN patterns at macro-regional or even global scale and the positions that different countries have in it. In particular, understanding such patterns, assessing the degree of participation of different countries in GPNs and identifying influencing factors behind it have significant meanings for developing countries to draft development strategies and make relevant policies to integrate well into global production networks and enhance their ability of value capture.
The article is structured as follows. The next section provides a literature review of related research on GPN and quantitative research methods. The third section introduces our research data and research methods in which we build up an index system for measuring the degree of participation in GPNs and a panel regression model for identifying the influencing factors behind it. The fourth section displays and analyzes the quantitative research results, which consist of three parts. The first part analyzes the overall patterns and evolution of GPNs, using a long time-sequenced multi-region input-output table and the network analysis approach. The second part, based on the index system that we build in section two, measures the degree of participation of different economies in GPNs. The third part identifies the factors that significantly influence the degree of participation in GPNs with the panel regression model and tries to explain how they work. The last section summarizes this article.

2 Literature review

The formation and evolution of global production networks are extremely complex processes of intertwining economic, social, cultural and political factors. There have been a lot of studies to explain this global economic phenomenon. Gereffi (1994) is a pioneer in this stream of study by proposing the global commodity chain analytical framework based on the world-systems theory, by which he linked the value-added process with global industrial organization and illuminated a new perspective for global economic analysis. However, it is argued that his theory does not effectively distinguish different network types (Dolan and Hemphrey, 2000; Knorringa and Schmitz, 2000). As a response, Gereffi et al. (2005) developed the global value chain (GVC, hereafter) theory, in which five types of global value chain governance are identified, i.e. hierarchy, captive, relational, modular and market, according to three factors of the complexity of transactions, ability to codify transactions, and capabilities of the supply-base. The GVC analytical framework is widely used because of its explanatory power. Indeed, many institutions and governments have adopted this approach to understanding global industries and made new policies and programs to drive economic development (Gereffi, 2018). However, many scholars argue that the binary division of economic organization used by GVC theory covers up the profound organizational changes in the global economy. Thus, the theory is an immature analytical framework (Zhang, 2006). For example, Dicken et al. (2001) argue that the GVC overemphasizes governance structure but forgets about the other three dimensions, i.e., input-output structure, territoriality, and institutional framework, which were proposed at the very beginning of the theory.
To address this deficiency and based on actor-network theory, a community of scholars from Manchester represented by Jeffrey Henderson and Peter Dicken developed a global production network (GPN, hereafter) theory (Henderson et al., 2002). They argue that a network is neither purely organizational nor purely structured and the network approach requires identifying actors in the network, their ongoing relationships and the structural consequences of these relationships. The GPN theory advocates an analytical framework of global economy by paying attention to three factors of value, power, and embeddedness from four dimensions of enterprises, sectors, networks and institutions. The GPN approach is a more ambitious organizational platform and its outstanding theoretical contribution is integrating non-firm actors such as governments, social communities and international organizations into the analytical framework. However, critics have complained that this ‘elasticity’ indicates that GPNs are ‘defined vaguely’ and fail to ‘exclude any form of organizational link, transfer, (or) social connection,’ but rather include ‘just about everything’ and therefore lack ‘analytical boundaries’ (Sunley, 2008). Yeung (2015) argues that the causal mechanisms linking elements to dynamic configurations of GPNs are not explicitly developed and specified while other scholars like Hudson (2008), Sunley (2008) and Starosta (2010) also criticize that the GPN theory is not sufficient in explanation or cannot provide a coherent theory.
To make the theory more dynamic and explanatory, Yeung and Coe (2015) proposed the GPN 2.0, which takes leading companies as the core of research. They identified four kinds of strategies, i.e., intra-firm coordination, inter-firm control, inter-firm partnership and extra-firm bargaining according to three competitive dynamics of the cost-capability ratio, market imperatives and financial discipline. Compared with the earlier GPN theory, GPN 2.0 shrinks the theoretical perspective, paying more attention to the choice of firm behavior under the influence of economic factors, thus becoming more applicable. However, an increasing number of scholars have argued that the GPN 2.0 overemphasizes micro-scale processes and is still not yet fully operational at the macro level through quantitative analysis (Sunley, 2008; Coe, 2012; Yeung, 2016; Neilson et al., 2018). Scale has always been a very important factor in economic geography (Liu et al., 2013) and different scales may show different laws. Thus, observing the world at multiple scales is extremely necessary for economic geographical research. In terms of research method, the over-dependence on qualitative methods is something of a weakness, and the evidence cannot always be pieced together to provide a synthetic, macro-perspective (Coe et al., 2009). Therefore, the development of quantitative methods is necessary when carrying out macro-scale research.
Although not fully developed, the quantitative GPN research at the macro level has been carried out by scholars in many aspects. In terms of research methods, existing research is mainly based on input-output analysis and value-added decomposition in trade. Hummels et al. (2001) initiated research on vertical trade and value-added trade. To improve the weakness of the “proportionality” assumption in Hummels’ model, Laurence et al. (2007) constructed a non-Competitive Input-Output Model. Then, Koopman et al. (2012a, 2014), and Wang et al. (2013) broke down the gross export of a country into different sources of value-added and double counting part, and these works greatly expanded the application range. These method innovations, especially the indicators such as GVC position index and GVC participation index, have been widely used in globalization-related research. In empirical studies, a considerable part of them focuses on measuring the position of a country in GPNs and its evolution (e.g., Yao and Zhang, 2008; Yao and Zhang, 2011; Qiu et al., 2012; Fan and Huang, 2014; Cen, 2015; Cheng, 2015; Wei and Wang, 2016). It is argued that developing countries widely face the threat of “low-end locking” when participating in GPNs (Liu and Zhang, 2007; Shen and Zhou, 2016; Huang and Yu, 2017), which echoes the “dark side” in strategic coupling research. There are also studies dedicated to exploring the factors that may influence a country’s position in GPNs. They found that factors such as policy arrangements, technology spillovers and the degree of openness have a significant impact on a country’s participation in GPNs (Liu et al., 2005; Liu et al., 2006; Bu, 2007; Tang and Zhang, 2009; Xu and Li, 2010; Sun and Qiu, 2011; Liu et al., 2014). Furthermore, quantitative GPN research at a national scale has also been adopted by many international economic organizations and think-tanks (Backer and Miroudot, 2013; UNCTD, 2013; Boffa, 2018), as Godfrey (2016) argues that it is necessary to ‘scale up’ the firm-specific approach to a larger scale for researchers working in think-tanks who have to develop policy prescriptions for policymakers.
In general, however, these existing indicators are far from delineating the level of participation of each region in global economy. The widely used GVC position index describes the upstream and downstream relationships of the commodity chain in the production process but cannot reflect the dominant power and technology level of an economy in GPNs. For example, agricultural products and minerals are located upstream of the commodity chain, but countries exporting these products are often the low-end producer in GPNs. Therefore, GPN studies demand more quantitative research at the macro level to reveal the fine linkages between different players in the network.

3 Methods and data

3.1 Research scope and data

To fulfill the aims of evaluating GPN pattern and evolution as well as innovation of quantitative methods, a multi-region input-output (MRIO) table is needed. The world input-output database (WIOD), which covers 43 countries and 26 sectors, is widely used. However, the geographical scope is too limited to characterize the overall GPN pattern because of the vacancy of countries in South America, Southeast Asia, Central Asia, and the Middle East, which, especially the Southeast Asian countries play an important role in GPNs. In contrast, the Eora MRIO database built by the Australian Research Council covers 188 countries and regions and a time span from 1990 to 2015. Therefore, we use the Eora MRIO in this study and select a time span from 1995 to 2015. In addition, the data for the panel data regression model is from the World Bank open database.

3.2 Research methods

3.2.1 Complex network analysis
To analyze the structure of GPNs, a cohesive subgroups analysis was used to identify the communities and their evolution in GPNs. The cohesive subgroups analysis uses topological relations and attributes to ascertain the community structure in the network. The main characteristic of the community structure is that the nodes in a community are closely related, whereas the associations of the nodes between communities are relatively weak. There are many types of network community detection methods (Girvan and Newman, 2002; Clauset et al., 2004; Newman and Girvan, 2004; Radicchi et al., 2004; Wu and Huberman, 2004; Newman, 2006; Pons and Latapy, 2006), and the fast unfolding method was selected for this study to modularize the network (Blondel et al., 2008) (the resolution is uniformly set to 1). To avoid the interference of complex data and facilitate visualization, a backbone network was selected as a replacement for the entire network (Boguñá, 2007). Moreover, to avoid the incorrect judgment of a network as the top network when the results reflect some internal “island” countries merely trade with each other, this study selects the top five networks. Gephi0.9.2 is used to visualize the data, and colors are used to distinguish between different condensed communities.
3.2.2 Input-output analysis
Using the input-output table, we can analyze the cross-border flows of intermediate goods and added value. Suppose there are m economies and n industries. The multinational input-output relationship can be expressed as follows:
$\left[ \begin{matrix} \begin{matrix} {{X}^{1}} \\ {{X}^{2}} \\ \end{matrix} \\ \begin{matrix} \vdots \\ {{X}^{m}} \\ \end{matrix} \\ \end{matrix} \right]=\left[ \begin{matrix} \begin{matrix} {{A}^{11}} & {{A}^{12}} \\ {{A}^{21}} & {{A}^{22}} \\ \end{matrix} & \begin{matrix} \ldots & {{A}^{1m}} \\ \ldots & {{A}^{2m}} \\ \end{matrix} \\ \begin{matrix} \vdots & \vdots \\ {{A}^{m1}} & {{A}^{m2}} \\ \end{matrix} & \begin{matrix} \ddots & \vdots \\ \ldots & {{A}^{mm}} \\ \end{matrix} \\ \end{matrix} \right]\left[ \begin{matrix} \begin{matrix} {{X}^{1}} \\ {{X}^{2}} \\ \end{matrix} \\ \begin{matrix} \vdots \\ {{X}^{m}} \\ \end{matrix} \\ \end{matrix} \right]+\left[ \begin{matrix} \begin{matrix} {{Y}^{1}} \\ {{Y}^{2}} \\ \end{matrix} \\ \begin{matrix} \vdots \\ {{Y}^{m}} \\ \end{matrix} \\ \end{matrix} \right]=\left[ \begin{matrix} \begin{matrix} {{B}^{11}} & {{B}^{12}} \\ {{B}^{21}} & {{B}^{22}} \\ \end{matrix} & \begin{matrix} \ldots & {{B}^{1m}} \\ \ldots & {{B}^{2m}} \\ \end{matrix} \\ \begin{matrix} \vdots & \vdots \\ {{B}^{m1}} & {{B}^{m2}} \\ \end{matrix} & \begin{matrix} \ddots & \vdots \\ \ldots & {{B}^{mm}} \\ \end{matrix} \\ \end{matrix} \right]\left[ \begin{matrix} \begin{matrix} {{Y}^{1}} \\ {{Y}^{2}} \\ \end{matrix} \\ \begin{matrix} \vdots \\ {{Y}^{m}} \\ \end{matrix} \\ \end{matrix} \right]$
where Xi represents the total output vector of n×1 of the economy, and Aij represents the n×n input-output direct consumption coefficient matrix. The matrix is formed by the proportion of the part from economy i in the intermediate input of economy j to the total input of economy j. Yi represents the total amount of n×1 final product demanded by each economy for economy i. Bij represents the Leontief inverse matrix of the input-output matrix.
Koopman et al. (2008, 2010, 2012a, 2012b) proposed the KPWW method for forming a set of trade accounting systems with the added value as the core, based on the global value chain theory, with the added value as the statistical caliber. This system not only completely reflects the distribution of product value among countries but also eliminates the repeated calculation of traditional trade statistics, and creates conditions for measuring the actual trade gains of various industries. The proportion of the value-added (value-added/total output) is expressed by V, and the sum of the direct and indirect value-added of the output of one unit of one country is denoted by (Cheng, 2015): V+VA+VAA+...=V(I-A)-1=VB. VB is also known as the total value-added multiplier matrix. In this calculation, V is the diagonal matrix formed by the diagonal value distribution of the direct value-added coefficients of various industries in various countries, B is the Leontief inverse matrix of various industries in various countries, and E is the angular matrix pair of the total export value of each industry in various countries along the diagonal distribution. Then, the value-added of a country’s export products can be divided as follows (Zheng et al., 2021):
$VBE=\left[ \begin{matrix} \begin{matrix} {{V}_{1}}{{B}_{11}}{{E}_{1}} & {{V}_{1}}{{B}_{12}}{{E}_{2}} \\ {{V}_{2}}{{B}_{21}}{{E}_{1}} & {{V}_{2}}{{B}_{22}}{{E}_{2}} \\ \end{matrix} & \begin{matrix} \cdots & {{V}_{1}}{{B}_{1m}}{{E}_{m}} \\ \cdots & {{V}_{2}}{{B}_{2m}}{{E}_{m}} \\ \end{matrix} \\ \begin{matrix} \vdots & \vdots \\ {{V}_{m}}{{B}_{m1}}{{E}_{1}} & {{V}_{m}}{{B}_{m2}}{{E}_{2}} \\ \end{matrix} & \begin{matrix} \ddots & \vdots \\ \cdots & {{V}_{m}}{{B}_{mm}}{{E}_{m}} \\ \end{matrix} \\ \end{matrix} \right]$
The total exports can be further divided into domestic value-added and foreign value-added, as follows: (export from r to s)
$F V_{r}=\sum_{s \neq r} V_{s} B_{s r} E_{r}$
$D V_{r}=V_{r} B_{r r} E_{r}$
$E_{r}=DV_{r}+FV_{r}$
Using the value-added division method proposed by Koopman, Wang and Wei (2010), the domestic value can be further divided into four parts, and the total exit can be divided into five parts, as follows:
$E_{r}=DV_{r}+FV_{r}={{V}_{r}}{{B}_{rr}}\underset{s\ne r}{\mathop \sum }\,{{Y}_{rs}}+{{V}_{r}}{{B}_{rr}}\underset{s\ne r}{\mathop \sum }\,{{A}_{rs}}{{X}_{ss}}+{{V}_{r}}{{B}_{rr}}\underset{s\ne r}{\mathop \sum }\,\underset{t\ne r,s}{\mathop \sum }\,{{A}_{rs}}{{X}_{st}}+{{V}_{r}}{{B}_{rr}}\underset{s\ne r}{\mathop \sum }\,{{A}_{rs}}{{X}_{sr}}+~F{{V}_{r}}$
The five parts in the formula are 1) domestic value-added as embodied in exports of final goods and services absorbed by the direct importer; 2) domestic value-added as embodied in exports of intermediate inputs used by the direct importer to produce its domestically required products; 3) domestic value-added as embodied in intermediate exports used by a direct importer to produce goods for third-party countries (“indirect value-added exports”) (TDV); 4) domestic value-added as embodied in intermediate exports used by the direct importer to produce goods shipped back to the source (“reflected domestic value-added”); and 5) value-added from foreign countries embodied in gross exports (“foreign value-added used in exports”) (FV).
3.2.3 GPN participation index construction
This study argues that the comprehensive measurement of an economy’s participation in GPNs should be carried out in at least three ways. First, the measurement should determine how much of a country’s production growth value is used or deeply involved in GPNs, defined herein as the intensity of participation in GPNs. Second, the dispersions of the intermediate goods used in GPNs have both types and geographical dimensions. If a country only cooperates with one or two countries in production networks and its cooperation areas are highly concentrated on a certain product, we believe that its participation in GPNs will remain greatly limited, even if its intensity of participation in GPNs is very high. This aspect is defined as the range of participation in GPNs. The third aspect concerns measuring organization and leadership ability in the context of participating in GPNs. A country may have a high intensity and breadth in the process of participating in GPNs, but if it is in a completely passive vassal position in the production network, the economic development it can gain from the network remains very limited. The stronger the organization and leadership ability, the more the organization is able to use GPNs to serve the country’s economic development, and to improve the ability to capture value. This third aspect is defined as the position of participation in GPNs.
(1) The intensity of participation in GPNs.
The intensity of participation in GPNs indicates how much of the added value of a country’s production is involved in GPNs. It is constructed from the total proportion of TDV and FV, and it is the same as the global value chain index proposed by Koopman et al. (2010):
$P I=\frac{V_{r} B_{r r} \sum_{s \neq r} \sum_{t \neq r, s} A_{r s} X_{s t}}{E_{r}}+\frac{F V_{r}}{E_{r}}$
(2) The range of participation in GPNs
The range of participation in GPNs is represented by the dispersion of intermediate goods used in GPNs in both types and geographical dimensions. EIr represents the total amount of intermediate products exported by country r, and EIrmj represents intermediate products j exported to country m by country r. The specific formula is as follows:
$P R=\frac{1}{\sum_{s \neq r} \sum\left(E I_{r m j} / E I_{r}\right)^{2}}$
(3) The position of participation in GPNs
The position of participation in GPNs is represented by the intensity of the transfer of low value-added production processes. The transfer of a production process is a form of production organization that emerged after the advent of the globalization era. One example of such a transfer is the concept of outsourcing activities, which has brought new vitality to enterprises. To maintain and strengthen the core competitiveness, enterprises can transfer non-core businesses to external professional companies. The assembly and production of European and American products in China and software outsourcing in India are representative of typical outsourcing activities. The organization of a low value-added production process transfer can reflect the leadership ability of GPNs, as determined by the final product produced by the country. Thus, this index is more representative of the position of the participation of an economy in GPNs than the existing upstream and downstream indexes. The specific calculation method incorporates the proportion of the domestic value-added that is used for importer production and then returns to the exporter. Considering that the proportion described above also includes the transfer of a high value-added production process owing to technical limitations, this qualification must be added to the formula. When the value-added in the products returning to the country is the highest for all countries, the formula is added. Otherwise, the value is zero:
$P A=\frac{V_{r} B_{r r} \sum_{s \neq r} A_{r s} X_{s r}}{E_{r}}$
(If $V_{r} B_{r r} X_{s r}>V_{t} B_{t t} X_{s r}(t \neq r)$
Then $V_{r} B_{r r} X_{s r}=V_{r} B_{r r} X_{s r}$
or $V_{r} B_{r r} X_{s r}=0$)
(4) The comprehensive participation index in GPNs
Finally, in order to comprehensively measure a country’s participation in GPNs, we use the Entropy Weight method to calculate the comprehensive participation index in GPNs (PC) based on the above three dimensions.
3.2.4 Regression modeling
Compared to the three dynamics elaborated in GPN 2.0, we believe that the factors at a national level may also play an important role in influencing the process of countries’ participation in GPNs, such as aspects of institutional arrangement, soft power, and resource endowment. Therefore, we select four aspects of infrastructure level, state power and institutional arrangement, science and education level, and resource endowment. Among them, infrastructure provides important support for economic development and is widely used as an important indicator of the level of economic development (Yeung, 2015; Kim, 2019). Science and education level can affect the position of participation in GPNs of countries to a large extent, which is the key indicator of regional industrial upgrading in the GPN and GVC related literature (Blažek, 2016). Resource endowment can directly affect the choice of industries participating in the global production network, such as Saudi Arabia’s oil output, Australia’s coal output, and China’s labor-intensive products (Bridge, 2008). Finally, transnational economic cooperation cannot be a complete economic behavior. It will inevitably be affected by government behavior, such as the degree openness to foreign cooperation, government efficiency, etc., and this aspect has attracted lots of attention in recent GPN studies (Horner, 2017; Coe and Yeung, 2019). Based on data availability, we selected ten specific indicators in the World Bank database to characterize these four important aspects. In addition, we chose the GDP, GDP growth rate and GDP per capita as control variables (Table 1). We use the data in 2015 to build up a Multiple Linear Regression model and the model is as follows:
$Y=\alpha +{{\beta }_{1}}{{x}_{1}}+{{\beta }_{2}}{{x}_{2}}+~......+{{\beta }_{10}}{{x}_{10}}+\varepsilon $
where α represents the intercept, ε is the error term, and x1 to x1a represents the ten specific indicators in Table 1. Y takes PI, PR, PA, and PC for four separate regressions.
Table 1 Explanatory variables and data sources
Explanatory variables Sources Overviews
Control variables Economic aggregate GDP World Bank GDP (logarithm)
Economic growth GDP growth World Bank GDP growth
Output per capita GDP per capita World Bank GDP per capita (logarithm)
Infrastructure level Infrastructure Total railway mileage World Bank Railway (total mileage)
State power and institutional
arrangement
Legal level Force of law World Bank Legal power index
(0 = weak, 12 = strong)
International murder rate World Bank International murder rate (every 100,000 people)
Government
efficiency
Customs clearance
efficiency
World Bank Logistics performance index: Efficiency of clearance procedures (1 = very low, 5 = very high)
Taxation of GDP World Bank Revenue (proportion of GDP)
Openness Net foreign direct investment (FDI) inflows World Bank Net inflows of FDI
Import share World Bank Import of goods and services
(proportion of GDP)
Science and
education level
Science and
education level
Educational
expenditure
World Bank Total public expenditure on
education (proportion of GDP)
Resource
endowment
Natural resources Export of ore
and metal
World Bank Export of ore and metal (proportion of merchandise exports)
Labor price The proportion of male agricultural personnel World Bank Male agricultural personnel
(proportion of male personnel)

4 Results and analysis

4.1 Overall trends of global production cooperation

Since 1995, GPNs have generally experienced four stages: expansion, contraction, re-expansion, and re-contraction. The first stage was the rapid expansion process from 1990 to 1997. From 1990, developed countries such as those in Europe, Americas, and Japan, as well as newly-developed industrial countries such as the “Four Asian Tigers”, rapidly transferred labor-intensive industries (along with low-tech and high-energy-consuming industries) to developing countries and the expansion of globalization was accelerating. The proportion of intermediate products in export worldwide increased from 65.22% to 68.86% during this stage, with an annual average increase of 0.52%. From 1995 to 1997, the average growth rate reached 1.14%. The second stage was the rapid decline from 1997 to 1999. In 1997, the Asian financial crisis hit the global economy, global production cooperation contracted sharply, and the proportion of export intermediates fell rapidly to 66.15%. However, this process did not last for a long time. After 1999, the global production cooperation began to recover and entered the third stage. From 1999 to 2008, it experienced a period of continuous expansion. The growth rate was slower than in the first stage. By 2005, the proportion of export intermediates increased to 68.26%, with fluctuations during the period. From 2005 to 2008, the false prosperity caused by the subprime loan expansion was reflected in the global production cooperation-the growth rate of export intermediates dropped significantly, and the proportion increased by 0.11% in 2008. After the 2008 financial crisis, global production cooperation began to shrink again and entered the fourth stage. As compared with the short-term contraction after the 1997 Asian financial crisis, the impact of the 2008 financial crisis was significantly larger. After a rebound from 2009 to 2011, the proportion of export intermediates began to decline again. The most severe reduction happened from 2014 to 2015, with the proportion falling from 67.87% to 65.61%.
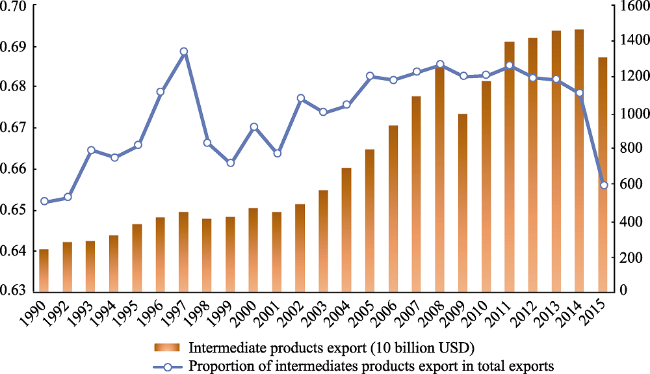
Figure 1 Amount and proportion of global intermediate products export
From the geographical distribution of the change in the proportion of global intermediate products from 1990 to 2015, it can be seen that the countries with increases in proportion were mainly located in the vicinity of large international production centers. For example, they included Canada, Colombia, and Peru, which are close to the United States; Mongolia, Kazakhstan, South Asian countries, and Southeast Asian countries, which are close to China; Central and Eastern European countries, which are close to Europe; and coastal countries in northern Africa. The above shows that although technological progress has produced spatial compression effects in the process of global economic cooperation and has decreased the friction caused by spatial distance, the geographical position still plays a vital role in the global economy. From 2011 to 2015, during the long-term decline in global production activities, the regions with the largest decline in the proportion of export intermediates were mainly multinational production communities led by developed countries. For example, they included the American production community led by the United States and containing Canada, Mexico, and Brazil, and the European production community led by the European Union.

4.2 Analysis of GPN communities

In 1995, the global production center included two major communities, the United States and Germany. As a result, the global production cooperation network was divided into two major communities, with the United States and Germany as the core. Among them, the community with Germany as the core mainly included Europe and northern Africa, whereas most of the other countries in North America, South Asia, East Asia, and Southeast Asia belonged to the United States core community. It also included two very small communities isolated from the two major production centers, namely, South American production communities made up of countries such as Brazil, Argentina, and Bolivia in South America, and a southern African production community formed by South Africa, Zambia, Zimbabwe, and other countries in southern Africa. At this time, the countries with the highest inflow and outflow of intermediates in the entire network were the United States and Germany; the total amount of inflow/outflow of the United States was higher than that of Germany. These two were followed by Japan, France, the United Kingdom, Italy, Canada, the Netherlands, Belgium, and other countries. The flows of China, South Korea, Singapore, and Malaysia remained very small. By 2001, the economic strength of the developing countries in East Asia and Southeast Asia that had undertaken international capacity transfer had increased rapidly. The flying-geese structure formed by Japan, the “Four Asian Tigers,” and the developing countries in East and Southeast Asia strengthened the relations in production cooperation within the region. For example, a community was formed of South Asia, Southeast Asia, some Middle East countries, and East Asian countries with Japan as the core, separate from the community with the United States as the core. Therefore, the world formed three major production network communities, with the United States as one core, Germany as a second core, and Japan as a third core.
In 2008, China surpassed Japan as the largest production center in Asia. With the strengthening of production cooperation between China and the United States, Asian countries joined the United States core community, and the GPNs structure reverted to the two major communities from 1995: the United States core community and the German core community. The difference was that a small community in southern Africa was merged into the community led by the United States, whereas Russia and several former Soviet states were separated from the community with Germany as the core, to thereby form a new community. The financial crisis dramatically affected the global economy, and the global economic structure underwent a significant transformation. With the strengthening of China’s economy, Asian countries once again separated from the community led by the United States, forming a community with China as the core, and its secondary cores included Japan, South Korea, Singapore, and Malaysia. It could be seen that South American countries such as Brazil also merged into the US-led community, hoping to weaken the negative impacts of the economic crisis by strengthening production cooperation. The debt crisis emerged in Europe before the impacts of the financial crisis were over, greatly weakening The European production cooperation with African countries. By 2015, not only South Africa, Zambia, and Zimbabwe, and other southern African countries, but also northern African countries like Sudan and Niger, had separated from the European production communities to form a new African production community.
In summary, the core countries of GPNs have evolved from two major communities led by the United States and Germany to two large communities led by the United States and Germany plus one smaller community led by China, then to three large communities led by the United States, Germany, and China. During those periods, Germany surpassed the United States to become the world’s largest production center, but after the 2008 financial crisis, it fell behind the United States and ranked second. In addition, China has become the country with the most significant increase in the inflow and outflow of intermediate goods, accounting for a global share increase from 2.22% to 10.75%. Other countries with large increases include South Korea, Singapore, Malaysia, and Indonesia.
From the perspective of the community’s share of the global network, the German-based community has always been the world’s largest production community, and its proportion is relatively stable. From 1995 to 2015, its proportion declined from 54.00% to 46.15%. The decline was mainly owing to the increase in the proportion of East and Southeast Asian countries outside the community. In contrast, the US-led community has changed significantly, from 44.25% in 1995 to 26.60% in 2001, then to 45.75%, and dropping to 21.35% in 2015. At that time, the scale was already less than the China-led Asian community, whose proportion was 31.85%. In 2015, the world formed three major production communities with Germany, China, and the United States as the cores, in addition to isolated production communities in African countries (with a share of only 0.64%).
To examine the GPN community segmentation in more detail, the resolution is adjusted to0.8, and a more detailed community situation for each year is shown in Figure 3. As is shown above and as compared with Figure 2, the former Soviet Union (headed by Russia) was separated in 1995 from the German-centered community, indicating that the production cooperation links established during the Soviet period still have strong historical path dependence, and are not deeply integrated into the production network of Western European countries. Similarly, in 2008, Nordic countries such as Norway, Finland, Sweden, and Denmark were separated from the German-centered community. In 2015, Brazil and other South American countries, and Russia and other former Soviet countries maintained the stability of their internal production communities. In general, since 1995, the GPN community can be divided into European communities, North American communities, South American communities, African communities, and Asian communities. The evolution of the GPN pattern mainly manifests in the process of strengthening or weakening production cooperation between communities, based on the evolution of the external economic environment and the choices of internal economic development strategies.
Figure 2 GPNs communities and evolution
Figure 3 Subdivided communities and evolution of GPNs
In view of the large integrations and separations, the subdivided production network community still maintains internal continuity. When the global economy develops well, there is a decentralization trend among communities, and small-scale production communities are strengthened. However, when the global economy is facing a crisis or recession, smaller-scale production communities have no ability to confront these challenges and will ordinarily choose to cooperate with Germany, the United States, China, or other large production communities for strength. Under the continuous downturn caused by the financial crisis, countries choose a strategic orientation for stimulating the economy as a community. From this perspective, although the proportion of global export intermediates tends to decline, the intent to cooperate between countries, especially the production communities, tends to strengthen. Cooperating, as a community, has become an important approach to combating global economic risks. However, the inclusiveness of this process needs to be considered. As can be seen from Figure 2, some African countries remained isolated in 2015, further widening the global economic development gap.

4.3 The degrees of countries participation in GPNs from three dimensions

The intensity of participation in GPNs by various countries in 2015 is shown in Figure 4. It can be seen that the countries with a high intensity of participation are mainly distributed in Africa and Europe, especially in Central and Eastern Europe. The former includes countries such as Sudan, Zimbabwe, and Ethiopia, which are mostly low-income countries. Those countries export products (mainly agricultural and natural resources products), and they are upstream of the production chain. They are added to GPNs as raw materials, increasing the proportion of indirect value-added exports (IV). In contrast, the high-end components included in the manufacturing products are mainly imported, and the included domestic value-added is mainly in the form of low-cost labor and primary industrial products, so the foreign value-added (FV) is high. As a result, they both improve the value of the intensity of the participation index. In the EU countries, the degree of integration is high, the production cooperation is extensive and in-depth, the partial work in the region is relatively perfect, and the proportion of foreign value-added in the region is generally high. In contrast, the Central and Eastern European countries, such as Moldova, Serbia, Belarus, San Marino, Luxembourg, Montenegro, and Slovakia, are considered relatively low-income countries; their labor force is cheaper, and the high value-added activities are fewer. There is a higher proportion of use of the added value from Germany, France, and other developed countries. The spatial distribution of the intensity of participation is very different from that of the dominant countries in GPNs. The intensity of participation in China, the United States, and Russia is lower than that in Sudan, Zimbabwe, and other African countries. This phenomenon also confirms that Koopman’s global value chain participation index is too one-sided and is insufficient for adequately and comprehensively demonstrating the extent to which countries participate in GPNs.
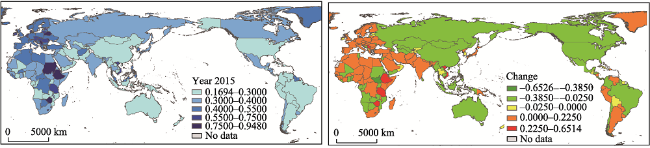
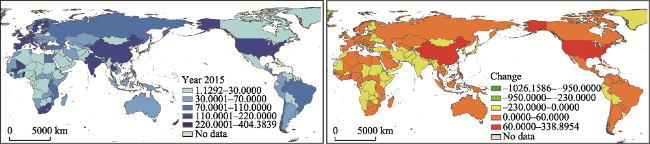
Figure 4 The intensity of participation distribution and changes
The range of participation and its changes are shown in Figure 5. The countries with a high range of participation are mainly the United States, China, India, and developed countries in Western Europe and Northern Europe. These are countries with robust manufacturing
and a wide range of manufacturing products and diversified international markets. African countries such as Sudan, Ethiopia, and Zimbabwe have high participation in the intensity index, but they have a very low geographic coverage of products and are ranked lowest among all countries. This indicates that their external production cooperation is mainly limited to a very small number of neighboring countries. From this perspective, these countries are not widely involved in GPNs. A similar situation also includes Central and Eastern European countries, although their participation in GPNs is relatively stronger. The links are mainly limited to developed countries in Western Europe, and the product range is limited. From the perspective of changes in countries, the countries with narrow geographical participation in products are mainly distributed in northeastern and southwestern Africa, Central and Eastern Europe, and South Asia. However, in North America, Western Europe, and Southeast Asian countries, the geographical participation in products has risen, with the most significant countries being the United States and China.
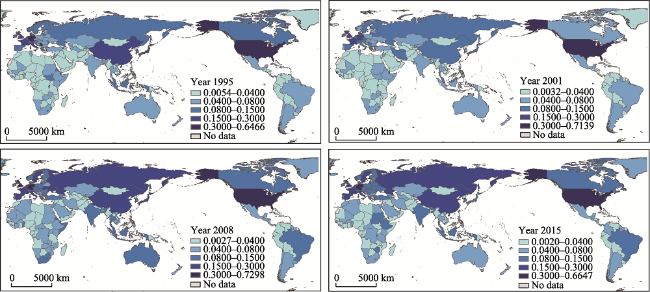
Figure 5 The range of participation distribution and changes
The positions of participation are shown in Figure 6. The top countries are the United States, China, Russia, and the developed countries in Western Europe. It can be found that these countries, with a high participation index, are the core countries of their respective production communities, and they have strong control and coordination capabilities in the community. They include the United States production community in North America; Germany, France, and the United Kingdom in the European community; China in the East Asian and Southeast Asian communities; Russia in the former Soviet Union communities; and Brazil in the South American community. There are gaps in the level of development within each community, which is conducive to the development of the division of labor and provides scope for comparative advantage. As the core country of the North American production community, the United States has numerous foundry factories in Canada and Mexico and has a broader network of foundries around the world, as well as low-end outsourcing manufacturing, labor-intensive activities, and a focus on the development of high value-added production activities. This approach is followed by China. It is necessary to state that the level of technology in a country itself is highly correlated with the level of participation in GPNs, but the relationship is not entirely consistent. To increase the employment rate, developed countries will still retain some low value-added production activities to reduce social unrest. Therefore, although China’s technology development level is lower than that of Germany, France, and other countries, its participation index is higher. Since joining the WTO, China has greatly shared the benefits of globalization, and the level of economic development has rapidly increased. In 2013, the Belt and Road Initiative was proposed to demonstrate China’s development strategy choices and accelerate the “going out” pace. With the improvement of China’s manufacturing capacity and technology, “the flying-geese structure” has tended to evolve further and expand. China has begun to selectively transfer production capacity to Southeast Asian countries with relatively backward development and has enhanced the organization and control capabilities of GPNs.
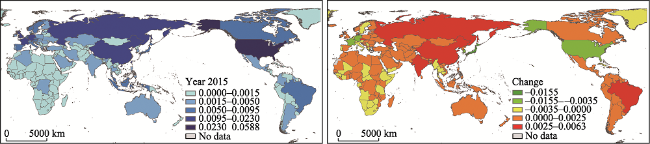
Figure 6 The position of participation distribution and changes
European countries have more diverse levels of economic development, including financial countries such as Finland and Sweden; powerful manufacturing countries such as Germany and the United Kingdom; sub-powerful manufacturing countries such as Italy, Spain, and Belgium; as well as relatively backward countries such as Serbia, Montenegro, and Romania. Developed countries in Western Europe have shifted low-end production processes to Central and Eastern European countries, enabling more specialized production of high value-added products. The same is true for Russia’s production outsourcing activities in Ukraine, Belarus, Kazakhstan, and other countries, and Brazil’s outsourcing activities in countries such as Bolivia and Paraguay.
In terms of the evolution over time, from 1995 to 2015, the countries whose position of participation dropped significantly were mainly the developed countries, such as the United States, Germany, France, Japan, and South Korea, whereas the position of participation increased in the “BRICS” countries, such as China, India, Russia, and Brazil. The rise of the BRICS countries is different from the past approach, i.e., passively taking over the elimination of production capacity in developed countries. Instead, in the process of undertaking global capacity transfer, the BRICS countries have carried out active industrial upgrades and gradually established a regional production network community with a leading position. They have worked as organizers and engaged in more advanced production activities. In this context, some high value-added production activities originally dominated by developed countries have been infiltrated by emerging industries, such as those in BRICS countries, resulting in a decline in the participation positions of developed countries.

4.4 The comprehensive participation index and its evolution

Finally, the degree of participation of countries in GPNs can be evaluated from the perspective of integrated participation. The countries with the highest level of participation in GPNs include the United States and China and developed countries in Western Europe. Among them, the United States is a superpower; since 1995, its comprehensive participation has been ranked first. It is followed by Germany and the United Kingdom, and the rankings are relatively stable; in 2015, they occupied the second and fourth places, respectively. The countries with the largest increases were China, Russia, and Southeast Asian countries. Before China joined the WTO, its ranking had large fluctuations. After China’s joining, it began to exhibit a substantial increase, from 17th in 2002 to 5th in 2005. After the 2008 financial crisis, it began to increase again. It has improved and surpassed the United Kingdom in 2013, becoming third in the comprehensive participation index. The ranking of Russia rose from 24th in 1995 to 6th in 2015, and Malaysia rose from 22nd in 1995 to 14th in 2015. In contrast, Japan experienced a sharp decline. Japan ranked 7th in 1995, but by 2008, owing to the financial crisis, the Internet bubble, and the Japanese real estate bubble, the rankings were volatile. There was not a significant downward trend, but after the 2008 financial crisis, Japan’s ranking fell sharply to 31st in 2011.
The concentration index of the national comprehensive participation index was calculated to measure the difference in the degree of participation in the production network between countries. Since 1995, the overall downward trend has been decreasing, but the process has fluctuated. The volatility pattern is as follows: each global economic crisis causes the concentration index to increase, i.e., the differences between countries increase. For example, after the Asian financial crisis, the Internet bubble, and the 2008 financial crisis, the concentration index increased. As mentioned above, following turmoil in global economic operation, there is a phenomenon of increased community effort to cope with the crisis. However, this process is not balanced. Countries with poor economic development are often excluded from this process and find it more difficult to mitigate the negative impacts of the global economic turmoil, further widening the development gap with developed countries. Overall, the spatial distribution pattern of comprehensive participation in GPNs has not undergone fundamental changes since 1995, but there is a trend of fundamental changes. The three major patterns of the United States, Europe, and China have continued, but the more detailed power structure relationship is undergoing major changes, especially in regards to the participation of GPNs in the BRICS countries and Southeast Asian countries (Figure 7).
Figure 7 Comprehensive participation distribution

4.5 The identification of driving factors

According to the regression results, all four models are more than 99% significant, and the variance inflation factor values are all less than 10, which means that there is no significant collinearity (Table 2). Thus, the regression results are robust. First, the influencing factors of comprehensive participation were examined, and the indicators that were more than 90% significant included the total railway mileage, international murder rate, customs clearance efficiency, taxation of the GDP, net foreign direct investment (FDI) inflows, educational expenditures of the GDP, proportion of ore and metal exports, and proportion of male agricultural personnel. Among these indicators, the international murder rate and proportion of ore and metal exports showed negative correlations. The international murder rate represents a country’s legal and security capabilities. When countries seek cooperation, they are more likely to cooperate with countries with a sound legal system. Otherwise, the security of the property will be affected, and the risk of investment will increase. Abundant mineral resources can promote the economic development of a country to a certain extent. However, a country will surely suffer “resource curse” and be marginalized by GPNs if it becomes excessively dependent on mineral resources. Since the 1980s, an increasing number of countries rich in resources have fallen into a growth trap, with sluggish or even stagnant economic growth (Lin, 2014). Countries that rely on resources tend to ignore the significance of soft power, such as technological progress and human capital enhancement, which is fundamental for continuous participation in GPNs, adaptation to global economic shifts, and promotion of status in GPNs.
Table 2 Regression results
Influencing factors Intensity of participation Range of
participation
Position of participation Comprehensive participation Variance inflation factor (VIF)
GDP (logarithm) 1.6781*
(0.9608)
-5.9862
(3.6460)
-0.0119
(0.0179)
-0.0523
(0.2540)
3.923
GDP growth -0.4581*
(0.2734)
1.5063
(1.0375)
0.0103**
(0.0051)
0.0857
(0.0723)
1.507
GDP per capita (logarithm) -0.1473
(0.0956)
-1.0325***
(0.3628)
-0.0028
(0.0018)
-0.0717***
(0.0253)
3.596
Total railway mileage 2.4680**
(1.0283)
10.6174***
(3.9021)
0.2100***
(0.0191)
2.1518***
(0.2718)
5.467
Force of law 1.4806***
(0.4373)
-3.1977
(2.6594)
-0.0261
(0.0281)
-0.16267
(0.1156)
1.525
International murder rate -0.4299***
(0.0905)
-0.7893**
(0.3435)
-0.0013
(0.0017)
-0.0870***
(0.0239)
1.324
Customs clearance efficiency 3.6329
(3.7688)
57.9892***
(14.3008)
0.3584***
(0.0701)
5.5934***
(0.9961)
4.834
Taxation of GDP 0.8331***
(0.2149)
3.3062***
(0.8153)
0.0015
(0.0040)
0.1978***
(0.0568)
1.857
Net FDI inflows 0.3815
(0.3594)
-0.644
(1.3637)
0.0181***
(0.0067)
0.2247**
(0.0950)
3.740
Import of GDP 0.2093***
(0.0477)
-0.2911
(0.1812)
-0.0007
(0.0009)
0.0123
(0.0126)
1.664
Educational expenditure of GDP -1.7135
(1.0610)
5.1972
(4.0262)
0.0703***
(0.0197)
0.6463**
(0.2804)
1.897
Proportion of ore and metal exports -0.2128***
(0.0773)
-0.7980***
(0.2935)
-0.0007
(0.0014)
-0.0524**
(0.0204)
1.132
Proportion of male agricultural personnel 0.0507**
(0.0200)
0.3326
(0.2488)
-0.0024*
(0.0012)
0.0396**
(0.0173)
2.241
F value 8.985 5.839 65.498 42.853
R square 0.453 0.350 0.858 0.798
P value 0.000 0.000 0.000 0.000
The factors showing positive correlations include the total railway mileage, customs clearance efficiency, taxation of the GDP, net FDI inflows, the educational expenditure of the GDP, and the proportion of male agricultural personnel. The level of infrastructure, government efficiency, and the government’s economic capacity all contribute to participation in GPNs, highlighting the significance of government. Neoliberalism opposes any unnecessary intervention by the state and government and emphasizes the significance of economic laws and a free market. However, transnational economic cooperation is not a purely economic activity and is not only affected by economic laws, but also by geopolitics and socio-cultural differences. Geopolitics itself is dominated by the government. The government’s capability to collect international socio-cultural information is higher than that of the enterprises themselves, and it can save costs and maximize positive spillover effects. In response to global economic turmoil, the state has a stronger capacity to mobilize resources; thus, government and institutional actors play crucial roles in GPNs. The positive impact of the net FDI inflows indicates the significance of capital abundance to participation in GPNs. Nurkse (1953) proposed the theory of a “vicious circle of poverty” in his book “The Problems of Capital Formation in Underdeveloped Countries,” arguing that capital scarcity was the key factor hindering the economic development of developing countries. The shortage of capital impedes the expansion of production scale, making it difficult for enterprises to exert scale effects, and reducing product competitiveness. Moreover, technological advancement requires a large amount of capital to support the promotion of research and development, and a lack of capital will lead to a dilemma in upgrading products, as enterprises become trapped in low-end production. The educational expenditures of the GDP and the proportion of male agricultural personnel underline the significance of human capital.
The disparities in the influencing factors between the comprehensive participation index and the other three participation indexes are also investigated. In that regard, the ratio of imports to GDP has a positive effect on the intensity of participation in GPNs. The proportion of imports in the GDP indicates the degree of openness. Undoubtedly, a government’s opening-up policy will have a great impact on participation in GPNs, as can be seen from the rapid development of China’s foreign cooperation since its reform and opening-up. Second, the proportion of male agricultural personnel shows a significant positive correlation with the intensity of participation, but a negative correlation with the position of participation. With cheap labor, it is conducive to undertake labor-intensive industries, so as to enhance the intensity of participation in GPNs. However, human capital is a relative concept that requires a comprehensive measure of both labor quality and labor price. For the same quality of labor, the lower the price, the more competitive it will be in international production, which is the core reason for the rapid economic development of China and Southeast Asian countries. However, it is unsustainable to rely on demographic dividends to develop the economy solely, and it is easy to fall into the middle-income trap. Therefore, while giving full play to the role of cheap labor, the government should take initiatives to upgrade human capital and strengthen education and skill training.

5 Concluding remarks

This study analyzes the pattern and evolution of GPNs through quantitative research based on the input-output technique, and identifies the influencing factors of participation in GPNs at a macro level. While filling in the vacancies in existing research, this study also enriches the quantitative methods of GPN research. Furthermore, the results of the study can provide support for policymakers to promote the integration of their economies into GPNs. The main research conclusions are as follows.
From 1995 to 2015, the overall pattern of GPNs experienced four processes: expansion during the rise of the “Four Asian Tigers,” contraction during the Asian financial crisis, re-expansion after 1999, and re-contraction after the 2008 financial crisis. The impact of the financial crisis in 2008 on GPNs was more profound than that of the 1997 Asian financial crisis. On the national scale, countries with increasing proportions of intermediate product exports were mainly located in the vicinity of large international production centers, indicating that although technological progress has produced space compression effects, spatial proximity still plays a significant role in GPNs.
The core communities of GPNs evolved from two major production communities (Europe and the Americas) to three pillars (Europe, Americas and Asia) while more segmented communities are mainly affected by geographical proximity. The latter consists of European, North American, South American, African and Asian communities. Accordingly, the core nations have transitioned from the United States and Germany to the United States, Germany, and Japan, and then to the United States, Germany, and China. The evolution of the GPN pattern primarily manifests as a process of cooperation strengthening or weakening among communities, based on changes in the external environment and the need for individual development strategies.
There are significant differences in the patterns of countries’ participation in GPNs measured from different dimensions. Countries with high intensity of participation index are mainly distributed in African countries that mainly export agricultural products and natural resources, as well as European Union countries with a high degree of division of labor and integration within the region. Countries with a high range of participation index are mainly manufacturing powerhouses with various kinds of products and a huge international market share, such as the United States, China, India, and countries in Eastern and Northern Europe. Countries with a high position of participation index are countries with strong control and coordination ability in GPNs, such as the United States, Germany, China, Russia, and Brazil. They are also the core countries in their communities.
From the perspective of the comprehensive participation, the United States has always ranked first in the world, followed by Germany and the United Kingdom, occupying the second and fourth places, respectively, in 2015. The countries with the greatest improvement in ranking from 1995 to 2015 are China, Russia, and the Southeast Asian countries. China surpassed the United Kingdom in 2013, ranking third, whereas Japan experiences the largest drop in ranking, from 7th in 1995 to 22nd in 2015. During periods of stable international economic situation, the gap among countries in participation degree of GPNs tends to shrink, whereas during a period of economic turmoil, the gap tends to enlarge. This is mainly due to the obligated decoupling of low-income and middle-income countries.
Compared to the three factors at the enterprise level that influence the evolution of GPNs as indicated by GPN 2.0 (Yeung and Coe, 2015), the factors at a national level such as government efficiency and infrastructure level significantly promote the participation in GPNs, which highlights the significance of government to a country’s participation in GPNs. Education level and capital abundance are also positive drivers. Both natural resources and demographic dividends can enhance the participation of a country in GPNs to a certain extent, but excessive dependence may cause catastrophic consequences such as “resource curse” and “low-end locking.”
[1]
Baker L, Sovacool B K, 2016. The political economy of technological capabilities and global production networks in South Africa’s wind and solar photovoltaic industries. Political Geography, 60:1-12.

DOI

[2]
Blažek J, 2016. Towards a typology of repositioning strategies of GVC/GPN suppliers: The case of functional upgrading and downgrading. Journal of Economic Geography, 16(1):849-869.

DOI

[3]
Blondel V D, Guillaume J L, Lambiotte R et al., 2008. Fast unfolding of communities in large networks. Journal of Statistical Mechanics: Theory and Experiment, P10008.

[4]
Boffa M, 2018. Trade linkages between the Belt and Road economies. The World Bank, 1-18.

[5]
Boguñá M, 2007. The structure and dynamics of networks. Journal of Statistical Physics, 126(2):419-421.

DOI

[6]
Bridge G, 2008. Global production networks and the extractive sector: Governing resource-based development. Journal of Economic Geography, 8(3):389-419.

DOI

[7]
Bu Guoqin, 2007. Global production networks and the study of Chinese industrial upgrading[D]. Changchun: Jinan University, 5-20. (in Chinese)

[8]
Cen Lijun, 2015. China’s division of labor and trade status in GPNs: A research based on TiVA data and GVC index. Journal of International Trade, (1):3-13,131. (in Chinese)

[9]
Cheng D Z, 2015. China’s integration into the global value chains: A transnational input-output analysis. Economic Research Journal, 50(9):4-16, 99. (in Chinese)

[10]
Chor D, 2019. Modelling global value chains: Approaches and insights from economics. In: Gereffi G, Ponte S, Raj-Reichert G (eds). Handbook of Global Value Chains. Edward Elgar: Cheltenham, 105-118.

[11]
Christian M, 2016. Kenya’s tourist industry and global production networks: Gender, race and inequality. Global Networks, 16(1):25-44.

DOI

[12]
Clauset A, Newman M E J, Moore C, 2004. Finding community structure in very large networks. Physical Review E, 70(6):066111.

DOI

[13]
Coe N M, 2012. Geographies of production II: A global production network A-Z. Progress in Human Geography, 36(3):389-402.

DOI

[14]
Coe N M, 2014. Missing links: Logistics, governance and upgrading in a shifting global economy. Review of International Political Economy, 21(1):224-256.

DOI

[15]
Coe N M, Dicken P, Hess M et al., 2009. Making connections: Global production networks and world city networks. Global Networks, 10(1):138-149.

DOI

[16]
Coe N M, Hess M, 2010. Local and regional development. Handbook of Local and Regional Development, 128-138.

[17]
Coe N M, Hess M, Yeung H W et al., 2004. ‘Globalizing’ regional development: A global production networks perspective. Transactions of the Institute of British Geographers, 29(4):468-484.

DOI

[18]
Coe N M, Yeung H W, 2019. Global production networks: Mapping recent conceptual developments. Journal of Economic Geography, 19(4):775-801.

DOI

[19]
Dallas M, Ponte S, Sturgeon T, 2017. A typology of power in global value chains. Copenhagen Business School, Working Paper, 1-35.

[20]
De Backer K, Miroudot S, Mapping global value chains. Organization for Economic Co-operation and Development Trade Policy Papers, No.159, Organization for Economic Co-operation and Development Publishing, Paris. http://dx.doi.org/10.1787/5k3v1trgnbr4-en.

[21]
Dicken P, 2015. Global Shift: Mapping the Changing Contours of the World Economy. New York, USA: The Guilford Press, 14.

[22]
Dicken P, Kelly P F, Olds K et al., 2001. Chains and networks, territories and scales: Towards a relational framework for analysing the global economy. Global Networks, 1(2):89-112.

DOI

[23]
Dicken P, Thrift N, 1992. The organization of production and the production of organization: Why business enterprises matter in the study of geographical industrialization. Transactions of the Institute of British Geographers, 17(3):279-291. https://doi.org/10.2307/622880.

DOI

[24]
Dolan C, Humphrey J, 2000. Governance and trade in fresh vegetables: The impact of UK supermarkets on the African horticulture industry. Journal of Development Studies, 37(2):147-176.

DOI

[25]
DÖrry S, 2015. Strategic nodes in investment fund global production networks: The example of the Financial Centre Luxembourg. Journal of Economic Geography, 15(4):797-814.

DOI

[26]
Fan Maoqing, Huang Wei, 2014. Research on the evolution of China’s trade industry structure based on the decomposition of global value chains. The Journal of World Economy, 37(2):50-70. (in Chinese)

[27]
Gary Gereffi, 2018. Global Value Chains and International Development: Framework, Findings and Policies. Shanghai: Shanghai People’s Publishing House, 2-3. (in Chinese)

[28]
Gereffi G, 1994. The organization of buyer-driven global commodity chains: How US retailer shape overseas production networks. In: Gereffi G, Korzeniewicz M. Commodity Chains and Global Development. Westport: Praeger, 95-122.

[29]
Gereffi G, Humphrey J, Sturgeon T, 2005. The governance of global value chains. Review of International Political Economy, 12(1):78-104.

DOI

[30]
Girvan M, Newman M E J, 2002. Community structure in social and biological networks. Proceedings of the National Academy of the Sciences of the United States of America, 99(12):7821-7826.

[31]
Henderson J, Dicken P, Hess M et al., 2002. Global production networks and the Analysis of economic development. Review of International Political Economy, 9(3):436-464.

DOI

[32]
Horner R, 2017. Beyond facilitator? State roles in global value chains and global production networks. Geography Compass, 11(2):e12307. https://doi.org/10.1111/gec3.12307.

DOI

[33]
Huang X H, Yu X, 2017. Rebuilding the global value chain with the “Belt and Road” Initiative. Economist, (3):32-39. (in Chinese)

[34]
Hudson R, 2008. Cultural political economy meets global production networks: A productive meeting? Journal of Economic Geography, 8(3):421-440.

DOI

[35]
Hummels D, Ishii J, Yi K M, 2001. The nature and growth of vertical specialization in world trade. Journal of International Economics, 54(1):75-96.

DOI

[36]
Kano L, 2018. Global value chain governance: A relational perspective. Journal of International Business Studies, 49:684-705.

DOI

[37]
Kenneth Pomeranz, Steven Topik, 2018. The World That Trade Created. Xi’an: Shaanxi Normal University Press, 1-10. (in Chinese)

[38]
Kim I S, Milner H V, Bernauer T et al., 2019. Firms and global value chains: Identifying firms’ multidimensional trade preferences. International Studies Quarterly, 63(1):153-167.

DOI

[39]
Kim S Y, 2019. Hybridized industrial ecosystems and the makings of a new developmental infrastructure in East Asia’s green energy sector. Review of International Political Economy, 26(1):158-182.

DOI

[40]
Kleibert J M, 2016. Global production networks, offshore services and the branch-plant syndrome. Regional Studies, 50(12):1995-2009.

DOI

[41]
Koopman R, Wang Z, Wei S J, 2008. How much of Chinese export is really made in China? Assessing domestic value-added when processing trade is pervasive. National Bureau of Economic Research Working Paper No.14109.

[42]
Koopman R, Wang Z, Wei Shangjin et al., 2010. Give credit where credit is due: Tracing value added in global production chains. National Bureau of Economic Research Working Paper No.16426.

[43]
Koopman R, Wang Z, Wei Shangjin, 2012a. Tracing value-added and double counting in gross exports. National Bureau of Economic Research Working Paper No.18579.

[44]
Koopman R, Wang Z, Wei Shangjin, 2012b. Estimating domestic content in exports when processing trade is pervasive. Journal of Development Economics, 99(1):178-189.

DOI

[45]
Koopman R, Wang Z, Wei S J, 2014. Tracing value-added and double counting in gross exports. American Economic Review, 104(2):459-494.

DOI

[46]
Lawrence J Lau, Chen Xikang, Yang Cuihong et al., 2007. Non-competitive input-output model and its application: An examination of the China-U.S. trade surplus. Social Sciences in China, (5):91-103, 206-207. (in Chinese)

[47]
Lema R, Rabellotti R, Sampath P D, 2018. Special issue: Innovation systems in the era of global value chains. The European Journal of Development Studies, 30:345-574.

[48]
Lin J Y, 2014. The Quest for Prosperity: How Developing Economies Can Take Off-Updated Edition. Princeton University Press.

[49]
Liu Dexue, Fu Dan, Bu Guoqin, 2005. Global production networks, knowledge distribution and upgrading in processing trade. Inquiry into Economic Issues, (12):33-36. (in Chinese)

[50]
Liu Dexue, Su Guifu, Bu Guoqin, 2006. Strategies for upgrading China’s processing trade: From global production network perspective. International Economics and Trade Research, (4):4-8. (in Chinese)

[51]
Liu Weidong et al., 2013. Thinking Method of Economic Geography. Beijing: Science Press, 162-188. (in Chinese)

[52]
Liu Weilin, Li Lanbing, Liu Yuhai, 2014. The impact of global value chain embeddedness on technological sophistication of China’s export. China Industrial Economics, (6):83-95. (in Chinese)

[53]
Liu Z B, Zhang J, 2007. Forming, breakthrough and strategies of captive network in developing countries at global outsourcing system: Based on a comparative survey of GVC and NVC. China Industrial Economy, (5):39-47. (in Chinese)

[54]
Neilson J, Pritchard B, Fold N et al., 2018. Lead firms in the cocoa-chocolate global production network: An assessment of the deductive capabilities of GPN 2.0. Economic Geography, 94(4):400-424. https://doi.org/10.1080/00130095.2018.1426989.

DOI

[55]
Newman M E J, 2006. Finding community structure in networks using the eigenvectors of matrices Physical Review E: 74(3) 036104.

DOI

[56]
Newman M E J, Girvan M, 2004. Finding and evaluating community structure in networks, Physical Review E, 69(2):026113.

DOI

[57]
Niewiadomski P, 2017. Global production networks in the passenger aviation industry. Geoforum, 87:1-14.

DOI

[58]
Nurkse R, 1953. Problems of capital formation in underdeveloped countries. Journal of the Royal Statistical Society, 116(4):467-469.

[59]
Pauls T, Franz M, 2013. Trading in the dark: The medicinal plants production network in Uttarakhand. Singapore Journal of Tropical Geography, 34(2):229-243.

DOI

[60]
Pons P, Latapy M, 2006. Computing communities in large networks using random walks. Journal of Graph Algorithms and Applications, 10191.

[61]
Qiu Bin, Ye Longfeng, Sun Shaoqin, 2012. An empirical study on the impact of GPNs on China’s manufacturing industries’ upgrading in global value chains: An analysis from the perspective of ESI. China Industrial Economics, (1):57-67. (in Chinese)

[62]
Radicchi F, Castellano C, Cecconi F et al., 2004. Defining and identifying communities in networks. Proceedings of the National Academy of the Sciences of the United States of America, 101(9):2658-2663.

[63]
Schmitz H, Knorringa P, 2000. Learning from global buyers. The Journal of Development Studies, 37(2):177-205. https://doi.org/10.1080/713600073.

[64]
Shen N, Zhou J J, 2016. Can participation in the global production networks upgrade Chinese enterprise’s value chain status: Network pies or network trap. Journal of Industrial Engineering/Engineering Management, 30(4):11-17. (in Chinese)

[65]
Starosta G, 2010. Global commodity chains and the Marxian law of value. Antipode, 42(2):433-465.

DOI

[66]
Sun Shaoqin, Qiu Bin, 2011. Research on conduit of technology spillover of FDI under global production networks: An analysis based on the panel data of Chinese manufacturing industries. Nankai Economic Studies, (4):50-66. (in Chinese)

[67]
Sunley P, 2008. Relational economic geography: A partial understanding or a new paradigm? Economic Geography, 84(1):1-26.

DOI

[68]
Tang Haiyan, Zhang Huiqing, 2008. China’s rise and reorganization of East Asian production networks. China Industrial Economics, (12):60-70. (in Chinese)

[69]
UNCTAD, 2013. World Investment Report 2013: Global Value Chains: Investment and Trade for Development. New York: United Nations.

[70]
Wang Z, Wei S J, Zhu K, 2013. Quantifying international production sharing at the bilateral and sector levels. National Bureau of Economic Research, 19677.

[71]
Wei Long, Wang Lei, 2016. From embedding global value chains to leading regional value chains: The economic feasibility analysis of the “One Belt and One Road” strategy. Journal of International Trade, (5):104-155. (in Chinese)

[72]
Wu F, Huberman B A, 2004. Finding communities in linear time: A physics approach. The European Physical Journal B, 38:331-338.

DOI

[73]
Xu Nan, Li Jianjun, 2010. Analysis of transformation and upgrading of Chinese processing trade under international financial crisis: From the view of global production networks. Finance & Trade Economics, (4):98-106,137. (in Chinese)

[74]
Yao Yang, Zhang Ye, 2008. Upgrading the domestic technological contents of China’s exports: Evidence from Jiangsu and Guangdong provinces and China as a whole. Social Sciences in China, (2): 67-82, 205-206. (in Chinese)

[75]
Yao Zhiyi, Zhang Yabin, 2011. Measurement of industrial structure upgrading under the global production network. Nankai Economic Studies, (6):55-65. (in Chinese)

[76]
Yeung G, 2016. The operation of global production networks (GPNs) 2.0 and methodological constraints. Geoforum, 75:265-269.

DOI

[77]
Yeung H W, 2015. Regional development in the global economy: A dynamic perspective of strategic coupling in global production networks. Regional Science Policy & Practice, 7(1):1-23.

[78]
Yeung H W C, 2016. Strategic Coupling: East Asian Industrial Transformation in the New Global Economy. Ithaca, NY: Cornell University Press.

[79]
Yeung H W C, 2018. Economic geography and international business. In: Cook G, Johns J, McDonald F et al. (eds). The Routledge Companion to the Geography of International Business. London: Routledge, 177-189.

[80]
Yeung W C, Coe N M, 2015. Toward a dynamic theory of global production networks. Economic Geography, 91:29-58.

DOI

[81]
Zhang Hui, 2006. Transformation and Upgrading of Local Industrial Clusters under the Global Value Chain System. Beijing: Economic Science Press, 23, 24,28,44. (in Chinese)

[82]
Zheng Z, Song Z, Ji Q et al., 2021. Spatiotemporal evolution of production cooperation between China and Central and Eastern European countries: An analysis based on the input-output technique. Growth and Change. https://doi.org/10.1111/grow.12476.

Outlines

/