Research Articles

Urban planning construction land standard and its revision based on climate and topography in China

  • XU Yong 1, 2 ,
  • ZHAO Shen , 1, 2, * ,
  • FAN Jie 1, 2
Expand
  • 1. Institute of Geographic Sciences and Natural Resources Research, CAS, Beijing 100101, China
  • 2. University of Chinese Academy of Sciences, Beijing 100049, China
Zhao Shen, E-mail:

Xu Yong, Professor, specialized in land use research and carrying capacity of resources and environment research. E-mail:

Received date: 2020-12-08

  Accepted date: 2021-02-20

  Online published: 2021-06-25

Supported by

The Second Tibetan Plateau Scientific Expedition and Research Program, No(2019QZKK0406)

Copyright

Copyright reserved © 2021. Office of Journal of Geographical Sciences All articles published represent the opinions of the authors, and do not reflect the official policy of the Chinese Medical Association or the Editorial Board, unless this is clearly specified.

Abstract

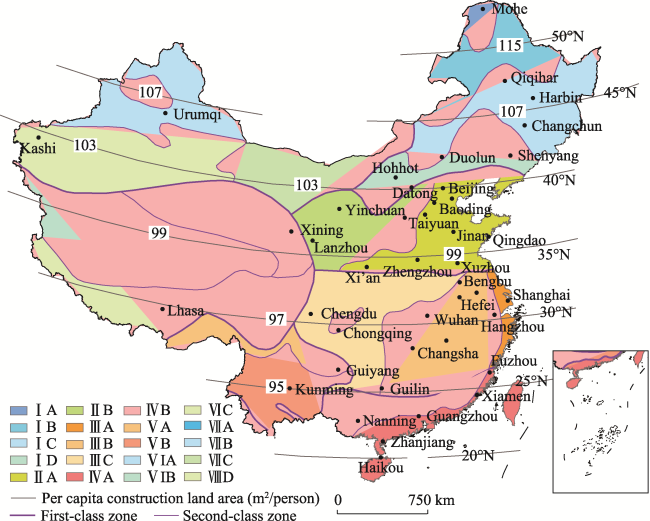
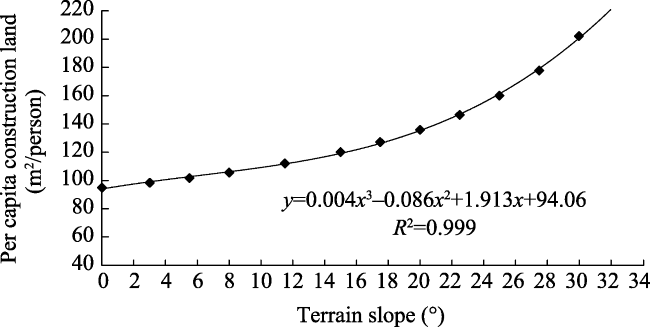
Urban planning construction land standard is the technical specification for scientifically allocating various types of urban construction land, and it is the basis for drawing up and revising the overall urban planning scheme. Considering China’s current urban planning construction land standard, many problems exist, such as the gap in the land use control threshold, the lack of regional differences in the climate revision, and failing to consider the topographic factors. To resolve these problems, this study proposed a step-by-step process framework and quantitative calculation method for the establishment and revision of standards in accordance with the principle of Total-Structure control. By setting the conditions, a universal basic standard for construction land was established. Quantitative analysis was then conducted on the relationship between the basic standard and the selected key indicators, such as urban population size, sunshine spacing coefficient, the width of river valleys or inter-montane basins, and terrain slope, among others. Finally, revised standards were formed for climate conditions, topography, and geomorphologic conditions, which were matched with the basic standards. The key results are three-fold: (1) The per capita construction land standard of 95 m 2/person can be used as the total indicator of China’s urban planning basic standard, and the corresponding per capita single construction land comprises 32.50% of residential land, 7.42% of public management and public service land, 22.50% of industrial land, 17.50% of transportation facilities, 12.50% of green space, and 7.58% of other land-use types. The results of the revision of the urban population size indicate that the difference in population size has little effect on the total amount of per capita construction land. (2) The climate revision results of per capita residential land and per capita construction land in major cities reveal that the revised climate value varies greatly between north and south China. The revised climate values of the per capita area of construction land vary by latitude as follows: the value at 20°N is 93 m 2/person, the value at 30°N is 97 m 2/person, the value at 40°N is 103 m 2/person, and the value at 50°N is 115 m 2/person. The basic standard land value of 95 m 2/person is generally distributed across the Xiamen-Guilin-Kunming line. (3) The cities located in mountainous areas, hilly valleys, or inter-montane basins can reduce the allocation of community parks and comprehensive parks when the average width of an existing river valley or inter-montane basin is less than 2 km. When the average width of the valley or inter-montane basin is between 2 km to 4 km, the allocation of the comprehensive parks can be reduced. The revised results of per capita sloping construction land reveal that the terrain slope greatly affects the revised value of per capita construction land. Specifically, the revised value at 3° is 3.68% higher than the basic standard value, and the increase rates at 8°, 15°, and 25° are 11.25%, 26.49%, and 68.47%, respectively.

Cite this article

XU Yong , ZHAO Shen , FAN Jie . Urban planning construction land standard and its revision based on climate and topography in China[J]. Journal of Geographical Sciences, 2021 , 31(4) : 603 -620 . DOI: 10.1007/s11442-021-1861-9

1 Introduction

Construction land refers to the land for buildings and structures, which supports residential, production, and engineering sectors. Construction land is generally classified into urban and rural residential land, public management and public service land, commercial service land, industrial and mining storage land, transportation land, military land, and water conservancy facilities (GB 50137-2011; GB/T 21010-2017). Compared with other types of land use, construction land use is highly concentrated, the labor force and capital density per unit area are high, and the economic output benefits are abundant. Therefore, its continuous expansion has played a positive role in promoting industrialization, urbanization, and acceleration of economic and social development in China over the past 40 years (Lu and Fan, 2009). However, construction land development is considered non-ecological utilization, which is difficult to reverse. In addition, it has strong location sensitivity and high demand for natural conditions such as topography and geology. The land occupied by the continuous expansion of construction land is primarily high-quality cultivated land with favorable location conditions and high quality, which has caused tremendous pressure on food security (Brown, 1995; Chen, 1999; Qu et al., 2007). This inherent structural contradiction can easily lead to the dilemma confronting the national construction land management and control policy. Specifically, a strict control policy for construction land may affect the overall development of the country, while a lenient control policy may lead to excessive expansion and the disorderly spread of construction land (Cai et al., 2002; Dan et al., 2004; Lu and Fan, 2009).
To properly solve the problems noted above, the state has carried out the management and control of construction land from two aspects since the end of the 1980s. First, through the promulgation and revision of the land administration law, the urban and rural planning law, and the formulation of cultivated land and basic farmland protection regulations, the scale of construction land and the occupation of agricultural land by construction land are controlled. Second, the increment of construction land and the structure of construction land are controlled by establishing the standards of construction land in cities, towns, and villages and the standards of rural residential land (Li and Jiang, 2008; Lin et al., 2009; Qiao et al., 2010). However, according to the phased characteristics of the change in the amount of construction land area in China from 1984 to 2015, the effect of the adopted control measures is unsatisfactory (Wu and Qu, 2007; Han et al., 2010; Zhou et al., 2012). In 1984, the national construction land area was 2481.36 × 104 ha, accounting for 2.61% of the total land area. By 2007, the area of construction land in China had increased to 3305.78 × 104 ha, accounting for 3.48% of the total land area. The average annual increase of construction land during the 23 years was 3584.43 × 104 ha, with an annual average increment rate of 1.26%. By 2015 (based on the change in land use updated survey data), the national construction land area had reached 3583.33 × 104 ha, accounting for 4.06% of the total land area. The annual average increase of construction land from 2007 to 2015 was 6919.38 × 104 ha, which was 1.93 times the average of the previous 23 years, and the annual average growth rate was 1.95%. It continues to be an arduous task for the Chinese government and academia to explore reasonable and effective countermeasures for the management and control of construction land in the future (Liu et al., 2005; Sun and Cai, 2008; Dai et al., 2010).
As the main increment of agricultural land (especially high-quality cultivated land) occupied by construction land, the expansion of urban construction land has been the primary target of control by the relevant Chinese government departments through the establishment of related standards and delineation of development boundaries (CCCPC and SC, 2015; 2016). The standard of urban construction land is the technical norm formulated for the scientific and rational allocation of various types of construction land and the preparation and revision of the urban master plan for newly built cities or urban development zones, which has such attributes as foundation, restriction, developmental phases, and regional differences. China’s current urban construction land standards were promulgated by the Ministry of Housing and Urban-Rural Development of the People’s Republic of China (MOHURD) in 2012. It inherited the components of the standards promulgated in 1990 (GBJ 137-90, 1990) and was revised based on the current urban planning situation of 323 cities by adding two factors: urban population size and sunshine conditions. The current standard adopts the Total-Structure construction method, consisting of planned per capita construction land index, planned per capita single construction land use index, and hierarchical and sub-type construction land. The planned per capita construction land index belongs to the total amount of urban planning and construction land use control indicators, which is used to determine the overall scale of construction land for new urban districts or urban expansion zones. The planned per capita construction land index and its subordinate construction land structure belong to the urban planning and construction land structure control index, which is utilized to determine the refined layout of the construction land of new urban districts or urban expansion areas. However, since the promulgation of the standard, the academic community has continued to question it, primarily focusing on the issue that the standard value of planned per capita construction land is essentially determined by the status quo indicator. That is, the standard values are high for areas with high current indicators, while the standard values are low for areas with low current indicators, which results in a large gap. In addition, the actual operation is not based entirely on the current standards. The planned per capita construction land of 100 m2/person has long been regarded as a common standard by the urban planning industry (Jiang, 1996; Tu et al., 2013). In the process of delineating the urban development boundary in the provincial spatial planning pilot program in 2017, some cities distributed in mountainous and hilly areas were found to have significantly lower planned per capita construction land standards stipulated by the current standard, which is far from the requirements for urban expansion land of the local governments based on 100 m2/person. Combined with the pilot research work on spatial planning in Fujian Province and Liupanshui City, Guizhou Province, after re-examining China’s current urban planning and construction land standards, it was found that in addition to the above problems, the current planned per capita construction land standard includes factors such as climate conditions and sunshine conditions but lacks spatial value differentiation for sunshine spacing coefficient (Mao, 2009; Wang and Zhao, 2011), does not include topographic factors, and fails to provide differentiated standards for cities that are located in mountainous and hilly areas.
To address the problems outlined above, according to the main guidelines of the Total-Structure control theory, the research presented in this paper has formulated the basic standard of urban planning construction land, primarily focusing on the determination of basic standards, population size revision, climate revision, and topography revision. Then, based on this, key indicators such as urban population, sunshine spacing coefficient, valley (basin) width, and terrain slope were selected; and, by quantitatively analyzing the relationship between each indicator and the basic standard, the revised standards for population size, climate, and topography aligned with the basic standards were proposed. The significance of this research is to provide a scientific basis for the formulation of China’s new urban planning and construction land standards. Specifically, (1) establish a national unified urban planning and construction land standard for per capita construction land and per capita single construction land; (2) set up quantitative revision mathematical models for the types of urban planning and construction land involved in the revision of related elements and indicators; and (3) determine the revised standard values for population size, climate conditions, and topographic conditions.

2 Methods and data

2.1 Methods

According to the main guidelines of the Total-Structure control theory, determining the reasonable planned per capita construction land areas (total amount) and the planned per capita construction land structure are the two core issues to be solved by employing the formulation of urban planning and construction land standards. In order to explore and clarify the basis of standard setting and the relationships between different revision factors and the Total-Structure control theory, this study divided the standard formulation and revision process into four main links, including basic standard determination, population size revision, climate revision, and topography revision. The technical process that reflects the logical relationship of each link and the revised targets and key indicators is presented in Figure 1.
(1) The basic standard determination and population size revision method
The basic standards are determined to establish a unified national planned per capita construction land area and single construction land structure through conditional setting and are based on generality and universality. The setting conditions of the basic standards mainly include planned urban population size, climate conditions, and topographic conditions. Specifically, first, the planned urban population size was set to be a large city, I, with a population size of 500,000 to 1 million; second, only the sunshine condition was selected to be considered as the climate condition, and the sunshine spacing coefficient was set to 1; third, the topographic condition was set as a contiguous area with a slope of 3° or less, wherein the area was circular or square in shape and had a diameter or side length of more than 20 km. In addition, the basic standards determined under the above-mentioned setting conditions must also comply with the current provisions of China’s current standards on the total area of planned per capita construction land and the structure of single construction land; thus, the total number of basic standards and structure values should not exceed the current standards. Based on this, the method of averaging the current standard range was adopted. The object of the revision of the population size in this study was the public management and public service land in the single construction land structure. Based on the urban population size rankings by the basic standard and the range of per capita public management and public service land area corresponding to different population sizes according to the current standard, the averaging method was used to determine the per capita areas of public management and service land corresponding to different population sizes.
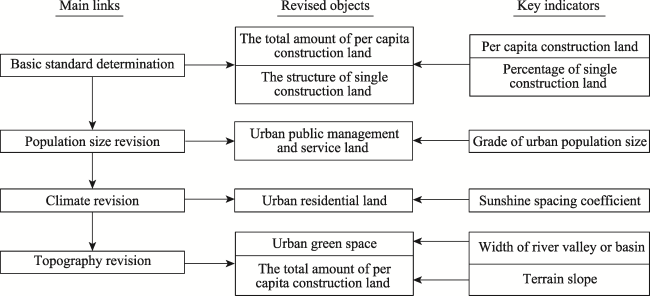
Figure 1 Technical process and key indicators of this study
(2) The climate revision method
In order to clarify the relationship between architecture and climate, China’s General Principles of Civil Architectural Design (GB 50352-2005, 2005) divides the country into seven first-class architectural climate zones and 20 second-class architectural climate zones and outlines different requirements for climate characteristics and architectural design of each architectural climate zone (Xie, 1994). Through a comprehensive analysis of the basic requirements of different architectural climate zones, it is clear that the architectural objects closely related to climate elements are mainly residential buildings, kindergartens, and nursing homes. Architectural requirements for these buildings can be roughly divided into two types. Specifically, the first type has no direct relationship with the increase or decrease of the construction land area, and the requirements can be met through the structural design of the buildings such as reducing the exposed area, strengthening the winter airtightness, increasing natural ventilation, and prevention against sand, storm, flood, humid climate, lightning, and salt-fog, etc. The second type would benefit from increasing the construction land area to meet the architectural climate requirements, such as increasing the sunshine spacing to meet the requirements of sunshine conditions and increasing the thickness of the external walls of the buildings to achieve the purposes of cold protection, heat preservation, and anti-freezing. Among the seven first-class architectural climate zones in China, the third (III) and the fourth (IV) first-class architectural zones located in the south of the Qinling-Huaihe Line and the fifth (V) first-class architectural climate zone dominated by the Yunnan-Guizhou Plateau belong to the first type; while the first (I) and the second (II) first-class architectural zones in the north of the Qinling-Huaihe Line, the sixth (VI) first-class architectural zone with the Qinghai-Tibet Plateau as the main body, and the seventh (VII) first-class architectural zone with the arid northwestern region as the main body belong to the second type. Considering that the need to increase the thickness of the external walls of a building for heat preservations in winter is small, and the spatial variation trend of the thickening is similar to the increasing sunshine spacing, the effect of temperature is ignored in this study. The research focus of this study on climate revision is the residential land areas of the single construction land (kindergartens, nursing homes, and other sites that need to consider sunshine conditions are ignored), and the area of residential land is adjusted according to the sunshine spacing coefficient based on relevant researches (Zhao, 2002; Tian and Song. 2005).
By setting the length of the building to L1, the width of the building to Lw, the height of the front building to the ground level to H, the height of the first floor of the rear building to the ground level to H0, and the building’s demarcation distance (the control line for land use) of the rear building to be half of the sunshine spacing (Figure 2), the difference of residential areas (Sβ‒1) between that with a sunshine spacing coefficient of β and that with a sunshine spacing coefficient of 1 can be regarded as the revised climate value of the residential land. Then, Sβ and S1 can be set to the residential area with sunshine spacing coefficient of β and sunshine spacing coefficient of 1, respectively. Finally, the quantitative calculations based on the settings outlined above are as follows:
${{S}_{\beta }}=\frac{1}{2}\left[ \left( H-{{H}_{0}} \right)\beta +{{L}_{w}} \right]{{L}_{l}}$
${{S}_{1}}=\frac{1}{2}\left[ \left( H-{{H}_{0}} \right)+{{L}_{w}} \right]{{L}_{l}}$
${{S}_{\beta -1}}=\frac{1}{2}~{{L}_{l}}\left( H-{{H}_{0}} \right)\left( \beta -1 \right)$
${{\text{S}}_{B\beta }}={{S}_{B1}}\frac{{{S}_{\beta }}}{{{S}_{1}}}$
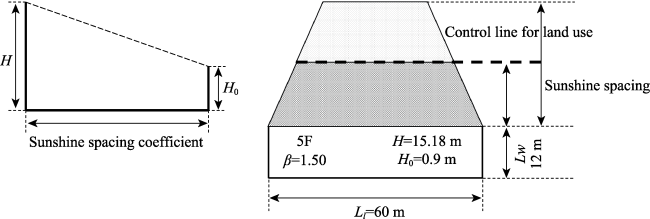
Figure 2 Illustration of the relationship between residential land and sunshine spacing coefficient
(3) The topography revision method
The revision of topographic conditions involves two aspects. First, the width of a valley/basin is regarded as a key indicator to revise the green area of park space in the urban single construction land structure distributed in mountainous, hilly areas or inter-montane basins; second, planned per capita construction land located on slopes can be revised by taking the terrain slope as the key indicator.
A typical characteristic of valley land can be described as a river located between two mountains, and on either side of the river, plains of different widths are present and can be used as urban construction land or agricultural land (Yu et al., 2000; Feng et al., 2007; Niu et al., 2014). The river and mountains in this case have evident ecological land characteristics (Chen et al., 2006) and can be included as ecological green space in the urban planning construction land standard, which means that the urban planning construction land standard in valley areas should be lower than that in other areas. In general, the smaller the width of valley land, the greater the influence of ecological green space mentioned above in the urban planning construction land standard; conversely, as the width of valley land increases, its influence becomes weaker, which indicates that the urban planning construction land standard should increase with the increase of the width of valley land. The inter-montane basins are similar to the valley lands mentioned above. The only difference is that the inter-montane basins are surrounded by mountains. Generally, more than one river exists in the inter-montane basins, so the inter-montane basins and valley lands can be classified into the same land type. The revision method is to check and revise the area of green space in urban single construction land structure based on the average width of valley lands or mountain basins and the service radiuses of different levels of green space according to the classification standard of urban green space.
Stepped transformation of sloping land is an important way to expand urban construction land in mountainous and hilly areas (Huang, 2006; Li and Xiao, 2013). Generally, sloping lands are divided into 5 grades according to the terrain slopes of less than 3°, 3° to 8°, 8° to 15°, 15° to 25°, and more than 25° (Xu et al., 2011; Dang et al., 2015). Specifically, areas with a slope of less than 3° are suitable for urban construction, as flat terrain has essentially no restrictions on the layout of urban roads and pipe networks. Urban construction can be carried out in areas with a slope of 3° to 8°, while the construction land needs to adopt a hybrid vertical design for combining a platform with flat land, and it is necessary to increase the amount of earthwork and protection works. What’s more, the terrain of areas with a slope of 3° to 8° imposes certain restrictions on the layout of urban roads and pipe networks, but on the other hand, it is easy to create a distinctive urban landscape. Areas with a slope of 8° to 15° are moderately suitable for urban construction. Under such terrain conditions, the ground connection form of the residential area should be platform type, the platforms should be connected by retaining walls or slope protection projects, the roads in the residential areas should be supplemented by stepped roads to solve the issue of vertical traffic, and bicycle lanes should be set up adjacent to the steps. In addition, this type of terrain is greatly restricted in terms of the layout of roads and pipe works, which means the amount of earthwork and protection works is large and the increase in construction cost is significant and the residents’ life is inconvenient. Areas with a slope of 15° or more are no longer suitable for large-scale urban construction. When the slope is greater than 15°, it is more difficult to centralize urban construction lands, especially industrial lands. The slope of 15° is a critical value for soil erosion, and the soil erosion in areas with a slope of 15° or more increases drastically. Areas with a slope of 15° to 25° can be arranged with an appropriate amount of residential land after the stepped transformation is completed. Areas with a slope of more than 25° cannot be used to centralize urban construction land, nor are they suitable for traffic organization or production process organization of industrial storage land. Under such terrain conditions, a small amount of residential land can be arranged, but the vertical traffic organization and pipe network layout have great limitations. Usually, the slope of the road is very steep, special trails are required, and roundabout roads must be used, which results in high construction costs, reduced safety, and inconvenience to residents.
The relationship between terrain slope and construction land standard is presented in Figure 3: The terrain slope is set to α. The line segment AB in the right triangle ABC is the vertical projection distance of the slope line segment AC along the slope direction, the length of which is set to L. The line segment BC is the height of the right triangle, with a value of h. The line segment AF is the building ladder avoidance distance (lp) and lp is the difference between the line segment AC and the line segment AB. A is the angle of the slope protection project, the line segment CE is the slope protection project, and the line segment EB (ΔF) is the vertical projection distance of CE. The line segment GE is the building ladder slope avoidance distance (lF), and the value of lF is ΔF. When the slope is α, the I value (line segment FG) under the flat ground condition can be adjusted to L under the sloping ground condition. If calculated by square, the mathematical formula between the sloping construction land standard and the terrain slope can be expressed as follows:
$L=l+{{l}_{P}}+{{l}_{F}}+\Delta F$
where ${{l}_{P}}=L\left( \frac{1}{\cos \alpha }-1 \right)$; ${{l}_{F}}=\Delta F=L\frac{\tan \alpha }{\tan \theta }$
$\omega ={{S}_{L}}/{{S}_{l}}=1/\left( 2-\frac{1}{\cos \alpha }-\frac{2\tan \alpha }{\tan \theta } \right)$
where ${{S}_{l}}={{l}^{2}}$; ${{S}_{L}}=l\cdot L$
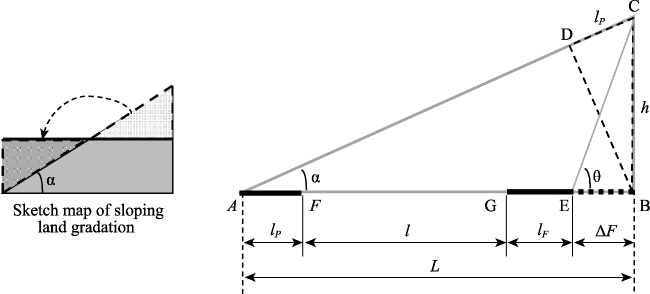
Figure 3 Relationship between terrain gradient and construction land standards
Formula (5) represents the relationship between the vertical projection adjustment length, L, of the slope along the slope direction and the flat ground length, l. Equation (6) represents the relationship between the sloping construction land standard, SL, and the flat construction land standard, Sl, that is, the ratio (ω) of SL to Sl is only related to the terrain slope and the angle of the slope protection project, and it is independent of the geometry (square, rectangle, etc.) used for area measurement.

2.2 Parameters and data sources

The parameters and data involved in the study are primarily sourced from the national or industrial standards that were formulated and continue to be implemented by the Ministry of Housing and Urban-Rural Construction of the People’s Republic of China. The data of planned per capita construction land area, urban construction land types, single construction land structure, and planned urban population size involved in the determination of basic standard and urban population size revision are derived from urban classification and planned construction land standards (GBJ 137-90, 1990; GB 50137-2011, 2011) and urban public facilities planning norms (GB 50442-2008; 2008). The key parameters involved in climate revision, such as sunshine spacing coefficient and building retreat distance, are derived from architectural climate zoning standards (GB50178-93, 1993), general principles of civil architectural design (GB 50352-2005, 2005), and urban residential area planning and design norms (GB 50180-93, 2016). The key parameters of park green space type and service radius, angle of slope protection project, building slope avoidance distance, and terrain slope classification are derived from urban green space classification standards (CJJ/T 85-2002, 2002; CJJ/T 85-2017, 2017), architectural slope engineering technical specifications, urban road engineering design specifications, and related literature (GB 50330-2013, 2013; CJJ-2012, 2016).

3 Results

3.1 Basic standards and population size revision

As a compulsory provision, China’s current standards stipulate that the per capita urban construction land area should be determined in the range of 85-105 m2/person. It is believed that the newly built cities can be developed according to a reasonable planning layout, thus it is necessary to ensure appropriate land use standards and leave space for the development of cities. The planned per capita construction land area of newly built cities should be determined within 95-105 m2/person, which is a relatively reasonable land use standard for Chinese cities. If the development land of the city cannot meet the above requirements, it can be determined in the range of 85-95 m2/person. According to this, the planned per capita construction land area determined by the method of averaging the current standard interval range is 95 m2/person, which can be regarded as the total indicator of the basic standard.
The per capita single construction land under the total amount control mainly includes eight types of land: residential land, public management and public service land, industrial land, transportation facilities land, green space, commercial and service land, logistics storage land, and utility land. China’s current standards consider that residential, public management and public services, industrial, transportation facilities, and green space are the key components of the urban construction land structure, and the value range and minimum control area are defined for these five types of land. Based on the current standards, the proportion of each type of per capita single construction land used by the mean method is presented in Table 1. Specifically, 32.5% of residential land, 7.42% of land for public management and public services, 22.5% of industrial land, 17.5% of land for transportation facilities, 12.5% of green space and 7.58% of other land. In addition, the corresponding per capita area of the total indicator of 95 m2/person is 30.88 m2/person, 7.05 m2/person, 21.38 m2/person, 16.63 m2/person, 11.88 m2/person and 7.2 m2/person. It should be stated that the urban land classification system that corresponds to the current standards has adjusted the commercial financial land from public management and public service land-use type to commercial service industry land-use type, so the ratio of public management and public service land use presented in Table 1 is the result of deducting commercial financial land according to the urban public facilities planning norms.
Table 1 The structure of per capita single construction land of basic standard for urban planning
Land-use types Basic standard Current standard
Percentage
(%)
Per capita area
(m2/person)
Ratio interval (%) Controlled value
(m2/person)
Residential land 32.50 30.88 25-40 23-38
Public management and service land 7.42 7.05 5-8 ≥ 5.5
Industrial land 22.50 21.38 15-30 ≥ 18
Transportation facilities land 17.50 16.63 10-25 ≥ 12
Green space 12.50 11.88 10-15 ≥ 10
Other types 7.58 7.20 - -
Total 100.00 95.00 - -

Note: Other land-use types include commercial service facility land, logistics warehousing land, public facilities land, etc.

From the current urban land classification, urban construction land standards, and urban public facilities planning norms in China, the types of land closely related to urban population size are mainly public management and public service lands, including administrative office, culture, education and scientific research, sports, medical and health, social welfare, cultural artifacts, foreign affairs, and religion, among others. According to the current urban construction standards in China, cities are divided into five levels (according to the urban population): small city (less than 200,000), medium city (200,000 to 500,000), big city I (500,000 to 1 million), big city II (1 million to 2 million), and big city III (2 million); and the value interval is defined for the per capita public management and public service land area of each city. Based on the basic per capita urban construction land of 95 m2/person corresponding to the big city I level, the revised standard of urban population size measured by the mean method is presented in Table 2. Notably, the per capita public management and public service land area at the small city level is 6.55 m2/person; and the corresponding per capita construction land area is 94.5 m2/person.
Table 2 Revision standard of population size for urban planning construction land
Indicators Unit of measurement Small city Medium city Big city
Big city Ⅱ Big city Ⅲ
Value range specified by current standards for per capita public management and service land area m2/person 5.5-7.6 5.8-8.1 5.9-8.2 6.3-8.8 6.8-9.2
Per capita public management and service land area m2/person 6.55 6.95 7.05 7.55 8.00
Per capita construction land m2/person 94.50 94.90 95.00 95.50 95.95

3.2 The climatic condition revision standard

In order to quantitatively measure the spatial differentiation of sunshine conditions for construction land standards, it is necessary to clarify the standard of sunshine conditions and the characteristics of residential buildings on residential land. The general rules for the design of civil buildings in China have been clearly defined. Specifically, during the Great Cold Day, the sunshine duration of big cities in architectural climate zones I, II, III, and VII should be no less than 2 hours; the sunshine duration of small and medium cities in architectural climate zones I, II, III, and VII and the big cities in architectural climate zone IV should be no less than 3 hours. Furthermore, during the Winter Solstice Day, the sunshine duration of small and medium cities in architectural climate zone IV and the cities at all levels in architectural climate zones V and VI should be no less than 1 hour. In order to facilitate the calculation, the sunshine duration of 2 hours on the Great Cold Day is used as a unified criterion in this study, and the sunshine spacing coefficient directly applies the value of the spacing coefficient of different sunshine standards in major cities across the country, which are derived from the general rules of civil architectural design. There is a difference between the length and the height of residential buildings, which leads to inconsistencies in the revised climate values measured by formula (1). To solve this problem, the residential building conditions were set as presented in Figure 2. Specifically, the residential building was designed as a strip layout with a length of 60 m, a width of 12 m, a height of 15.18 m, and 5 floors. There are two supplementary explanations for these conditions. First, when the number of floors in a building is 5, the building retreat distance in Haikou with the lowest sunshine spacing coefficient (0.83) meets China’s requirement that the spacing between buildings should not be less than 6 m among the 43 cities mentioned in the general rules of civil architectural design; second, the number of floors (building height) is closely related to the building area and plot ratio. Figure 4 illustrates in detail that the building area of per unit residential land area varies with the number of floors when the sunshine spacing coefficient is 1.5, and the change reveals a logarithmic function growth trend, which indicates that it is reasonable for the climate revision to set the number of residential floors to 5.
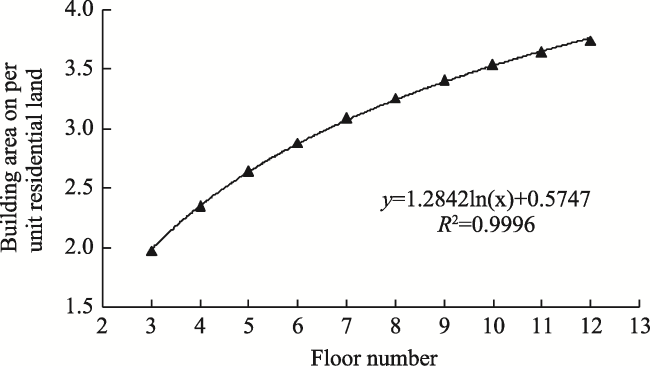
Figure 4 The change of construction area of per unit residential land with the number of floors (β = 1.5)
Based on the conditions outlined above, according to the per capita construction land area of 95 m2/person and the per capita residential land area of 30.88 m2/person, the adjustment of per capita residential land area to basic standards, the climate revision of per capita residential land area, and the total amount per capita construction land area in major cities in China are measured through the climate revision quantitative formulas (1), (2), (3), and (4), and are presented in Table 3. It can be observed that the climate revision of the planned per capita residential land area and the corresponding per capita construction land area in Chinese cities vary greatly between the north and the south. Specifically, the sunshine spacing coefficient is 0.83 in Haikou, the southernmost part of China, the revised climate value of per capita residential land area is 28.92 m2/person, and the corresponding revised climate value of per capita construction land area is 93.04 m2/person, which is 1.96 m2/person less than the basic standard value. Taking the neighboring cities as the base points, the spatial distribution of the revised climate value of the total amount of national urban planning per capita construction land area calculated by the segmentation interpolation method for latitudinal variation of the sunshine spacing coefficient is presented in Figure 5. It can be observed that under the condition that the sunshine duration of the Great Cold Day is not less than 2 hours, the basic standard value corresponding to the sunshine spacing coefficient of 1 is roughly distributed in the Xiamen-Guilin-Kunming line, and the further north the city is, the greater the revised climate value will be. The distribution of revised climate values of per capita construction land area by latitude is 93 m2/person at 20°N, 97 m2/person at 30°N, 103 m2/person at 40°N, and 115 m2/person at 50°N.
Figure 5 Spatial differentiation of per capita construction land area by climate revision in China’s urban planning system

Note: This map is based on the standard map production of the GS (2016) No. 1594 from the Standard Mapping Service Website of the National Surveying and Mapping Geographic Information Bureau.

Table 3 The climate revision of per capita residential land and per capita construction land in major cities of China
City Longitude Latitude Sunshine spacing coefficient Sunshine spacing Adjustment of per capita residential land area Per capita residential land area Total amount of per capita construction land area
(East
longitude, E)
(North
latitude, N)
(m) (m2) (m2) (m2)
Mohe 122°32′20″ 52°58′21″ 3.21 45.84 25.46 56.34 120.46
Qiqihar 123°56′15″ 47°20′34″ 2.32 33.13 15.21 46.09 110.21
Harbin 126°40′10″ 45°45′35″ 2.15 30.70 13.25 44.13 108.25
Changchun 125°19′47″ 43°51′36″ 1.97 28.13 11.17 42.05 106.17
Urumqi 87°37′2″ 43°49′30″ 1.96 27.99 11.06 41.94 106.06
Duolun 116°29′8″ 42°12′13″ 1.83 26.13 9.56 40.44 104.56
Shenyang 123°25′52″ 41°48′22″ 1.80 25.70 9.22 40.10 104.22
Hohhot 111°44′49″ 40°50′37″ 1.73 24.70 8.41 39.29 103.41
Datong 113°18′3″ 40°4′41″ 1.67 23.85 7.72 38.60 102.72
Beijing 116°23′32″ 39°54′30″ 1.67 23.85 7.72 38.60 102.72
Kashi 75°59′24″ 39°28′13″ 1.61 22.99 7.03 37.91 102.03
Tianjin 117°11′60″ 39°5′51″ 1.61 22.99 7.03 37.91 102.03
Baoding 115°27′40″ 38°52′32″ 1.60 22.85 6.91 37.79 101.91
Yinchuan 106°13′49″ 38°29′16″ 1.58 22.56 6.68 37.56 101.68
Shijiazhuang 114°30′56″ 38°2′35″ 1.55 22.13 6.34 37.22 101.34
Taiyuan 112°32′54″ 37°52′16″ 1.54 21.99 6.22 37.10 101.22
Jinan 117°7′12″ 36°39′4″ 1.47 20.99 5.41 36.29 100.41
Xining 101°46′40″ 36°37′5″ 1.47 20.99 5.41 36.29 100.41
Qingdao 120°22′56″ 36°4′5″ 1.44 20.56 5.07 35.95 100.07
Lanzhou 103°50′3″ 36°3′40″ 1.44 20.56 5.07 35.95 100.07
Zhengzhou 113°37′35″ 34°44′51″ 1.36 19.42 4.15 35.03 99.15
Xuzhou 117°16′59″ 34°20′21″ 1.35 19.28 4.03 34.91 99.03
Xian 108°56′56″ 34°15′59″ 1.35 19.28 4.03 34.91 99.03
Bengbu 117°21′23″ 32°55′14″ 1.28 18.28 3.23 34.11 98.23
Nanjing 118°47′50″ 32°3′36″ 1.24 17.71 2.76 33.64 97.76
Hefei 117°14′10″ 31°49′24″ 1.23 17.56 2.65 33.53 97.65
Shanghai 121°28′23″ 31°13′54″ 1.21 17.28 2.42 33.30 97.42
Chengdu 104°4′18″ 30°39′27″ 1.18 16.85 2.07 32.95 97.07
Wuhan 114°18′19″ 30°35′40″ 1.18 16.85 2.07 32.95 97.07
Hangzhou 120°10′41″ 30°18′16″ 1.17 16.71 1.96 32.84 96.96
Lhasa 91°10′21″ 29°39′11″ 1.15 16.42 1.73 32.61 96.73
Chongqing 106°33′3″ 29°33′42″ 1.14 16.28 1.61 32.49 96.61
Nanchang 115°50′47″ 28°41′11″ 1.11 15.85 1.27 32.15 96.27
Changsha 112°56′18″ 28°13′43″ 1.09 15.57 1.04 31.92 96.04
Guiyang 106°38′56″ 26°37′4″ 1.03 14.71 0.35 31.23 95.35
Fuzhou 119°17′48″ 26°4′28″ 1.01 14.42 0.12 31.00 95.12
Guilin 110°17′24″ 25°16′27″ 0.99 14.14 -0.12 30.76 94.88
Kunming 102°42′32″ 25°1′53″ 0.98 13.99 -0.23 30.65 94.77
Xiamen 118°5′23″ 24°28′47″ 0.96 13.71 -0.46 30.42 94.54
Guangzhou 113°15′51″ 23°7′45″ 0.92 13.14 -0.92 29.96 94.08
Nanning 108°22′2″ 22°49′1″ 0.91 12.99 -1.04 29.84 93.96
Zhanjiang 110°21′35″ 21°16′17″ 0.86 12.28 -1.61 29.27 93.39
Haikou 110°11′52″ 20°2′38″ 0.83 11.85 -1.96 28.92 93.04

3.3 The topography revision standard

Based on the basic standard and revised climate standard, the topography revision standard is used to further verify the per capita construction land or per capita single construction land index for urban planning in mountainous and hilly areas. According to the above-mentioned revision method, the average width of river valleys or inter-montane basins and the service radius of park green spaces at different levels of the city are key indicators for revising the standards for urban construction land use in river valleys or inter-montane basins. According to the urban green space classification standard, the urban green space is divided into five categories: park green space, protective green space, square land, auxiliary green space, and regional green space. The regional green space is excluded from the urban construction land, and the protective green space, square land, and auxiliary green space belong to the urban construction appendage. Park green space is a mandatory allocation for urban green space construction and includes four types of green spaces: comprehensive parks, community parks, special parks, and gardens. According to the existing literature, the average service radius of community parks is relatively clear, generally 0.5 km to 1 km, while no authoritative data was found on the service radius of comprehensive parks, which was set to 2 km in some cities, including Guangzhou (Jiang et al., 2010). Therefore, the park green space configuration in the urban planning construction land of the river valley or the inter-montane basin can be ranked by the average width of the river valley or the inter-montane basin of 2 km and 4 km. Specifically, when the average width is less than 2 km, community parks and comprehensive parks cannot be allocated; when the average width is between 2 km and 4 km, comprehensive parks cannot be allocated; when the average width is more than 4 km, park green spaces must be allocated according to normal standards. The allocation of urban planning park space in a river valley or inter-montane basin does not mean the reduction of urban green space in wider areas. Notably, the green park space that was reduced has been replaced by regional green space (Table 4).
Table 4 The average width of the river valley or inter-montane basin and the allocation of urban planning park green space
Average width of a river valley or
inter-montane
basin (km)
Types of reduced park green space
≤2 Comprehensive park, community park
2-4 Comprehensive park
≥4 -
It can be observed from the quantitative calculation formula (6) for the relationship between the terrain slope and the construction land standard that the slope angle (θ) of the slope protection project is a key parameter involved in the revision of the construction land standard on sloping land. According to the technical specifications of the building slope engineering, when the ladder height (h) is less than 30 m and the upper part of the slope is experiencing a static load, the θ value is closely related to the bedrock of the slope, with the value ranging from 45° to 84°. Generally, the value of type I rock mass is 75°, that of type II rock mass is 72°, that of type III rock mass is 62°, and that of theta (θ) in this study is 72°. Based on the standard of 95 m2/person of per capita construction land, the revised standard of per capita construction land of sloping land calculated by a grading interval of terrain slope and its mean value is presented in Table 5 and Figure 6. It can be observed that with the increase of the terrain slope, the corresponding revision value of the per capita construction land shows a sharp increase. Specifically, the revised value of per capita construction land when the terrain slope is 3° is 98.49 m2/person, which is 3.49 m2/person more than the basic standard of 95 m2/person, an increase of 3.68%. For convenience, in practice, it is recommended that the terrain slope of less than 3° uses the basic standard value, 3° to 8° uses the revised value of 5.5°, 8° to 15° using the revised value of 11.5°, and 15° to 25° using the revised value of 20°.
Figure 6 Changes of per capita construction land revision values with topographic slope

4 Discussion

This study on the urban planning construction land standard and its revision is a scientific mechanism analysis and targeted quantitative improvement of the current related standards in China. The basic standard determined in the study outlines the national uniformity of the standard in terms of total quantity and structure. The revision of population size, climate conditions, and topographic conditions quantitatively analyze the regional differences caused by changes in the basic standard for urban planning construction land types (meaning the structure), which can not only scientifically explain the reasons for the large gap between the standard values of per capita construction land in China’s current standard, but also make up for the shortcomings of the current standard for climate revision that is relatively rough and fails to consider topographic features. The value of China’s current standard for climate revision is uniformly set at 5 m2/person, and the standard high-limit values for the per capita construction land of architectural climatic zones I, II, VI, and VII are 5 m2/person higher than that in architectural climate zones III, IV, and V, respectively. The climate revised value of this study is calculated by utilizing a quantitative formula. The per capita construction land area of 50°N is 22 m2/person higher than that of 20°N, which differs greatly from the current standard. This study on the decrease of the amount of per capita construction land caused by the reduction of urban planning park green space in river valleys or inter-montane basins can reasonably explain why the values of the current per capita construction land and planned per capita construction land standard of small and medium cities distributed in river valleys or inter-montane basins are relatively low, which denotes that the ideas and methods for standard setting in accordance with the Total-Structure control theory are correct.
Table 5 Revision standards of per capita construction land with different terrain slope grades
Terrain ω SL (m2/person) Increase rate (%)
1.00 95.00 0.00
1.04 98.49 3.68
5.5° 1.07 101.84 7.20
1.11 105.68 11.25
11.5° 1.18 112.13 18.03
15° 1.26 120.16 26.49
17.5° 1.34 127.25 33.95
20° 1.43 135.85 43.00
22.5° 1.54 146.50 54.21
25° 1.68 160.04 68.47
The revised climate conditions standard and topography revision standard do not conflict in practice. The revised climate standard is for per capita residential land in urban construction land types and does not involve other per capita construction land types. The revised climate value of per capita urban construction land area is calculated according to the revised climate value of per capita residential land area, and the other types of single per capita construction land area show no change. The factors considered in the terrain revision are the average width of river valleys or inter-montane basins and the terrain slope. The average width of river valleys or inter-montane basins is used for the urban green space, which has no direct relationship with climate-revised residential land or other land-use types. The revised terrain slope applies to all levels of sloping urban construction land. However, the area increment of the revised value is caused by the avoidance distance that must be retained by the stepped terrain, and the area of construction land used for urban planning and construction (that is, the area of construction land after climate revision) has not changed. As for the residential buildings on residential land, it is reasonable to use the space on the edge of the road, the green space, and the avoidance distance to increase the plot ratio. Reducing the park green space and increasing the avoidance distance of the stepped terrain may have a slight impact on the plot ratio, but this is an issue for the detailed layout of urban planning, which has no direct relationship with the standard itself.

5 Conclusions

Based on the academic concepts of total planned per capita construction land area and the structure control of per capita single construction land, the research presented in this paper developed a step-by-step process framework for the establishment of basic standards and revision of climate conditions and topographic conditions, and proposed a quantitative method for measuring basic standards and revised standards for urban population size, climate conditions, and topographic conditions.
The per capita construction land standard of 95 m2/person can be used as the total indicator of China’s urban planning basic standard, and the corresponding per capita single construction land is composed of 32.5% of residential land, 7.42% of public management and public service land, 22.5% of industrial land, 17.5% of transportation facilities, 12.5% of green space, and 7.58% of other land use types. The results of the revision of the urban population size show that the difference in population size has little effect on the total amount of per capita construction land.
The climate revision results of per capita residential land and the total amount of per capita construction land in major cities indicate that the revised values of climate conditions vary greatly between north and south China. The revised climate values of the per capita area of construction land vary by latitude as follows: the value at 20°N is 93 m2/person, the value at 30°N is 97 m2/person, the value at 40°N is 103 m2/person, and the value at 50°N is 115 m2/person. The basic standard value of 95 m2/person is generally distributed in the Xiamen-Guilin-Kunming line.
Cities located in mountainous areas, hilly valleys, or inter-montane basins can reduce the allocation of community parks and comprehensive parks when the average width of the valley or inter-montane basin is less than 2 km, and the allocation of comprehensive parks can be reduced when the average width is between 2 km and 4 km. The revised results of per capita sloping construction land indicate that the terrain slope has a great effect on the revised value of per capita construction land. Specifically, the revised value at 3° is 3.68% higher than the basic standard value, and the increase rates at 8°, 15°, and 25° are 11.25%, 26.49%, and 68.47%, respectively.
1
Brown L R, 1995. Who Will Feed China? New York: W. W. Norton & Company.

2
Cai Y L, Fu Z Q, Dai E F, 2002. Regional minimum per capita cultivated land area and regulation of cultivated land resources. Acta Geographica Sinca, 57(2):127-134. (in Chinese)

3
Central Committee of the Communist Party of China and the State Council(CCCPC and SC), 2015. Overall Plan of Ecological Civilization System Reform. Beijing: Xinhua News Agency. (in Chinese)

4
Central Committee of the Communist Party of China and the State Council(CCCPC and SC), 2016. Provincial Space Planning Pilot Program. Beijing: Xinhua News Agency. (in Chinese)

5
Chen B M, 1999. The existing states: Future change trends in land-use and food production capacities in China. AMBIO, 28(8):682-686.

6
Chen Y F, Du P F, Zheng Y J et al., 2006. Ecological suitability evaluation of construction land in Nanning based on GIS. Journal of Tsinghua University (Natural Science Edition), 46(6):801-804. (in Chinese)

7
Dai J L, Gao X L, Du S S, 2010. Spatial expansion and land use control in the process of urbanization. Geographical Research, 29(10):1823-1832. (in Chinese)

8
Dan H M, Li X B, Lv C H, 2004. Construction land expansion and its occupation of cultivated land in large and medium cities in China in 1990s. Science China D: Terrae, 34(12):1157-1165. (in Chinese)

9
Dang L J, Xu Y, Tang Q, 2015. The pattern of available construction land along the Xijiang River in Guangxi, China. Land Use Policy, 42:102-112.

DOI

10
Feng Z M, Tang Y, Yang Y Z et al., 2007. Topographic relief and its correlation with population distribution in China. Acta Geographica Sinca, 62(10):1073-1082. (in Chinese)

11
Han D, Feng C C, Gu W Y, 2010. Factors of economically and intensively use of rural residential land and its regional difference. Chinese Journal of Agriculture Resources and Regional Planning, 31(5):29-35. (in Chinese)

12
Huang G Y, 2006. Principles of Mountain City Science. Beijing: China Construction Industry Press, 1-5. (in Chinese)

13
Jiang D W, 1996. The standard of urban construction land should be tailored. City Planning, 20(5):58. (in Chinese)

14
Jiang H Y, Zhou C H, Xiao R B, 2010. Spatial differentiation and social equity of public parks in Guangzhou. City Planning Review, 34(4):43-48. (in Chinese)

15
Li H P, Xiao J, 2013. Multidimensional analysis of the relationship between mountain city and mountain city. City Planning, 20(8):40-46. (in Chinese)

16
Li M, Jiang H, 2008. Theories and policies on intensive use of land for construction. China Land Science, 22(2):55-61. (in Chinese)

17
Lin J, Zhang P, Liu S Y, 2009. Discussion on technical system and perspectives of evaluation on construction land saving and intensive use. China Land Science, 23(4):4-10. (in Chinese)

18
Liu Z Q, Song X M, Wang X M et al., 2005. Problems and countermeasures of replacement of construction land index. China Land, ( 4):25-26. (in Chinese)

19
Lu D D, Fan J, 2009. 2050: The Regional Development of China. Beijing: Science Press, 2-7. (in Chinese)

20
Mao Y L, 2009. Climate responsive mountain towns and architectural design. Journal of Mountain Science, 27(5):605-611. (in Chinese)

21
Ministry of Housing and Urban-Rural Development of the People’s Republic of China. Urban Land Classification and Planning and Construction Land Standards (GB 50137-2011).(in Chinese)

22
Ministry of Housing and Urban-Rural Development of the People’s Republic of China. Urban Land Classification and Planning and Construction Land Standards (GBJ 137-90).(in Chinese)

23
Ministry of Housing and Urban-Rural Development of the People’s Republic of China. Code for design of civil buildings (GB 50352-2005).(in Chinese)

24
Ministry of Housing and Urban-Rural Development of the People’s Republic of China. Urban Public Facilities Planning Code (GB 50442-2008).(in Chinese)

25
Ministry of Housing and Urban-Rural Development of the People’s Republic of China. Standard of climatic regionalization for architecture (GB 50178-93).(in Chinese)

26
Ministry of Housing and Urban-Rural Development of the People’s Republic of China. Code for Planning and Design of Urban Residential District(GB 50180-93, Revised Edition of 2016). (in Chinese)

27
Ministry of Housing and Urban-Rural Development of the People’s Republic of China. Standard for Classification of Urban Green Space (CJJ/T 85-2002).(in Chinese)

28
Ministry of Housing and Urban-Rural Development of the People’s Republic of China. Standard for Classification of Urban Green Space (CJJ/T 85-2017).(in Chinese)

29
Ministry of Housing and Urban-Rural Development of the People’s Republic of China. Technical Code for Building Slope Engineering (GB 50330-2013).(in Chinese)

30
Ministry of Housing and Urban-Rural Development of the People’s Republic of China. Code for Design of Urban Road Engineering(CJJ37-2012, Revised Edition of 2016). (in Chinese)

31
Ministry of Natural Resources of the People’s Republic of China. Current Land Use Classification (GB/T 21010-2017).(in Chinese)

32
Niu S W, Li J M, Li S H et al., 2014. Suitability evaluation of construction land based on terrain complexity: A case study of Tianshui, Gansu. Resource Science, 36(10):2092-2102. (in Chinese)

33
Qiao L Y, Zhou W, Cao Y G et al., 2010. Study on appraisal indicator system of urban land intensive use. Ecological Economy, ( 6):31-34. (in Chinese)

34
Qu F T, Chen J L, Chen H G, 2007. Economic Development and Land Conversion in China. Beijing: Higher Education Press, 1-23. (in Chinese)

35
Sun Q, Cai Y L, 2008. Historical experience of farmland protection and land management in Japan and its enlightenment to China. Journal of Peking University (Natural Science Edition), 44(2):249-256. (in Chinese)

36
Tian F, Song X D, 2005. Comparison of residential sunshine regulations in China and Japan. Journal of Urban Planning, ( 1):75-78. (in Chinese)

37
Tu Z H, Wang X P, Cheng C P, 2013. The discussion about the optimization of urban and rural construction land use standards: Based on the views of planning and management. Urban Development Studies, 20(9):58-65. (in Chinese)

38
Wang J, Zhao M, 2011. Influencing factors and multivariate control of planning and construction land standards. Modern Urban Studies, ( 9):30-38. (in Chinese)

39
Wu Y L, Qu F T, 2007. Mechanism of intensive urban land use in China: Theoretical and practical study. Resources Science, 29(6):106-113. (in Chinese)

40
Xie S M, 1994. Introduction to the Standard GB 0178-93 for Building Climatic Zoning. Architectural Science, ( 4):57-61. (in Chinese)

41
Xu Y, Tang Q, Fan J et al., 2011. Assessing construction land potential and its spatial pattern in China. Landscape and Urban Planning, 103:207-216.

DOI

42
Yu H, Zeng H, Jiang Z Y, 2001. Distribution characteristics of landscape components on topographic gradients in rapid urbanization area. Scientia Geographica Sinica, 21(1):64-69. (in Chinese)

43
Zhao W K, 2002. Sunlight ordinance. City Planning, 26(12):90-91. (in Chinese)

44
Zhou K H, Tan R H, Liu Y F et al., 2012. Land use potential assessment of regional land use based on per capita construction land standard. Journal of Agricultural Engineering, 28(19):222-231. (in Chinese)

Outlines

/