Research Articles

The impact of energy-intensive industries on air quality in China’s industrial agglomerations

  • ZHANG Xiaoping 1 ,
  • LIN Meihan 2, 1 ,
  • WANG Zhenbo 2, * ,
  • JIN Fengjun 2, 1
Expand
  • 1. College of Resources and Environment, University of Chinese Academy of Sciences, Beijing 100049, China
  • 2. Key Laboratory of Regional Sustainable Development Modeling, Institute of Geographic Sciences and Natural Resources Research, CAS, Beijing 100101, China
Wang Zhenbo (1980–), PhD and Associate Professor, specialized in urbanization and regional development. E-mail:

Zhang Xiaoping (1972–), PhD and Associate Professor, specialized in economic geography and regional sustainable development. E-mail:

Received date: 2020-09-02

  Accepted date: 2020-12-07

  Online published: 2021-06-25

Supported by

National Natural Science Foundation of China, No(41771133)

National Natural Science Foundation of China, No(41771181)

The Strategic Priority Research Program of the Chinese Academy of Sciences, No(XDA19040403)

Copyright

Copyright reserved © 2021. Office of Journal of Geographical Sciences All articles published represent the opinions of the authors, and do not reflect the official policy of the Chinese Medical Association or the Editorial Board, unless this is clearly specified.

Abstract

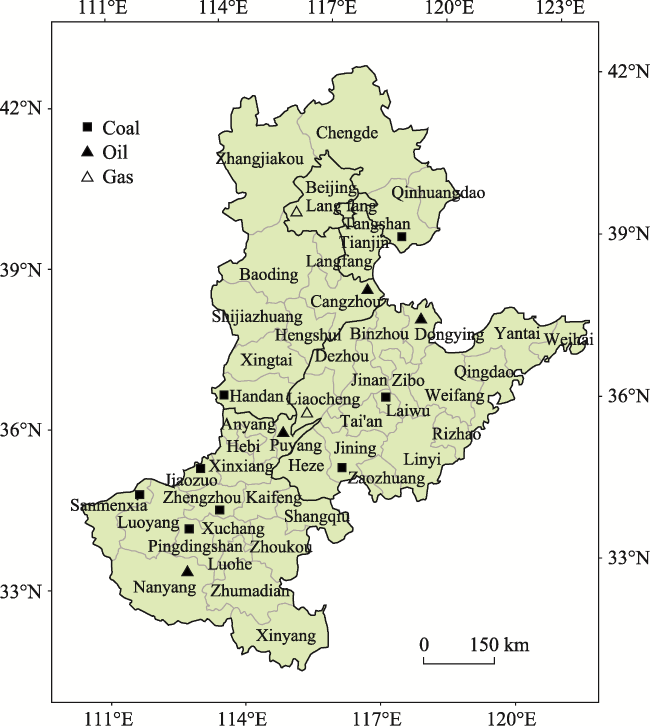
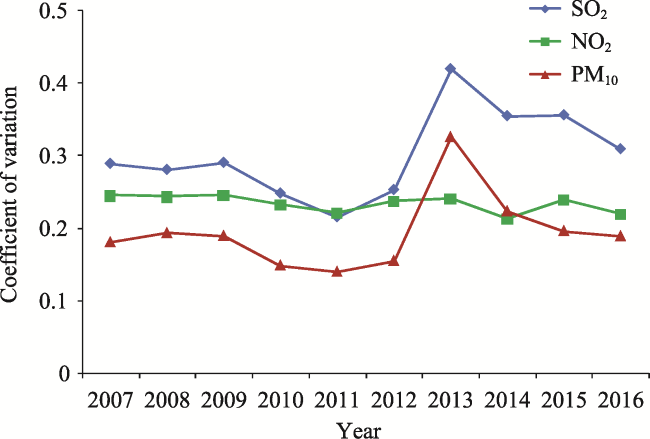
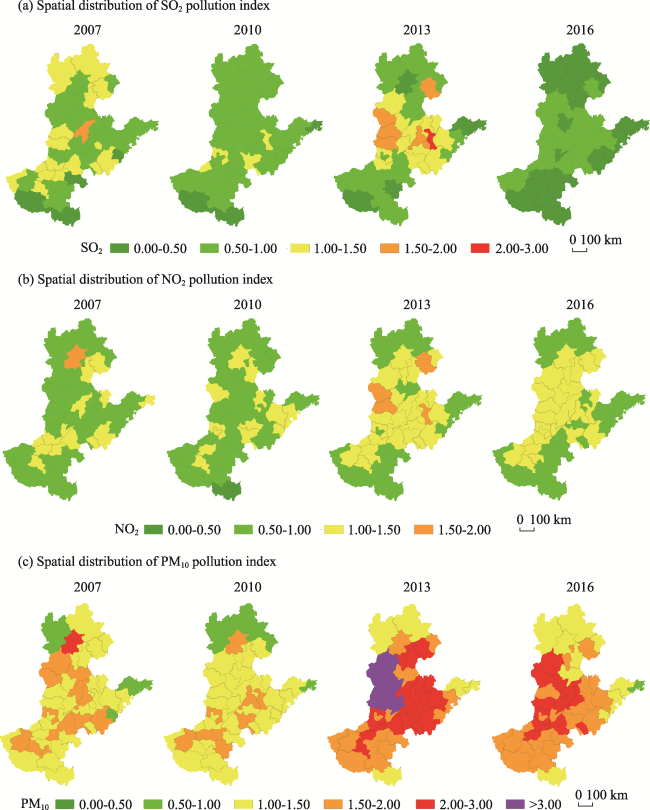
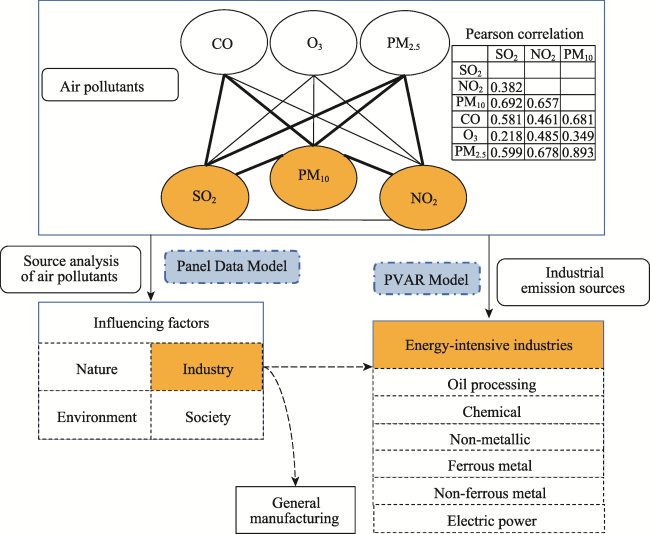
Understanding the driving forces of regional air pollution and its mechanism has gained much attention in academic research, which can provide scientific policy-making basis for economy-environment sustainability in China. Being an important energy and industrial base, the North China Plain region has been experiencing severe air pollution. Therefore, understanding the relationship between industrialization and air quality in this region is of great importance for air quality improvement. In this study, the average annual concentrations of SO2, NO2 and PM10 in 47 sample cities at and above the prefecture level in the North China Plain region from 2007 to 2016 were used to illustrate the spatiotemporal characteristics of air pollution within this region. Furthermore, panel data model, panel vector autoregression model, and impulse response function were used to explore the correlation and driving mechanism between energy-intensive industries and regional air quality. The results show that:first, overall air quality improved in the study area between 2007 and 2016, with a significant greater fall in concentration of SO2 than that of NO2 and PM10; second, provincial border areas suffered from severe air pollution and showed an apparent spatial agglomeration trend of pollution; and third, the test results from different models all proved that energy-intensive industries such as the chemical, non-metallic mineral production, electric and thermal power production and supply industries, had a significant positive correlation with concentrations of air pollutants, and indicated an obvious short-term impulse response effect. It concludes that upgradation of industrial structure, especially that of energy-intensive industries, plays a very important role in the improvement of regional air quality, which is recommended to be put in top priority for authorities. Therefore, policies as increasing investments in technological innovation in energy-intensive industries, deepening cooperation in environmental governance between different provinces and cities, and strengthening supervision and entry restrictions are suggested.

Cite this article

ZHANG Xiaoping , LIN Meihan , WANG Zhenbo , JIN Fengjun . The impact of energy-intensive industries on air quality in China’s industrial agglomerations[J]. Journal of Geographical Sciences, 2021 , 31(4) : 584 -602 . DOI: 10.1007/s11442-021-1860-x

1 Introduction

Industrialization is a transformation process of national economy away from an agricultural- or resource-based economy, toward an economy based on mass manufacturing. Numerous strategies for industrialization in different countries have been pursued over time, with varying levels of success. China has been in the industrialization process for nearly 40 years and is currently entering a crucial period of economic transition. Since it began implementing the policy of reform and opening-up in 1978, China’s economy has developed rapidly, and the value added by manufacturing industries as a percentage of GDP has increased from 19.7% in 1978 to 40.5% in 2017, a period when there was a significant development of heavy industries. Rapid industrialization has been an effective pathway for developing countries to promote economic and social development and to achieve modernization. However, it also gives rise to numerous environmental issues with the large amount of natural resources consumed during this process (Costantini and Monni, 2007), even worse, a major threat for human health (Matus et al., 2012; Lv et al., 2016). This is especially true for regions with industrialization dominated by energy-intensive industries, which has led to severe environmental pollution.
The North China Plain region is one of China’s major bases producing energy and basic raw materials, and its industrial structure is dominated by the heavy-chemical industries. In recent years, this region has become one of the most severely affected areas by air pollution in China. It is often blanketed by intense smog for prolonged periods, which seriously impacts people’s working and everyday activities as well as the living environment. Therefore, what is the relationship between energy-intensive industries and air quality? And how do the scale, structure, type, and stage of a country’s development contribute to air quality? What is the mechanism by which industrialization process affects air pollution? These are important aspects with great theoretical and practical significance for research. An empirical study of these questions can provide scientific policy-making basis for environmental governance and regulation, and the main part of North China Plain is an ideal study area in searching for answers to these questions.
Many studies have tried to quantify regional differentiation of air quality and its driving forces from various perspectives, which can be summarized into two broad categories: natural factors and socio-economic factors. The main natural factors having been tested are meteorological factors, such as temperature, precipitation, wind velocity, humidity and sunshine, as well as geographical factors, such as topography and slope (Tai et al., 2010; Gong and Zhang, 2017; Zhan et al., 2018). The main socio-economic factors having been concerned include economic development, industrialization, urbanization and population density etc. (Ahmet, 2013; Lin and Wang, 2016; Xu et al., 2016; Wang et al., 2017; Zhang and Lin, 2020). Most studies proved a positive relationship between economic growth, urban expansion, population density and air pollution. In addition, other factors as fuel types of energy and environmental regulations were reported having varying effects on air quality (Hua et al., 2016; Huang et al., 2016; Zhang and Gong, 2018). It is clear that socio-economic factors could exert more complicated effects on air pollution. However, its mechanism is still inconclusive, which remains to be further tested.
Whether regional economic growth and industrialization can affect air pollutant concentration through both agglomeration effect and structure effect, especially when the regional economy evolves to a higher stage with obvious industrial reconstruction, the mechanism is more complex. Some previous studies have concerned the relationship between industrialization and air pollution. Tian (2014), Ma (2018) and others believed that the industrial structure is affected by the natural resource endowment and reacts to the regional environment, which has directly brought about the issue of air pollution. Han (2014), Li (2014), Xu (2016), Wang (2017), Zhang (2020) and others discovered that the proportion of secondary industries in Chinese cities has a positive impact on concentration of PM2.5. Tao (2014) and Nasreen (2017) pointed out that different industries have prominent differences in terms of energy consumption and pollutant emission. Evidences from Zhao (2013) showed that power plants, heavy industry and transportation are the main emitters of nitrogen oxides. Sun (2018) stated that fossil fuel combustion is the main contributor to SO2, NOx and CO2 emissions and that industrial process is the largest source of volatile organic compound (VOC) emissions. Wang (2016, 2019) also argued that SO2 pollution mainly comes from energy-intensive industries, and NO2 and PM10 pollutants mainly come from automobile exhausts, industrial dust and construction dust. Empirical studies outside China have also noted the important influence of industrial structure on regional air quality. For example, Matthew (2005) found that the intensity of air pollution produced by the UK’s manufacturing industry is a negative function of the size of the average firm, productivity and expenditure capital on research and development; whereas, it is a positive function of energy use, and physical and human capital intensity. Tirusha and Roseanne (2011) proved that industries in Durban, South Africa were major sources of air pollutant emissions. Nicholas (2011) discovered that the losses of air pollution damages resulting from oil and coal-fired power plants in the United States were larger than their value added. Monica (2016) assessed the interactive role between the power generation, manufacturing and road transportation sectors and regulations, and found that the interplay of policy and technological advances had substantial benefits in Europe, even leading to the improvement of air quality in other parts of the world.
Most of the existing studies explored the relationship between industrialization and air pollution in macro scale by examining a single industry or sector. However, the mechanism of how industrial structure and spatial agglomeration affect air pollution requires further discussion, especially from the perspective of energy-intensive industries in typical metropolitan areas with urbanization and industrialization processes. As such, the North China Plain region, with its rapid economic development, high proportion of energy-intensive industries and severe air pollution, has been selected as a case study for this paper. This paper aims to explore the relationship between energy-intensive industries and air pollution in the course of rapid industrialization, which is expected to deepen our theoretical understanding of how to maintain economy-environment sustainability during the process of economic development. Meanwhile, it can serve as a scientific reference not only for developing countries seeking to optimize their industrialization path and improve their environmental quality, but also for Chinese government in carrying out the high-quality development target.

2 Data and methodology

2.1 Study area and data sources

2.1.1 Description of the study area
In this paper, the study area includes two municipalities and three provinces in North China Plain region, namely, Beijing, Tianjin, Hebei, Shandong and Henan, where 47 sample cities at the prefecture level and above are selected, as shown in Figure 1. The region covers a total area of 540,000 km2. In 2018, the permanent population in the research area was 309 million, with gross regional product of 20.97 trillion yuan. Despite accounting for only 5.6% of China’s total land area, the research area contained 22% of its national population and contributed 23% of gross domestic product (GDP). The region has rich mineral resources and a comprehensive industrial system, consisting of the iron and steel, energy, petrochemicals, electronic machinery, equipment manufacturing, and textile processing industries. It is also an important industrial base for energy and basic raw materials in China (Wang, 2015; Zhao et al., 2015). In the period of 2007 to 2016, the location entropy (LE) of energy-intensive industries in the study area was 1.11, and that of the non-metallic and ferrous metal industries, the oil industry, and the chemical industry was 1.32, 1.12 and 1.16, respectively, indicating a significant agglomeration of these industries in the region. In addition, the oil, chemical, ferrous metal, non-ferrous metals, electric and thermal power, and other industries in this region constantly increased their share of national output in their respective industries. Among them, the chemical industry increased its share of national chemical industrial output from 37.69% to 42.74%, and the ferrous metal and non-metallic mineral production industries increased their share to 44.24% and 44.40%, respectively, making them the region’s dominant industries.
Figure 1 The research area and distribution of main energy and mineral resources in the North China Plain
This industrial system consisting of huge energy-intensive manufacturing has also caused the study area being the region with the worst air quality in China. In 2017, of the 30 key national environmental protection cities with the fewest days that met second-level air quality standards, 19 were among our sample cities. Even worse, many cities in the research area have had consecutive days with red alert smog warnings in recent years. Since this region is experiencing industrial transformation and faces serious air pollution problems that have attracted much attention, it provides an ideal setting in which to analyze the impact of energy-intensive industries on regional air quality and to explore its mechanism.
2.1.2 Data sources
Based on the availability and continuity of data, this paper selects annual average concentrations of SO2, NO2 and PM10 to characterize air quality in the study area, spanning the period from 2007 to 2016. Data were obtained from the China Statistical Yearbook on Environment, China City Statistical Yearbook, the statistical yearbooks on the environment of sample cities and provinces, and environmental status reports of related area. The definition of an energy-intensive industry is taken from the Statistical Bulletin of China’s 2010 National Economic and Social Development, including industries with strong energy dependence, high energy consumption and high pollution emissions, such as the oil processing and coking industry, nuclear fuel processing industry, chemical industry, non-metallic mineral products industry, metal smelting and rolling industries, and electric and thermal power production and supply industries. Model and data calculations were completed using Stata14, and maps were produced using ArcGIS 10.6.

2.2 Methods

2.2.1 Spearman’s rank correlation coefficient
Spearman’s rank correlation coefficient is used in time series analysis to check trends in data changes (Gu et al., 2009). The formula is:
${{\gamma }_{S}}=1-\left[ 6\underset{i=1}{\overset{n}{\mathop \sum }}\,{{\left( {{x}_{i}}-{{y}_{i}} \right)}^{2}} \right]/\left[ {{t}^{3}}-t \right]$
where γS is the rank correlation coefficient, t is the time period sequence, and n is the total number of time periods; xi is the annual average concentration of air pollutant in the study area, sorting from small to large; and yi is the year arranged from 2007 to 2016 in order. Whether the values of γS are positive or negative indicates an increasing or a decreasing trend in the annual average concentration of air pollutants in the study area, and its absolute values indicate the significance degree of change. When Daniel rank correlation coefficient is greater than the critical value of, it indicates a statistically significant changing trend (the critical values of can be checked from the Spearman’s rank correlation coefficient critical table).
2.2.2 Coefficient of variation
The coefficient of variation is the ratio of the standard deviation of sample data to the sample mean, which can measure the degree of variation of observations and the relative equilibrium between regions (Xiao et al., 2016). The formula is:
$CV=\frac{\sqrt{\frac{1}{N}\cdot \mathop{\sum }_{i=1}^{n}{{\left( {{X}_{i}}-\bar{X} \right)}^{2}}}}{{\bar{X}}}$
where CV is the coefficient of variation, N is the number of samples, Xi is the value of the samples, and $\bar{X}$ is the average value of the samples. The higher the coefficient of variation, the greater the dispersion of observed values of regional air pollutants, indicating a greater regional spatial heterogeneity of air pollution. This paper uses the coefficient of variation to illustrate the regional variation of air quality in the study area.
2.2.3 Air pollution evaluation index
There are two categories of environment and air quality function zones under China’s Ambient Air Quality Standard (GB3095-2012). The first includes nature reserves, scenic spots and other areas that require special protection, and the second includes residential areas, mixed commercial and residential areas, cultural areas, industrial areas and agricultural areas. The sample cities of this study belong to the second type, with second-level concentration limits as the air quality requirement (Table 1). Accordingly, this paper constructs a single air pollution index Ii, which is used to evaluate and analyze the status of cities in terms of single air pollutants.
$I_{i}=\frac{P_{i}}{P_{si}}$
where Ii is the pollution index of pollutant i in a city (i=1, 2 and 3 represent the air pollutants SO2, NO2 and PM10, respectively); Pi is the monitored concentration of pollutant i, and Psi is the upper concentration limit of national second-class standard for pollutant i. When Ii=1, it means that the concentration of pollutant i in a city meets the national second-class standard. The greater the value of Ii, the more the pollutant concentration of a city exceeds the national standard, and the worse the air quality. Conversely, the lower the value, the higher the air quality.
Table 1 Concentration limits of air pollutants for second-class air quality in GB3095-2012
Individual air pollutant Average period Second-class concentration limit Unit
SO2 Annual average 60 μg/m3
NO2 Annual average 40 μg/m3
PM10 Annual average 70 μg/m3
2.2.4 Panel data regression models
Panel data integrates cross-sectional data and time-series data, in which the complexity and interaction of different factors can be captured through panel data regression models (Chen, 2010). This paper used the following three models.
Model 1: Pooled OLS regression model
The basic hypothesis of this model is that there is no individual effect, and different samples and explanatory variables have nothing to do with individual heterogeneity. The calculation formula is:
${{Y}_{it}}=\alpha +\underset{m=1}{\overset{k}{\mathop \sum }}\,{{\beta }_{m}}{{X}_{mit}}+{{\theta }_{it}}$
where m = 1, 2, …k is the number of explanatory variables; Xmit is the explanatory variable of individual i at time t, which are six core explanatory variables covering energy-intensive industries and ten control variables including natural condition, social factors, environment regulation; Yit is the explained variable of individual i at time t, that is the concentration of air pollutant SO2, NO2 and PM10, respectively. And θit is the random error which depends on individual i and time t. In the mixed regression model, α is unrelated to each explanatory variable Xmit.
Model 2: Fixed effect (FE) model and two-way fixed effect model
When a panel data model examines individual-specific effects and the intercept varies for different samples while the slope coefficient is the same, the model is called a fixed effect model, which has the following formula:
${{Y}_{it}}={{\alpha }_{i}}+\underset{m=1}{\overset{k}{\mathop \sum }}\,{{\beta }_{m}}{{X}_{mit}}+{{\theta }_{it}}$
where m, k, Xmit, Yit and θit are the same as formula (4). In the FE model, αi is the parameter that changes as individual i changes.
Individual fixed effect model solves the missing variables which are time invariant but individual varying.
Analogously, time fixed effect model could solve the missing variables which are individual invariant but time varying. When the panel data model takes both individual fixed effect and time fixed effect into consideration, it is called two-way fixed effect model, shown as follows:
${{Y}_{it}}={{\alpha }_{i}}+{{\gamma }_{t}}+\underset{m=1}{\overset{k}{\mathop \sum }}\,{{\beta }_{m}}{{X}_{mit}}+{{\theta }_{it}}$
where m, k, Xmit, Yit and θit are the same as formula (4), αi is the same as formula (5). In the two-way FE model, γt is the dummy variable defined by time t.
Model 3: Random effect (RE) model
In a RE model, the hypothesis is that the influence of random factors does not change over time and is unrelated to random errors. The formula is as follows:
${{Y}_{it}}={{\alpha }_{i}}+\underset{m=1}{\overset{k}{\mathop \sum }}\,{{\beta }_{m}}{{X}_{mit}}+{{\theta }_{it}}$
where m, k, Xmit, Yit and θit are the same as formula (4). In the RE model, αi is considered an intercept with individual heterogeneity that is independent of the explanatory variable Xmit.
2.2.5 Panel vector autoregressive (PVAR) model
This model involves the application of a vector autoregressive model to the panel data, which can effectively show the dynamic relationship between endogenous variables. Once exogenous variables are added, it can also describe the dynamic response of explained variables to a specific shock. This model combines the advantages of panel data and a traditional VAR model (vector autoregressive model), while reducing the VAR model’s restrictive requirements on the length of the time series and effectively capturing the impact of unobservable heterogeneity between individuals on model parameters (Duan et al., 2012; Li et al., 2015). The formula is as follows:
${{Y}_{it}}={{\alpha }_{0}}+\underset{j=1}{\overset{k}{\mathop \sum }}\,{{\alpha }_{j}}{{X}_{i,t-j}}+{{\varepsilon }_{i}}+{{\gamma }_{t}}+{{\theta }_{it}}$
where Yit is the same as formula (4), α0 represents the intercept, j is the lag order, αj is the estimated matrix of lag j, εi and γt are the individual fixed effect and individual time effect respectively, and θit is the random error vector; Xi,t-j is the vector of core explanatory variables related to six energy-intensive industries, namely, the output value of oil processing and coking and nuclear fuel, chemical industry, non-metallic mineral production, ferrous metal smelting and pressing, non-ferrous metals smelting and pressing, electric and thermal power production and supply industries, respectively.

3 Spatiotemporal evolution of air pollutants

3.1 Temporal characteristics of air pollutants

In regard to the variation trend of pollutants in the study area, the annual average concentration of SO2 in the study area decreased year by year from 2007 to 2016, whereas the concentrations of NO2 and PM10 increased (Table 2). The pollution of SO2 in our study area has been effectively controlled, with more than one-third of cities experiencing a clearly declining Daniel rank correlation coefficient, which indicates that China’s Air Pollution Prevention and Control Action Plan and other policies have been effective. The NO2 concentration of about one-eighth of cities in the study area increased significantly, indicating that vehicle exhaust emissions have not been effectively controlled in the region. Annual average concentration of PM10 in nearly a quarter of cities increased significantly, which means that there are gaps in the treatment of industrial dust and construction dust in the study area and that the industrial structure and related processes need to be optimized and upgraded urgently.
From the perspective of regional difference of air pollution, the average variation coefficients of SO2, NO2 and PM10 during the study period were 0.3, 0.23 and 0.2, respectively, indicating that regional differences in concentrations of the three pollutants were minor (Figure 2). The inter-annual change in the variation coefficient of NO2 was small, and overall concentration of NO2 remained stable. In contrast, the coefficients of variation of SO2 and PM10 fluctuated significantly. To say specifically, they hit a low in 2011 but reached a record high in 2013 due to regional difference expansion and air pollution increase in certain localities; and from 2013 to 2016, the coefficients of variation declined significantly, which meant regional differences narrowed gradually and air pollution in the study area became more balanced. It can be verified, then, that the Air Pollution Prevention and Control Action Plan issued by the State Council in 2013 promptly curbed air pollution in key areas.
Table 2 Spearman’s coefficient of ambient pollutants in the North China Plain
SO2 NO2 PM10 SO2 NO2 PM10 SO2 NO2 PM10
North China -0.576 0.685 0.491 Jinan -0.127 0.867 0.491 Zhengzhou -0.867 0.842 0.709
Hebei -0.503 0.539 0.455 Qingdao -0.806 0.152 -0.261 Kaifeng -0.867 -0.345 0.697
Shandong -0.358 0.758 0.539 Zibo 0.176 0.758 0.564 Luoyang -0.394 0.721 0.648
Henan -0.515 0.503 0.758 Zaozhuang -0.297 0.055 0.552 Pingdingshan -0.539 -0.503 0.588
Beijing -0.988 -0.358 -0.915 Dongying -0.285 0.442 0.467 Anyang -0.127 0.721 0.624
Tianjin -0.806 0.455 0.721 Yantai -0.964 -0.503 0.115 Hebi -0.273 0.370 0.794
Shijiazhuang 0.236 0.830 0.503 Weifang -0.564 0.164 0.648 Xinxiang -0.345 0.418 0.867
Tangshan -0.491 0.600 0.636 Jining -0.042 0.370 0.758 Jiaozuo -0.867 0.479 0.733
Qinhuangdao -0.382 0.855 0.455 Tai’an -0.067 0.576 0.806 Puyang -0.467 -0.370 0.709
Handan -0.236 0.515 0.503 Weihai -0.830 -0.952 0.539 Xuchang -0.806 0.745 0.903
Xingtai 0.152 0.467 0.455 Rizhao -0.055 -0.042 0.794 Sanmenxia -0.515 0.758 0.624
Baoding -0.152 0.745 0.564 Laiwu -0.030 0.552 0.867 Nanyang -0.212 0.042 0.552
Zhangjiakou -0.745 -0.164 0.733 Linyi -0.818 0.261 0.455 Shangqiu -0.067 0.321 0.891
Chengde -0.952 0.103 0.430 Dezhou -0.806 -0.224 0.539 Xinyang -0.055 0.455 0.491
Cangzhou 0.503 0.588 0.370 Liaocheng -0.406 0.745 0.782 Zhoukou -0.758 -0.503 0.709
Langfang -0.855 0.479 0.455 Binzhou 0.067 0.564 0.770 Zhumadian -0.285 0.636 0.758
Hengshui -0.406 0.588 0.491 Heze -0.794 0.018 0.358 Luohe -0.624 0.297 0.552

Notes: When n is 10 and the level of significance is 0.01, the absolute value of is 0.746. Bold numbers in the table indicate those with statistical significance.

Figure 2 Variation coefficient of annual average concentration of three air pollutants in the North China Plain

3.2 Spatial characteristics of air pollutants

Figure 3 plots the spatial pattern of SO2, NO2 and PM10 pollution and its evolution in the cities of the study area every three years from 2007 to 2016. It shows that SO2 and NO2 pollution levels were relatively low, and PM10 pollution was more severe in cities adjacent to the border area of Hebei, Shandong and Henan provinces. By 2016, SO2 concentration in all sample cities reached the national second-class standard of air quality, reflecting effectiveness of desulfurization technology and process during the past years in this region (Figure 3a).
Figure 3 Spatial characteristics of air pollution indexes for three pollutants in the North China Plain
The NO2 pollution in sample cities was alleviating overall, but cities suffering from serious NO2 pollution tended to agglomerate from border area to the central area, with a greater pollution index in central area from 2013 to 2016 when compared with previous years (Figure 3b). For PM10 pollution, meanwhile, its situation was worse (Figure 3c). In 2016, the air pollution index of PM10 was greater than 1 in all cities except for the city of Yantai. Of them, nearly 50% had an air pollution index of more than 2 between 2013 and 2016, indicating that PM10 pollution in the region far exceeded the national standard and that there was a severe pollution problem.

4 Analysis of influencing factors of air pollutants

4.1 Mechanism analysis and theoretical framework

It has been generally recognized that air quality is affected by multiple factors as natural factors and socioeconomic factors interacting with complex mechanism. For example, physical geographical condition is one of the main natural factors that affect concentrations of air pollutants in the sample cities. The study area is located in north China, with the sea to the east and backed by the Yanshan and Taihang mountains to the north and west, so pollutants circulate within the area and have difficulty in dispersing. Nevertheless, human activities, such as industrialization and urbanization, are the root causes of air pollutant emission. The North China Plain region contains the Beijing-Tianjin-Hebei urban agglomeration, the Shandong Peninsula urban agglomeration and the Central Plains urban agglomeration, making it one of China’s most important regions for urban agglomerations, one of the regions with the most rapid urbanization and industrialization, and one of the regions worst affected by air pollution. The socioeconomic factors such as the energy consumption, pollution treatment, technical processes and scale efficiency of industries directly affect the volumes of waste gases produced during manufacturing and consumption of products. For example, if we divide industries into energy-intensive industries and general manufacturing industries, it is found that pollutants emitted by energy-intensive industries account for a very large proportion of pollutants from anthropogenic sources and are an important source of air pollution. SO2 emitted by energy-intensive industries accounts for 75% of industrial SO2 emissions, while energy-intensive industries account for 86% of NOx and 97% of PMX emissions. There are also close correlations between different air pollutants (Figure 4). For example, SO2 has a significant correlation with PM10 and CO; NO2 is significantly correlated with PM10, CO, O3 and PM2.5; and PM10 is significantly correlated with CO, O3 and PM2.5, which indicates that the impact of energy-intensive industries on these three air pollutants as SO2, NO2 and PM10 is meaningful to discuss the impacts on air quality in general.
In this study, annual average concentrations of SO2, NO2 and PM10 are used as explained variables, while each city’s natural and socioeconomic indicators are used as influencing factors. By constructing panel regression models, it is possible to explore the main factors affecting air quality in the study area. On this basis, by constructing a PVAR model, it is then possible to further analyze the impact of specific energy-intensive industries on air quality (Figure 4).
Figure 4 Flow chart of air pollutant influencing factors analysis

4.2 Constructing the panel data models

Based on the research results of existing literature, this paper is devoted to exploring the impact of industrial structure on air pollution. Aside from selecting a number of typical factors mentioned in previous studies as control variables (Ma et al., 2014; Lin et al., 2016), indicators of energy-intensive industries were chosen as core influencing factors. Factors were firstly screened by Pearson correlation, and 16 variables significantly correlated to air pollutants were introduced into the panel regression models (Table 3). The 16 variables were classified into four types, corresponding to nature, socio-economy, environment, and industrial structure, respectively. Industrial structure factors were used to mainly examine the impact of six energy-intensive industries on air quality. Annual mean temperature was used to characterize natural condition. For socio-economic factors, we chose gross domestic product, actual use of foreign investment, gross industrial output value, population density, and population size to describe economic development, opening up level, industrialization, urban scale and labor resources, respectively. For environmental regulation and environmental condition, we selected industrial sulfur dioxide emission, smoke and dust emissions, wastewater discharge, and green area as indicators.

4.3 Results of panel data models

The estimation results for the influential factors on air quality in the study area are listed in Table 4, showing that the optimal model for SO2, NO2 and PM10 was FE model. From the results of FE models, the output value of oil processing industry had a negative correlation
Table 3 Explanatory variables of urban air quality and their Pearson correlation test
Factor type Influencing factor Variable
name
Correlation test
SO2 NO2 PM10
Nature Annual mean temperature temp -0.045 0.019 0.108**
Socio-economy Gross domestic product GDP -0.151*** 0.358*** 0.125***
Actual use of foreign investment UFI -0.133*** 0.240*** 0.038
Gross industrial output value Indus 0.047 0.283*** 0.241***
Population density Popden -0.036 0.255*** 0.225***
Population size Popu -0.165*** 0.107** 0.194***
Environment Industrial sulfur dioxide emission SOP 0.471*** 0.157*** 0.056
Smoke and dust emissions AshP 0.115** 0.184*** 0.123***
Wastewater discharge Water 0.372*** 0.248*** 0.146***
Green area Garea -0.129*** 0.329*** 0.065
Industrial structure Oil processing and coking and nuclear fuel
output value
Oil 0.142*** 0.257*** 0.188***
Chemical industrial output value Chemical 0.153*** 0.256*** 0.270***
Non-metallic mineral production output value N-metal 0.064 0.233*** 0.254***
Ferrous metal smelting and pressing output value B-metal 0.145*** 0.199*** 0.178***
Non-ferrous metals smelting and pressing
output value
C-metal -0.037 0.155*** 0.099**
Electric and thermal power production and
supply output value
E-power -0.062 0.295*** 0.181***

Note: *, **, *** represent significance levels of 0.1, 0.05 and 0.01, respectively.

Table 4 Results of panel data models for the North China Plain
SO2 NO2 PM10
OLS FE RE OLS FE RE OLS FE RE
lgtemp -3.441 -0.66 -1.277 3.092 1.908 2.302 25.476*** 12.626 22.294**
lgGDP -5.512** -4.906 -6.181** -1.325 1.374 -0.349 0.116 3.623 0.107
lgUFI -0.893 5.257*** 1.825* 0.030 3.022*** 1.372** -1.852 13.673*** 1.049
lgIndus -2.678 -3.576 -2.961 2.517** 7.076*** 3.473** 6.920 16.172** 10.453**
lgPopden 4.064** -2.498 1.293 3.849*** 0.600 2.955** 8.325** -9.838 6.800
lgPopu -6.268*** -46.969** -5.444** -3.803*** -0.415 -3.012** 0.428 -8.234 1.478
lgSOP 9.633*** 6.615*** 8.572*** -2.650*** -2.108* -2.424*** -13.422*** -4.576 -13.271***
lgAshP 1.663 0.649 0.692 3.402*** 3.308*** 3.440*** 16.061*** 10.679*** 16.009***
lgWatew 5.768*** 3.266 5.533*** 1.880** -2.068 0.454 -1.924 -7.598 -3.296
lgGarea 2.421 -6.117 -0.177 2.777*** -3.638 0.869 -5.168 3.745 -7.524*
lgOil 0.222 -1.343* 0.230 0.126 -1.024** 0.054 0.297 -4.075** 0.002
lgChemical 2.659** 1.910 2.329* 0.099 0.177 0.096 5.249** 9.108** 4.891*
lgN-metal -0.494 -0.043 -0.648 -0.923 -1.163 -0.940 -1.418 -8.091* -1.475
lgB-metal -0.795** 0.955 -0.281 -0.261 -1.958** -0.250 -0.712 -3.380 -0.553
lgC-metal 0.070 -1.334 -0.030 0.222 0.146 0.200 1.113** 4.643 1.057
lgE-power 0.443 2.615 1.011 1.495 -1.201 0.356 2.857 -2.053 0.776
Constant -56.650** 304.721** -29.997 -60.205*** -25.437 -51.989*** -172.894*** -231.650 -184.514***
R2 0.393 0.210 0.312 0.238 0.287 0.350
rho 0.862 0.180 0.643 0.168 0.663 0.068
F-test 4.33 4.33 4.33
Wald 148.60 134.28 163.12
LM 35.43 46.81 19.83
Hausman 55.79 54.73 92.61
Model Fixed effect model Fixed effect model Fixed effect model

Note: *, **, *** represent significance levels of 0.1, 0.05 and 0.01, respectively.

with concentrations of air pollutants. The chemical industrial output value was positively correlated with concentration of PM10, indicating that the chemical industry is an important contributor to PM10 in the study area.
It is of interest that the output value of the ferrous metal smelting and pressing industry was negatively correlated with NO2, which proves that the Guiding Catalogue of Industrial Structure Adjustment in China has effectively promoted energy-saving and emission-reducing technologies, smoke and dust purification technologies, and cleaner production techniques in the iron and steel industries. These improvements have successfully decreased emissions of smoke and dust in industries such as iron and steel making, steel rolling and ferroalloy smelting. The non-metallic mineral production industry had a negative correlation with PM10. This indicates that industrial dust emitted by the non-metallic mineral production industry has been easing up owing to the new production technique.
As shown in Table 4, the role of control variables on air quality varied greatly. Gross domestic product had a mixed correlation with SO2, NO2 and PM10, which needs to be deeply tested in the future. The positive correlation between actual use of foreign investment and air pollution tends to support the Pollution Haven Hypothesis partly. Smoke and dust emission, another important indicator showing environmental condition, reported a significantly positive impact on concentrations of NO2 and PM10. Besides, gross industrial output value was positively correlated with concentrations of NO2 and PM10, reflecting that the industrial production is still a leading force triggering air pollution in the study area.
Using two-way fixed effect model, we also tested the time fixed effect, which can illustrate the changing trend of different pollutant concentrations. As shown in Table 5, the fluctuation of coefficients of time fixed effect indicates that the concentrations of SO2, NO2 and PM10 during our research period were not decreasing constantly. The fluctuation of NO2 and PM10 is more obvious than that of SO2, which is consistent with our analysis in part 3.

4.4 Results of panel vector autoregressive model

The impact of energy-intensive industries on air quality was further tested by Panel Vector Autoregressive Model (PVAR), which can capture the response effect in detail.
Table 6 lists the LLC and IPS test results and indicates that the sample data presented panel stationarity, matching the requirement of PVAR model estimation. The test results from AIC, BIC and HQIC criteria suggested that the optimal time lag of the selected model is 1 year. It is found that the lag phase of concentrations of NO2 and PM10 had a positive effect on the current period, indicating that NO2 and PM10 have a significant lag effect. In terms of the response mechanism of air pollutants to energy-intensive industries, the lag period of the chemical industry, non-metallic mineral production industry, and electric and thermal power production and supply industries have a significant positive effect on NO2 concentrations. Besides, the chemical industry, non-metallic mineral production industry, electric and thermal power production and supply industries, and the ferrous metals industry have a significant positive effect on PM10 concentrations, indicating that the above industries are important factors resulting in NO2 and PM10 pollution.
Figure 5 plots the impulse response effects of air pollutants to energy-intensive industries in detail. The results show that the oil processing and coking industry, nuclear fuel processing industry, chemical industry, non-metallic mineral production industry, ferrous metal smelting and pressing industries, and electric and thermal power generation and supply industries had a positive impulse response to NO2 and PM10, all showing a convergence trend. The non-ferrous metals smelting and pressing industry had a positive impulse response to NO2 with a convergence trend. Accordingly, energy-intensive industries such as the oil processing and coking industry, nuclear fuel processing industry, chemical industry, non-metallic mineral production industry, and electric and thermal power production and supply industries are important drivers of air pollution, which have a clear short-term impact. Therefore, the management and control of these industries would effectively mitigate air pollution in the region.
Table 5 Results of influencing factors on air pollution in two-way fixed effect model
SO2 NO2 PM10
lgtemp 0.812 1.039 7.752
lgGDP 1.718 -0.751 -0.368
lgUFI 2.947** 1.119 4.199**
lgIndus 0.808 4.834** 14.240**
lgPopden -0.870 0.877 -7.154
lgPopu 5.538 8.273 72.651*
lgSOP 0.266 -1.610 -6.177*
lgAshP 1.272 2.310*** 6.100***
lgWatew 0.861 -1.221 -4.947
lgGarea -3.995 -7.141*** -10.531
lgOil -1.402** -0.749* -2.035
lgChemical 1.952 -0.550 5.209**
lgN-metal 0.071 -0.336 -4.588
lgB-metal -0.007 -1.544** -1.884
lgC-metal -0.858 -0.141 3.165
lgE-power -0.498 -1.536 -4.294
year2 -3.018 -1.037 -4.633
year3 -5.145* 1.167 -4.235
year4 -8.427*** 1.969 -7.662
year5 -11.537*** 1.366 -18.482***
year6 -12.184*** 0.007 -19.098**
year7 2.786 12.176*** 43.293***
year8 -6.843 10.043*** 27.893***
year9 -18.946*** 5.552 16.435*
year10 -25.908*** 7.177** 1.584
Constant -17.177 15.912 -414.978*
N 460 460 460
R2 0.416 0.380 0.660
F-test 5.64 4.35 4.27
rho 0.687 0.786 0.824

Note: *, **, *** represent significance levels of 0.1, 0.05 and 0.01, respectively.

Table 6 Estimated results of the PVAR model
h_SO2 h_NO2 h_PM10
Coef. P>|z| Coef. P>|z| Coef. P>|z|
h_ Oil L1. -1.363 0.733 0.171 0.212 0.418 0.327
h_ Chemical L1. 1.136 0.615 0.071*** 0 0.141*** 0
h_ N-metal L1. 0.817 0.531 0.062*** 0 0.116*** 0
h_ B-metal L1. 0.088 0.174 0.050 0.151 0.085** 0.014
h_ C-metal L1. -0.379 0.745 0.082 0.135 0.775 0.666
h_ E-power L1. 0.668 0.322 0.100*** 0.001 0.192*** 0

Note: *, **, *** represent significance levels of 0.1, 0.05 and 0.01, respectively.

Figure 5 plots the impulse response effects of air pollutants to energy-intensive industries in detail. The results show that the oil processing and coking industry, nuclear fuel processing industry, chemical industry, non-metallic mineral production industry, ferrous metal smelting and pressing industries, and electric and thermal power generation and supply industries had a positive impulse response to NO2 and PM10, all showing a convergence trend. The non-ferrous metals smelting and pressing industry had a positive impulse response to NO2 with a convergence trend. Accordingly, energy-intensive industries such as the oil processing and coking industry, nuclear fuel processing industry, chemical industry, non-metallic mineral production industry, and electric and thermal power production and supply industries are important drivers of air pollution, which have a clear short-term impact. Therefore, the management and control of these industries would effectively mitigate air pollution in the region.

5 Conclusions and implications

5.1 Conclusions

This study has attempted to explore the driving forces of air pollution in industrial agglomeration areas in China, paying particular attention to the leading role of energy-intensive industries on air quality of 47 sample cities in the North China Plain from 2007 to 2016. Main results are as follows.
First, the results show that overall air quality has been improved in the study area from 2007 to 2016, with a greater fall in concentration of SO2 than that of NO2 and PM10, indicating the effectiveness of desulfurization technology in energy-intensive manufactures during the past decades in this region. However, more efforts need to be devoted to mitigate the pollution of NO2 and PM10, whose concentrations are still relatively severe for most cities in the North China Plain.
Second, air quality showed an obvious regional heterogeneity, with provincial border areas suffered more from serious air pollution. This indicates that the air pollution control action should be implemented across the administrative boundary and only by the regional joint efforts can the air pollution problems be fundamentally controlled.
Third, the empirical evidences of our study prove that industrial structure, especially the amount of energy-intensive industries, has significant correlation with air pollutant emissions. The results from panel data models and PVAR models all support that energy-intensive industries are important drivers of air pollution. However, the impact of different sectors on concentrations of air pollutants is quite different, which still needs to be deeply investigated in the future.

5.2 Implications

Currently, China is evolving towards a stage of high-quality development, which means that economic growth and industrial transformation are to be carried out simultaneously. Therefore, the pathway of how to maintain economy-environment sustainability during the processes of urbanization and industrialization is vital and deserves to be further discussed. Since little attention has been devoted to systematically explore the impact of energy-intensive industries on air quality and its mechanism, our research is expected to shed some new light not only on theoretical understanding of the effect of socioeconomic activities on air pollution, but also on tailor-made environmental governance and targeted pollution treatments in densely populated urban areas of China.
Since energy-intensive industries are still the pillar industries supporting economic development in the North China Plain region at the current stage, which cannot be leaped over, green management of secondary industry is recommended as the priority for the governments and enterprises to meet the requirement of high-quality development. On the one hand, the government should continue to improve the regulatory standards of air pollution, and strengthen the supervision of air pollution problems. On the other, specific measures recommended are to increase investments in new technologies and new processes in energy-intensive industries, to promote industrial transformation and upgradation, and to improve energy efficiency and pollution treatment levels, etc.
It must be admitted that our study has a few limitations. First, factors affecting the concentrations of air pollutants have not been fully estimated or accurately quantified in our models due to data availability, for example, nature factors have been less modelled and policy intervention might not have been precisely quantified. Second, long-term effect of energy-intensive industries on air quality has not been examined due to the limitation of data span of time series. These are expected to be improved in our research in the future.
1
Ahmet A A, 2013. Economic growth and its impact on environment: A panel data analysis. Ecological Indicators, 24:324-333.

DOI

2
Chen Q, 2010. Advanced Econometrics and Stata Application. Beijing: Higher Education Press. (in Chinese)

3
Costantini V, Monni S, 2007. Environment, human development and economic growth. Ecological Economics, 64(4):867-880.

DOI

4
Duan X M, Xu M, 2012. Empirical study on the relationship between China’s economic growth and environmental pollution based on PVAR model. China Population, Resources and Environment, 22(2):136-139. (in Chinese)

5
Gong Z Z, Zhang X P, 2017. Assessment of urban air pollution and spatial spillover effects in China: Cases of 113 key environmental protection cities. Journal of Resources and Ecology, 8(6):584-594.

DOI

6
Gu K K, Liu J S, Chen X, 2009. Analysis of environmental air quality trends and driving factors of mining cities in central Liaoning. Journal of the Graduate School of the Chinese Academy of Sciences, 26(2):251-257. (in Chinese)

7
Han L J, Zhou W Q, Li W F et al., 2014. Impact of urbanization level on urban air quality: A case of fine particles (PM2.5) in Chinese cities. Environmental Pollution, 194(1):163-170.

DOI

8
Hua S B, Tian H Z, Wang K et al., 2016. Atmospheric emission inventory of hazardous air pollutants from China’s cement plants: Temporal trends, spatial variation characteristics and scenario projections. Atmospheric Environment, 128:1-9.

DOI

9
Huang L, Hu J L, Chen M D et al., 2016. Impacts of power generation on air quality in China (Part I): An overview. Resources Conservation and Recycling, 121:103-114.

DOI

10
Li Q, Hu H, Luo H J et al., 2015. Two-way coupling relationship between economic growth and environmental pollution: Regional difference analysis based on PVAR model. Acta Scientiae Circumstantiae, 35(6):1875-1886. (in Chinese)

11
Li Q, Song J P, Wang E R et al., 2014. Economic growth and pollutant emissions in China: A spatial econometric analysis. Stochastic Environmental Research and Risk Assessment, 28(2):429-442.

DOI

12
Lin X Q, Wang D, 2016. Spatiotemporal variations and socio-economic driving forces of air quality in Chinese cities. Acta Geographica Sinica, 71(8):1357-1371. (in Chinese)

13
Lv L Y, Li H Y, 2016. Health economic evaluation of PM10 and PM2.5 pollution in Beijing-Tianjin-Hebei region of China. Acta Scientiarum Naturalium Universitatis Nankaiensis, 49(1):69-77. (in Chinese)

14
Ma L, Kang L, Jin F J, 2018. Spatial and temporal coupling relationship between industrial development and air pollutant emissions in Beijing-Tianjin-Hebei region. Environmental Impact Assessment, 40(5):43-48. (in Chinese)

15
Ma L M, Zhang X, 2014. The spatial effect of China’s haze pollution and the impact from economic change and energy structure. China Industrial Economics, ( 4):19-31. (in Chinese)

16
Matthew A C, Robert J R E, Kenichi S, 2005. Industrial characteristics, environmental regulations and air pollution: An analysis of the UK manufacturing sector. Journal of Environmental Economics and Management, 50(1):121-143.

DOI

17
Matus K, Nam K-M, Selin N E et al., 2012. Health damages from air pollution in China. Global Environmental Change, 22(1):55-66.

DOI

18
Monica C, Greet J-M, Frank D et al., 2016. Forty years of improvements in European air quality: Regional policy-industry interactions with global impacts. Atmospheric Chemistry and Physics, 16:3825-3841.

DOI

19
Nasreen S, Anwar S, Ozturk I, 2017. Financial stability, energy consumption and environmental quality: Evidence from South Asian economies. Renewable and Sustainable Energy Reviews, 67:1105-1122.

DOI

20
Nicholas Z M, Robert M, William N, 2011. Environmental accounting for pollution in the United States economy. The American Economic Review, 101(5):1649-1675.

DOI

21
Sun W, Shao M, Granier C et al., 2018. Long‐term trends of anthropogenic SO2, NOx, CO, and NMVOCs emissions in China. Earth’s Future, 6:1112-1133.

DOI

22
Tai A P K, Mickley L J, Jacob D J, 2010. Correlations between fine particulate matter (PM2.5) and meteorological variables in the United States: Implications for the sensitivity of PM2.5 to climate change. Atmospheric Environment, 44(32):3976-3984.

DOI

23
Tao J, Gao J, Zhang L et al., 2014. PM2.5 pollution in a megacity of Southwest China: Source apportionment and implication. Atmospheric Chemistry and Physics, 14(4):8679-8699.

DOI

24
Tian X, Chang M, Shi F et al., 2014. How does industrial structure change impact carbon dioxide emissions? A comparative analysis focusing on nine provincial regions in China. Environmental Science and Policy, 37:243-254.

DOI

25
Tirusha T, Roseanne D D, 2011. Air quality and climate change co-benefits for the industrial sector in Durban, South Africa. Energy Policy, 39(10):6658-6666.

DOI

26
Wang S J, Zhou C S, Wang Z B et al., 2017. The characteristics and drivers of fine particulate matter (PM2.5) distribution in China. Journal of Cleaner Production, 142(4):1800-1809.

DOI

27
Wang Z B, Fang C L, 2016. Spatial-temporal characteristics and determinants of PM2.5 in the Bohai Rim Urban Agglomeration. Chemosphere, 148:148-162.

DOI

28
Wang Z B, Liang L W, Sun Z et al., 2019. Spatiotemporal differentiation and the factors influencing urbanization and ecological environment synergistic effects within the Beijing-Tianjin-Hebei urban agglomeration. Journal of Environmental Management, 243:227-239.

DOI

29
Wang Z Y, 2015. On the adjustment and optimization of leading industries and their spatial distribution in Beijing-Tianjin-Hebei region. Journal of Xi’an Jiaotong University (Social Sciences), 35(2):42-47. (in Chinese)

30
Xiao G, Du D B, Dai Q W, 2016. Chinese regional innovation differences in temporal and spatial evolution. Science Research Management, 37(5):42-50. (in Chinese)

31
Xu B, Luo L Q, Lin B Q, 2016. A dynamic analysis of air pollution emissions in China: Evidence from nonparametric additive regression models. Ecological Indicators, 63:346-358.

DOI

32
Zhan D S, Kwan M P, Zhang W Z et al., 2018. The driving factors of air quality index in China. Journal of Cleaner Production, 197:1342-1351.

DOI

33
Zhang X P, Gong Z Z, 2018. Spatiotemporal characteristics of urban air quality in China and geographic detection of their determinants. Journal of Geographical Sciences, 28(5):563-578.

DOI

34
Zhang X P, Lin M H, 2020. Comparison between two air quality index systems in study of urban air pollution in China and its socio-economic determinants. Journal of University of Chinese Academy of Sciences, 37(1):39-50.

35
Zhao B, Wang S X, Liu H et al., 2013. NOx emissions in China: Historical trends and future perspectives. Atmospheric Chemistry and Physics, 13(6):9869-9897.

DOI

36
Zhao D X, Han Z L, Wang L et al., 2015. The basic pattern about regional industrial division of Bohai Rim. Economic Geography, 35(6):8-16. (in Chinese)

Outlines

/