Research Articles

Influence of river-lake isolation on the water level variations of Caizi Lake, lower reach of the Yangtze River

  • AN Lesheng 1 ,
  • LIAO Kaihua , 2, * ,
  • ZHU Lei 1 ,
  • ZHOU Baohua 1
Expand
  • 1. School of Resources and Environment, Anqing Normal University, Anqing 246133, Anhui, China
  • 2. Key Laboratory of Watershed Geographic Sciences, Nanjing Institute of Geography and Limnology, CAS, Nanjing 210008, China
Liao Kaihua (1984‒), Associate Professor, specialized in soil hydrology and physical geography. E-mail:

An Lesheng (1982‒), Associate Professor, specialized in wetland hydrology and eco-hydrology.E-mail:

Received date: 2020-03-06

  Accepted date: 2020-11-16

  Online published: 2021-06-25

Supported by

National Natural Science Foundation of China, No.(41771107)

Anhui Provincial Natural Science Foundation, No(1808085MD101)

Outstanding Young Talents Support Program in Universities of Anhui Province in 2020, No(gxyq2020030)

Youth Innovation Promotion Association, Chinese Academy of Sciences, No(2020317)

Copyright

Copyright reserved © 2021. Office of Journal of Geographical Sciences All articles published represent the opinions of the authors, and do not reflect the official policy of the Chinese Medical Association or the Editorial Board, unless this is clearly specified.

Abstract

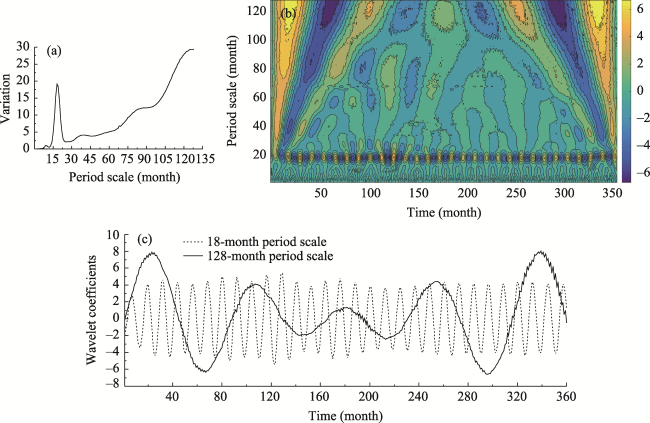
In order to explore the water level variations of Caizi Lake under river-lake isolation, the monthly water level of the Chefuling station in Caizi Lake from 1989 to 2018 and the daily water level, rainfall and flow of local hydrological stations in 2018 were analyzed by using the Mann-Kendall trend test and wavelet analysis. Results showed that the difference of the average water level of Caizi Lake between the flood and dry seasons was 3.34 m, with a multi-year average water level of 10.42 m above sea level. The first and second main periods of the water level of Caizi Lake were 128 and 18 months, respectively, with 4 and 29 “up-down” cycles, respectively. From 2018, the next 3‒4 years were likely to be the low water level period. The water level of Caizi Lake was significantly correlated with that of the Anqing hydrological station of the Yangtze River (r=0.824, P<0.01). In addition, the current hydrological staging of Caizi Lake was about 30 days behind than before the sluice was built. Under the dual influences of the river-lake isolation and the Yangtze-to-Huaihe Water Diversion Project (YHWD), the hydrological regime change of Caizi Lake and its eco-environmental effect needed long-term monitoring and research.

Cite this article

AN Lesheng , LIAO Kaihua , ZHU Lei , ZHOU Baohua . Influence of river-lake isolation on the water level variations of Caizi Lake, lower reach of the Yangtze River[J]. Journal of Geographical Sciences, 2021 , 31(4) : 551 -564 . DOI: 10.1007/s11442-021-1858-4

1 Introduction

Water level is one of the most basic elements to measure the hydrological status of lakes. Its spatio-temporal changes are not only affected by natural factors such as climate, hydrology and topography, but also closely related to human activities (Belete et al., 2015; Wrzesiński and Ptak, 2016). Water level fluctuations in natural state are inherent attributes of lakes, which are very important for maintaining the health and integrity of lake ecosystems (Wantzen et al., 2008; Evtimova and Donohue, 2016). Lockhart et al. (1999) proposed that a lower lake level regulation schedule under consideration for Lake Okeechobee (Florida, USA), while potentially beneficial to overall ecosystem health, might increase the rate of Melaleuca expansion. Hu et al. (2010) found that the long-lasting low water level of Poyang Lake caused damage to the wetland plant communities. Recently, Wang et al. (2016a) observed that the variation of water level resulted from operation of the Three Gorges Project had negative effects on the population composition of macrozoobenthos in Dongting Lake. Therefore, knowledge of lake water level variations is of great significance for water resources management and ecological protection.
The lower reach of the Yangtze River is one of the most concentrated areas of freshwater lakes in China. In history, there were thousands of shallow lakes freely connected with the main stream of the Yangtze River (Qin and Xie, 2006; Dai et al., 2015), forming a unique river-floodplain ecosystem (Wang et al., 2016b). Since the 1950s, only Dongting Lake, Poyang Lake and Shijiu Lake have been naturally connected with the Yangtze River, and other lakes have been cut off from the Yangtze River due to the activities of reclaiming farmland from lakes and building dams and sluices. In addition, a large number of lakes disappeared in recent decades (Zhang et al., 2014; Wang et al., 2016b; Dai et al., 2018). The dynamic mechanism of river-flood plain ecosystems can be expressed as the hydrological connectivity (Amoros and Roux, 1988; Lytle et al., 2004). River-lake isolation led to the loss of lateral connectivity of healthy and natural river ecosystems (Ward, 1989), which reduced the exchange of water, sediment and some organisms between rivers and lakes, and destroyed the specific water level conditions and natural water level fluctuation rules that aquatic organisms evolved and adapted gradually. When the water level of lakes tends to be stable, terrestrial plants will occupy the living space of hygrophyte and the lakeside area will shrink, which will greatly weaken the ecological barrier function of the land-lake ecozone (Liu and Wang, 2010; Hu et al., 2014; Zhang et al., 2015). These factors will eventually reduce habitat heterogeneity and biodiversity. As far as hygrophyte is concerned, the number of species in barrier lakes is 8% lower than that in lakes connected to rivers (Wang et al., 2019).
Anqing wetland, where Caizi Lake is located, is not only one of the three most important wetland areas (the other two are East Dongting Lake and Poyang Lake) in the lower reach of the Yangtze River confirmed by the World Wildlife Fund (WWF), but also a regulation and storage lake for the Yangtze-to-Huaihe Water Diversion Project (YHWD). It has important functions, including flood control and storage optimization, agricultural irrigation, biological habitat provision, and biodiversity maintenance. At present, the researches on Caizi Lake mainly focus on wetland landscapes, morphological characteristics of heavy metals in soil, habitat conditions of wintering waterbirds and suitable water level in winter (Jiang et al., 2018; Li et al., 2019; Liu et al., 2019). For example, Wang et al. (2018a) found that there was a significant negative correlation between the habitat area of mudflats and herbaceous marshes and water level of Caizi Lake during the overwintering period; Liu et al. (2019) observed that there was no significant abrupt change point in the average annual water level of Caizi Lake from 1956 to 2018. However, little research was conducted to investigate the scale-specific temporal patterns of water level of Caizi Lake, especially from the perspective of river-lake relationships. The novelty of this paper is to investigate the multi-scale temporal changes of water level in Caizi Lake by using wavelet analysis. In addition, this paper also focuses on the responses of the water level variations to the river-lake isolation and YHWD. This is of great practical significance for understanding the hydrological regime of Caizi Lake and formulating a reasonable water diversion scheme for YHWD.

2 Materials and methods

2.1 Study area and data collection

Caizi Lake (117°01′‒117°10′E, 30°43′‒30°58′N), located in the northeast of Anqing City, Anhui Province, is a representative shallow water barrier lake. It has a north subtropical humid monsoon climate. The Caizi Lake Basin covers an area of 3234 km2, and the annual average rainfall is about 1389.1 mm. The average elevation at the bottom of the lake is 8.5 m, and the normal water storage level is 11.0 m. The water area of the lake fluctuates from 145.2 to 242.9 km2. The corresponding water level and total volume are 8.1‒15.1 m and 2.87×10⁸‒16.1×10⁸ m3, respectively (Wang et al., 2018b). The main tributaries of Caizi Lake include Dasha River, Guache River, Longmian River, and Kongcheng River. The lake water flows into the Yangtze River through the Zongyang sluice built in 1959. Zongyang sluice is a masonry sluice built on rock foundation. The designed maximum drainage flow is 1150 m3/s, and the check drainage flow is 1288 m3/s. The designed flood control water level difference is 4.5 m (the Yangtze River water level is 17.27 m, and the corresponding internal water level is 12.77 m). When the water level of Chefuling station in Caizi Lake is relatively low (< 11.5 m), in order to alleviate the drought in the area along Caizi Lake, Zongyang gate is usually opened to divert water from the river to the lake, and the water level of Chefuling station is controlled at 12.2‒12.5 m. When the water level of the Yangtze River rises sharply in the flood season, the Zongyang sluice will be closed to prevent river water from flowing backward.
In the Caizi Lake Basin, there are two hydrological stations, namely Shahebu in the upper reach of Dasha River and Zongyang sluice at the outlet of the basin. There is only one water level station (i.e., Chefuling) in the lake area. Anqing hydrological station is about 27 km away from the Zongyang sluice. The history and current hydrological data in this study were mainly obtained from the four hydrological stations mentioned above. Among them, the data collected by Chefuling station are mainly the monthly water level from 1989 to 2018, the daily water level and rainfall in 2018; the data of Zongyang sluice station include the daily water level in upstream and downstream of the sluice and the daily water flow in 2018; the data of Anqing and Shahebu stations are the daily water level and flow in 2018, respectively. The distribution of main water systems and hydrological stations around Caizi Lake is shown in Figure 1.
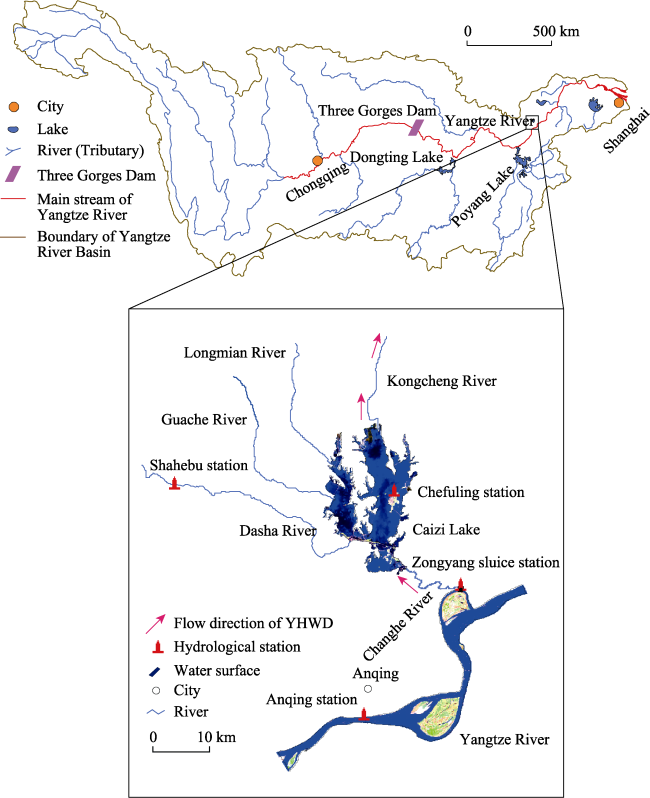
Figure 1 Location of the Caizi Lake

2.2 Methodology

Firstly, the time series analysis of the water level in Caizi Lake was carried out by trend lines, box plot and moving average to understand the characteristics of annual and inter-annual fluctuations of water levels. It is noted that for linear regression trend analysis, a positive slope indicates an increase in water level, while a negative slope represents a decrease in water level. In addition, box plots of water level in different periods can not only visually identify the abnormal values of data batches, but also reflect the trend and range of water level fluctuation in each stage. Secondly, Mann-Kendall (M-K) testing (Wang et al., 2012) and wavelet analysis were used to determine the water level mutation point and periodicity. Thirdly, the correlation among the water levels of Caizi Lake, Zongyang sluice (above and below the sluice) and Anqing station of the Yangtze River was investigated by Pearson correlation analysis. Finally, the impact of river-lake isolation on the change of water level in Caizi Lake was further detected.
Wavelet analysis is a method for time series problems with multiresolution time-domain (MRTD) technique. It can clearly reveal a variety of change periods hidden in the time series, and fully disclose the changing trend of the system in different temporal scales. At present, wavelet analysis is becoming a common tool for analyzing non-stationary time series in signal processing, seismic exploration, hydrometeorology and many other fields (Biswas et al., 2013; Liao et al., 2020). A wavelet is a wave-like oscillation with amplitude that begins at zero, increases, and then decreases back to zero. Common wavelet basis functions are Dmey, Haar, Daubechies, Meyer, Morlet, etc. In this study, the complex Morlet wavelet was selected, which is the most commonly used in hydrology (Lee and Kim, 2019), and can be defined as:
$\phi \text{(}t\text{)}={{e}^{-\frac{{{t}^{2}}}{2}}}\cdot {{e}^{i\cdot w\cdot t}}$
where w is a constant, and i is an imaginary number.
For the time series f(x)∈L2(R), the continuous wavelet transform (CWT) is:
${{W}_{f}}(a\text{, }b)=\left| a \right|{{}^{-\frac{1}{2}}}\int_{-\infty }^{+\infty }{f(t)\overline{\phi }}\frac{t-b}{a}\text{d}t$
where Wf(a, b) is the wavelet transform coefficient, a is a scale factor, which reflects the frequency-domain characteristics, b is a time factor, which reflects the time-domain characteristics, and $\bar{\phi }\text{(}t\text{)}$ is a complex conjugate function of$\phi \text{(}t\text{)}$. The wavelet coefficient curve can accurately identify the existence of the periodic component in hydrological sequences.
The wavelet variance reflects the strength of the fluctuation energy of hydrological elements, and its change with time scale can be used to determine the main period. The wavelet variance Var(a) is calculated as:
$\text{Var}(a)=\int_{-\infty }^{+\infty }{\left| {{W}_{f}}(a\text{, }b) \right|}{{}^{\text{2}}}\text{d}t$

3 Results

3.1 Temporal variations of water level

3.1.1 Annual variation characteristics
The multi-year averages of monthly water level in Caizi Lake fluctuated greatly with a single peak, showing an obvious seasonal flood-drought alternation (Figure 2). During a hydrological year, the water level of Caizi Lake can be generally divided into the following stages: dry season (December to March), rising season (April to May), flood season (June to September) and retreating season (October to November). The average water levels of these four periods were 8.95, 9.69, 12.29 and 10.35 m respectively. The average water level was 3.34 m higher in the flood season than that in the dry season. The rising or falling rates of water level were approximately 0.83 and 1.54 m/month in the rising and retreating periods, respectively. Caizi Lake water level had a large fall in a year, showing that the falling rate of water level in the retreating season was faster than the rising rate of water level in the rising season. This indicates that there were differences in the mechanism of the lake water level change for each hydrological season. The main reason is that during the rising period, the precipitation increased in the area, and the water levels of Caizi Lake and Anqing station of the Yangtze River rose. In this case, the Zongyang sluice discharged water. The Yangtze River water replenished the lake water and had a significant impact on the discharge of the lake until the arrival of the flood season. However, the basin needed to extract irrigation water from Caizi Lake during the retreating period since the regional rainfall decreased and the Zongyang sluice still discharged water.
The monthly minimum water level in Caizi Lake was 7.79 m in November 2008, with a monthly maximum water level of 16.18 m in July 1999. The average water levels in January (the lowest) and August (the highest) were 8.85 and 13.04 m, respectively. The box plot in Figure 2 shows that the monthly water level of the lake was much more stable in the dry season than those in the other seasons.
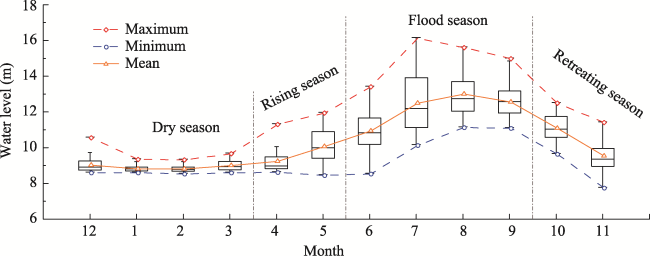
Figure 2 The box and whisker charts (showing maximum, 25 and 75th percentile, mean, median, minimum and/or outliers) of the monthly water level of Caizi Lake
3.1.2 Inter-annual variation characteristics
From 1989 to 2018, the annual average water level of Caizi Lake was 10.42 m, with the monthly highest, average and lowest water levels of 12.34‒14.10, 10.13‒10.76 and 8.65‒8.77 m (upper and lower quartile data), respectively. From Table 1, the slopes of linear fitting of the monthly highest, average water level, and water level in rising, flood and retreating seasons were negative, indicating a general decrease in water level. However, the slopes of linear fitting of the monthly lowest water level and water level in dry season were positive, showing a general increase in water level. Only the water level in dry season produced a P value less than 0.05 (Table 1).
Table 1 Linear regression tread analysis of the water levels in Caizi Lake from 1989 to 2018
Variables Regression equations P values
Monthly highest water level Z=‒0.002*t+16.955 0.951
Monthly average water level Z=‒0.009*t+29.313 0.328
Monthly lowest water level Z= 0.009*t‒10.089 0.053
Water level in dry season Z= 0.010*t‒11.965 0.006
Water level in rising season Z=‒0.027*t+62.996 0.065
Water level in flood season Z=‒0.023*t+59.135 0.288
Water level in retreating season Z=‒0.004*t+18.545 0.776

Note: Z denotes water level; t represents time

From the perspective of the month, the average water levels of each month basically showed distinct “high-low” cycles with the years. The water level in January and July showed a certain trend of rise and decline with the increase of the year, and further appeared the “up-down-up” and “down- up” change law after 5-year moving average, respectively (Figure 3). However, there was no significant change for the other months.
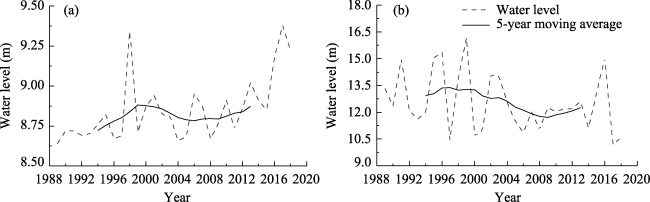
Figure 3 Variations of water level of Caizi Lake in January (a) and July (b)
3.1.3 Mutability and periodicity
The results of the M-K mutation testing for the monthly average water level of Caizi Lake showed that the UF and UB curves had 8 intersections, whereas the highest monthly water level had 12 intersections. In addition, the UF curve fluctuated around zero, which shows that the average and highest monthly water levels were very unstable in the past 30 years. No remarkable mutation was found for them. The lowest monthly water level appeared a weak downward trend before 1999, and then gradually increased from 2000 to 2011. Finally, it showed a rapid rise after 2012. It had only one mutation point at the 0.05 significance level (Figure 4). Further comparison with the results of sliding t-test, year 2013 could be identified as a significant mutation point of the monthly minimum water level.
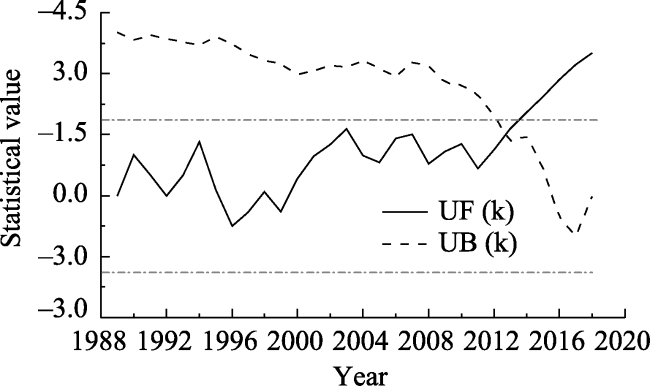
Figure 4 The result of M-K mutation testing on the monthly lowest water level of Caizi Lake. The horizontal dotted lines denote P < 0.05.
From Figure 5a, there are two obvious peaks at the period scales of 128 (the first main period scale) and 18 months (the second main period scale). Figure 5b further shows that the periodicity was the most obvious at the period scale of 128 months. Figure 5c shows that the oscillating period of water level change was approximately 80 months (i.e., 7 a) at a period scale of 128 month, with about 4 “up-down” cycles. At the 18-month period scale, the oscillating period of water level change was probably 12 months, with 29 “up-down” cycles.
Figure 5 Wavelet variance (a), wavelet coefficients as function of scales (b), and wavelet coefficients under 18 and 128-month period scales (c) for monthly water level time series of Caizi Lake

3.2 The influence of river-lake isolation on the water level in Caizi Lake

3.2.1 The hydrological relationship between Caizi Lake and Yangtze River
Table 2 lists the correlation coefficients between the water levels of the four hydrological stations and that in Caizi Lake. The correlation coefficient between the water levels of the sluice downstream and Anqing station was very high (r=0.996) in 2018 because the water flow below the Zongyang sluice was connected with the main stream of the Yangtze River. This indicates that the water level changes of the two stations were almost the same. Since the Changhe River upstream of the Zongyang sluice was connected with Caizi Lake, the fluctuation of the upper water level of the Zongyang sluice was similar to that of Chefuling in Caizi Lake (r=0.949). In addition, the correlation coefficient between the water level of Caizi Lake and that at Anqing station of the Yangtze River was 0.824. The correlation coefficients between the water levels of Caizi Lake and Anqing station in the dry, rising, flood, and retreating seasons in 2018 were 0.172, 0.735, 0.218 and 0.552, respectively (Figure 6).
Table 2 Correlation matrices of water level of the four hydrological stations in 2018
Station name All year round Dry season
Chefuling Anqing Sluice upstream Sluice downstream Chefuling Anqing Sluice upstream Sluice downstream
Chefuling 1 1
Anqing 0.824** 1 0.172 1
Sluice upstream 0.949** 0.871** 1 0.561** ‒0.033 1
Sluice downstream 0.845** 0.996** 0.885** 1 0.447** 0.923** 0.101 1

Note: Chefuling-Chefuling hydrological station; Anqing-Anqing hydrological station of the Yangtze River. **Correlation is significant at the 0.01 level (2-tailed)

3.2.2 Zongyang sluice discharge and water level changes in Caizi Lake
The characteristic water levels of Caizi Lake changed greatly before and after the completion of Zongyang sluice. Before the completion of the sluice, the lowest and highest water levels of the lake were 8.38 (February 24, 1958) and 17.96 (August 1, 1954) according to hydrological records of Anqing station, respectively. After the operation of Zongyang sluice, the lowest and highest water levels of the lake were 8.36 (April 23, 1983) and 17.29 (July 7, 2016), respectively. This implies that the operation of Zongyang sluice had better effect on the control of water level in flood season than that in dry season.
Figure 7 shows the water flow duration curves of the hydrological stations of Zongyang sluice and Shahebu in 2018. As can be seen from this figure, the release time of the Zongyang sluice gate was mainly from May to July (the average flow was 57.3 m3/s) and during the retreating period (from mid-September to mid-October), with the average flow 108.2 m3/s. During the main flood season from July to September, the sluice gate was closed most of the time. The gate was opened for a few days in order to let the water from the Yangtze River pour into the Changhe River, so as to alleviate the high water level of sluice downstream. To some extent, it explains the reason why the rising and retreating seasons of Caizi Lake lagged behind that of Anqing station of the Yangtze River, and the rising and falling rates of the water levels were slower as shown in Figure 6.
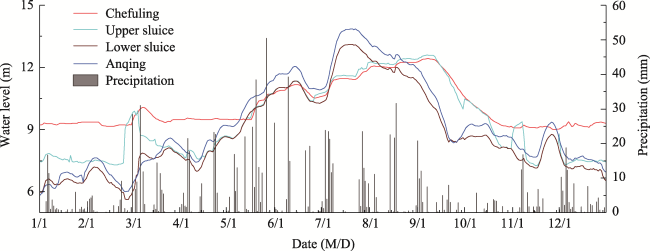
Figure 6 Daily water level of 4 hydrologic stations and precipitation of Caizi Lake in 2018
In 2018, the average flow of Shahebu station was 7.9 m3/s, which was relatively small and mainly concentrated from March to August, with a mean flow of 13.1 m3/s. From September 11 to October 7, 2018, Caizi Lake was in the retreating season with little rainfall. During this period, Zongyang sluice gate was opened for 27 consecutive days to release water, with an average flow of 153.5 m3/s, far exceeding the average discharge of Shahebu station (3.2 m3/s) in the same period. Table 3 shows that the runoff in the upper reach of Shahebu station accounted for about 20% of the total runoff in the Caizi Lake Basin, reflecting that the discharge of Zongyang sluice was much greater than runoff inflow into the lake in this period.
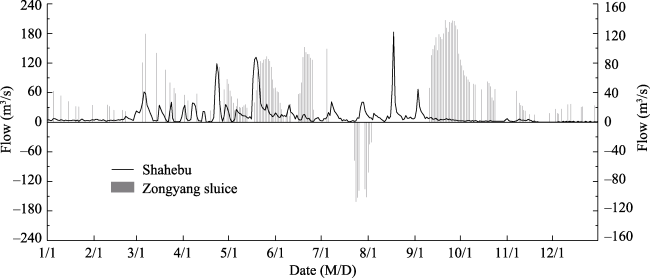
Figure 7 Flow duration curves for hydrological stations of Zongyang sluice and Shahebu in 2018. Negative values indicate that the water from the Yangtze River was poured into the Changhe River.
Table 3 Runoff of tributaries in the Caizi Lake Basin
Tributary name River length (km) Catchment area (km2) Annual
precipitation (mm)
Runoff
coefficient
Annual
runoff
(104 m3)
Average discharge of typical flood process (m3/s)
Dasha River Upper Shahebu 90.8 460 1421.4 0.60 38910 281.2
Lower Shahebu 936 1359.7 0.50 63634
Guache River 59.0 328 1358.0 0.50 22271 58.5
Longmian River 55.0 316 1324.8 0.50 20932 56.4
Kongcheng River 48.0 577 1312.8 0.50 37874 90.9
Lake area 217 1349.3 1.00 11553 57.6
Polder area 400 1353.7 0.40 21659 63.8
Total 252.8 3234 216833 608.4

Note: The average discharge of a typical flood process is derived from the rainfall data measured at various rainfall stations in the Caizi Lake Basin from June 19 to July 18, 1983

4 Discussion

4.1 Effect of river-lake isolation on natural variation of water level

In 1959, before the flood season, Zongyang sluice has been put into operation, which broke the connection of Caizi Lake with the Yangtze River. In fact, as a freshwater lake in the outflow region of China, the primary driving factor for the change in water level is the regional rainfall characteristics affected by monsoon (Qin and Xie, 2006). Figure 8 shows that the shapes, trends and inflection points of the variation curves of cumulative rainfall and cumulative increase in water level were similar. In addition, there was a good linear relationship (R2=0.992, P<0.01) between the cumulative rainfall and the cumulative increase in water level. This proves that precipitation played a dominant role in controlling the water level change of the lake. In Figure 5c, the water level of Caizi Lake presents a periodic “up and down” conversion, which indicates that the lake experienced frequent alternation of drying and wetting.
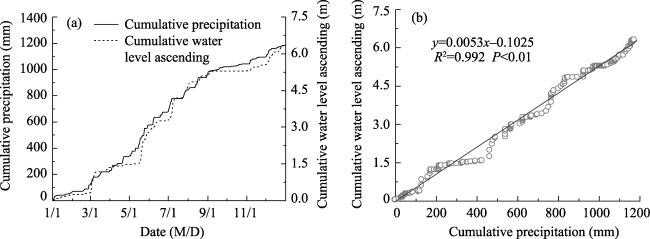
Figure 8 The relationship of cumulative increase in water level and cumulative precipitation of Caizi Lake in 2018
Historically, Caizi Lake was a river-connecting lake. Caizi Lake water level change should be basically consistent with the Anqing section of the Yangtze River (Zhang et al., 2015). But the correlation coefficients between the water levels of Caizi Lake and Anqing station were relatively low after the sluice was built (Table 2). This may be because the Anqing station of the Yangtze River was significantly affected by the upstream flow. At a certain water level, the Zongyang sluice gate was closed and the hydraulic connection between Anqing station and Chefuling station was cut off (Li et al., 2019). In this case, the water level changes of these two stations were not consistent. Although the overall trend of the water level duration curves in the rising and retreating periods were similar, the rising and retreating periods of Caizi Lake had a time lag of about one month compared with Anqing station as affected by the Zongyang sluice. Compared with the Anqing station of the Yangtze River, the water level of Caizi Lake rose more slowly and fluctuated less in flood season (Figure 6). The completion of Zongyang sluice is beneficial to the regulation of water storage capacity of Caizi Lake and the maintenance of the relatively stable water level during the dry season. During the past 30 years, the steady rise of the water level in Caizi Lake during the dry season (e.g. January) was found (Figure 3), which may be related to the increase of precipitation in the lower reach of the Yangtze River caused by global change (He et al., 2013). However, in a flood year, due to the high water level of the main stream of the Yangtze River, Zongyang sluice cannot be opened to discharge the flood for Caizi Lake. In case of frequent rainfall events in the region, the water level of Caizi Lake will continue to rise, which is likely to cause high water level, or even extreme value. This is the reason why the highest water level of Caizi Lake occurred in July 2016.

4.2 The water level of Caizi Lake is affected by both river-lake isolation and YHWD

Zongyang sluice has changed the river-lake relation, and has a great impact on the hydrological regime of Caizi Lake. Its eco-environmental effects are also complex. Except for the damage to the lake-river connectivity caused by the construction of the sluice, the continuous high water level of Caizi Lake caused by poor drainage during the flood period is the greatest risk at this stage. This can only be alleviated gradually by continuously strengthening the construction of water conservancy projects such as river reconstruction, dredging channels, digging ponds, repairing reservoirs and building dams in the entire basin. At present, YHWD is currently in full swing. The west line of the Yangtze-to-Chaohu Water Diversion Project, which is an important part of YHWD, will divert water from Zongyang gate to Caizi Lake, which would have a great influence on the water level in the dry season of Caizi Lake (Li et al., 2019). On the one hand, the long-term and large-scale water diversion during the dry season will significantly raise the water level of Caizi Lake, which will lead to the reduction of the wetland area and the destruction of the habitat of overwintering migratory birds. On the other hand, the period for water diversion is relatively short, so the water level of Caizi Lake will rise in a short period of time. According to the succession law of the lake area, the wetland will gradually sink, while the lake area will gradually become larger. This results in the aquatic vegetation becoming more and more dominant. Meanwhile, the upstream sediment will gradually accumulate. If the speed of wetland deposition is slower than that of sediment, the lake area will be reduced. Obviously, the change of hydrological regime in Caizi Lake is about to face a double influence from river-lake isolation and YHWD. In addition, the period scale of water level change was approximately 128 months in Caizi Lake. This may be partly explained by the fact that the period scale of precipitation variation was about 10 years in the middle and lower reaches of the Yangtze River during the last 50 years (Zheng et al., 2013). From 2018, the next 3‒4 years are likely to be the low water level period based on the wavelet analysis since the wavelet coefficients are changing from positive to negative (Figure 5c). This kind of “up-down” cycles may have some influence on the wetland ecosystems (Hu et al., 2010).
In order to understand the influence of YHWD on Caizi Lake, relevant departments and scholars have carried out some research work in this field, but it still seems very limited. Liu et al. (2019) showed that the daily average water level change rate during the overwintering period of migratory birds in Caizi Lake was ‒0.051 to 0.016 m/d, and the annual average rate was ‒0.034 to 0.009 m/d. Li et al. (2019) found that more than 20,000 wintering waterbirds of 49 species were recorded at Caizi Lake. Compared to the current situation, 54.3% of the grassland and 60.5% of the mudflats were predicted to be lost during winter due to expected water level rise. At present, the adaptive operation of Caizi Lake water level from November to next April during 2018-2023 is a targeted and important study for YHWD. From Figure 3a, the water level in the dry season has been rising during the past 30 years. However, according to the plan, after the operation of the YHWD project, the water level of Caizi Lake will be higher than that under natural condition (Wang et al., 2018a). In this case, the influence of water level rise in dry season should be considered in the optimal regulation of Caizi Lake water level by YHWD, and the relationship between water level and wetland ecological environment should be quantitatively evaluated in the future.

5 Conclusions

(1) The water level of Caizi Lake fluctuated greatly with a single peak, presenting a clearly flood-drought seasonal alternation. The difference between the average water level in flood and dry periods was 3.34 m. The water level fluctuated mainly in July, with the median of 12.19 m. The multi-year average annual water level was 10.42 m, with a stable monthly water level change. The average water levels of each month generally showed a “high-low” variation over years.
(2) During the past 30 years, the monthly average water level and the highest water level of Caizi Lake were extremely unstable. The year 2013 was an obvious mutation point of the monthly lowest water level. The first and second main periods of the water level time series were 128 and 18 months, respectively, with 4 and 29 “up-down” cycles, respectively. From 2018, the next 3‒4 years are likely to be the low water level period.
(3) The time lag of the current hydrological staging time of Caizi Lake was about 30 days due to river-lake isolation, which slowed down the rising and falling rates of the water level during the rising and retreating periods, respectively. Thus Caizi Lake was more prone to high water level or even extreme value in flood years.
(4) River-lake isolation caused by the construction of Zongyang sluice has become the most important limiting factor for the water level change of Caizi Lake during the past 60 years. In the near future, Caizi Lake is about to face a dual influence from river-lake isolation and YHWD.
1
Amoros C, Roux A L, 1988. Interactions between water bodies within floodplain of large rivers: Function and development of connectivity. Münstersche Geographische Arbeiten, 29: 125‒130.

2
Belete M, Diekkrüger B, Roehrig J, 2015. Characterization of water level variability of the main Ethiopian rift valley lakes. Hydrology, 3(1): 1‒14. doi: 10.3390/hydrology3010001.

DOI

3
Biswas A, Cresswell, H P, Viscarra Rossel R A et al., 2013. Characterizing scale- and location-specific variation in non-linear soil systems using the wavelet transform. European Journal of Soil Science, 64: 706‒715.

DOI

4
Dai B G, Jiang Z G, Wang C et al., 2019. Abundance-based dissimilarity measurements reveal higher heterogeneity of fish communities in the lotic habitats of the Yangtze-Caizi transitional floodplain. Ecological Indicators, 112:106122. doi: 10.1016/j.ecolind.2020.106122.

DOI

5
Dai X, Wang R R, Yang G S, 2015. Non-stationary water-level fluctuation in China’s Poyang Lake and its interactions with Yangtze River. Journal of Geographical Sciences, 25(3): 274‒288.

DOI

6
Dai X, Yang G S, Wang R R et al., 2018. The effect of the Changjiang River on water regimes of its tributary Lake East Dongting. Journal of Geographical Sciences, 28(8): 1072‒1084.

DOI

7
Evtimova V V, Donohue I, 2016. Water-level fluctuations regulate the structure and functioning of natural lakes. Freshwater Biology, 61(2): 251‒264. doi: 10.1111/fwb.12699.

DOI

8
He S Q, Zheng Y F, Yin J F, 2013. An analysis on precipitation characteristics over middle and lower reaches of Yangtze River in the last 50 years. Ecology and Environmental Sciences, 22(7): 1187‒1192. (in Chinese)

9
Hu Z P, Ge G, Liu C L et al., 2010. Structure of Poyang Lake wetland plants ecosystem and influence of lake water level for the structure. Resources and Environment in the Yangtze Basin, 19(6): 597‒605. (in Chinese)

10
Hu Y X, Huang J L, Du Y et al, 2015. Monitoring wetland vegetation pattern response to water-level change resulting from the Three Gorges Project in the two largest freshwater lakes of China. Ecological Engineering, 74: 274‒285. doi: 10.1016/j.ecoleng.2014.10.002.

DOI

11
Jiang Z G, Xu N, Liu B X et al., 2018. Metal concentrations and risk assessment in water, sediment and economic fish species with various habitat preferences and trophic guilds from Lake Caizi, Southeast China. Ecotoxicology and Environmental Safety, 157: 1‒8.

DOI

12
Lee E, Kim S, 2019. Wavelet analysis of soil moisture measurements for hillslope hydrological processes. Journal of Hydrology, 575: 82‒93.

DOI

13
Li C L, Li H F, Zhang Y et al., 2019. Predicting hydrological impacts of the Yangtze-to-Huaihe Water Diversion Project on habitat availability for wintering waterbirds at Caizi Lake. Journal of Environmental Management, 249:109251. doi: 10.1016/j.jenvman.2019.07.022.

DOI

14
Liao K, Liu Y, Zhu Q, 2020. Spatio-temporal variation of near-surface soil water content in China from 1988 to 2016. Soil Use and Management, doi: 10.1111/sum.12600-2020-005.

DOI

15
Liu X Q, Wang H Z, 2010. Estimation of minimum area requirement of river-connected lakes for fish diversity conservation in the Yangtze River floodplain. Diversity and Distributions, 16: 932‒940.

DOI

16
Liu X W, Li H Q, Yang Y Q et al., 2019. Water level characteristics of Lake Caizi, lower reaches of the Yangtze Rriver during wintering period based on long-term hydrological alteration. Journal of Lake Sciences, 31(6): 1662‒1669. (in Chinese)

DOI

17
Lockhart C, Austin D F, Aumen N G, 1999. Water level effects on growth of Melaleuca seedlings from Lake Okeechobee (Florida, USA) littoral zone. Environmental Management, 23: 507‒518.

DOI

18
Lytle D A, Poff N L, 2004. Adaptation to natural flow regimes. Trends in Ecology & Evolution, 19(2): 94‒100.

DOI

19
Pan B Z, Wang H J, Liang X M et al., 2011. Macrozoobenthos in Yangtze floodplain lakes: Patterns of density, biomass, and production in relation to river connectivity. Journal of the North American Benthological Society, 30: 589‒602.

DOI

20
Qin B Q, Xie P, 2006. Nutrient cycling, loading and eutrophication in lakes from middle and lower reaches of Yangtze River. Sciences in China (Series D), 49 (Suppl. I): 1‒202.

21
Wang H Q, Zhang M S, Zhu H et al., 2012. Hydro-climatic trends in the last 50 years in the lower reach of the Shiyang River Basin, NW China. CATENA, 95: 33‒41.

DOI

22
Wang X M, Ou F P, Wang C M et al., 2016a. Long-term evolution and influencing factors of macrozoobenthos in Dongting Lake. Journal of Agro-environment Science, 35(2): 336‒345. (in Chinese)

23
Wang H Z, Liu X Q, Wang H J, 2016b. The Yangtze River floodplain: Threats and rehabilitation. American Fisheries Society Symposium, 84: 263‒291.

24
Wang H Z, Liu X Q, Wang H J, 2019. The Yangtze River-floodplain ecosystem: Multiple threats and holistic conservation. Acta Hydrobiologica Sinica, 43(Suppl.): 157‒182. (in Chinese)

25
Wang X Y, Jiang B, Tian Z F et al., 2018a. Impact of water level changes in Lake Caizi (Anhui Province) on main wetland types and wintering bird habitat during wintering period. Journal of Lake Sciences, 30(6): 1636‒1645. (in Chinese)

DOI

26
Wang Z, Fan Z Y, Yang Z Y et al., 2018b. Effects of water diversion project from the Yangtze River to Huaihe River on the water age distribution of Lake Caizi, Anhui province. Journal of Lake Sciences, 30(6): 1576‒1586. (in Chinese)

DOI

27
Wantzen K M, Rothhaupt K O, Moertl M et al., 2008. Ecological effects of water-level fluctuations in lakes: An urgent issue. Hydrobiologia, 613: 1‒4. doi: 10.1007/s10750-008-9466-1.

DOI

28
Ward J V, 1989. The four-dimensional nature of lotic ecosystems. Journal of the North American Benthological Society, 8(1): 2‒8.

DOI

29
Wrzesiński D, Ptak M, 2016. Water level changes in Polish lakes during 1976‒2010. Journal of Geographical Sciences, 26(1): 83‒101.

DOI

30
Zhang Q, Ye X C, Werner A D et al., 2014. An investigation of enhanced recessions in Poyang Lake: Comparison of Yangtze River and local catchment impacts. Journal of Hydrology, 517: 425‒434.

DOI

31
Zhang X K, Liu X Q, Wang H Z, 2015. Effects of water level fluctuations on lakeshore vegetation of three subtropical lakes, China. Hydrobiologia, 747(1): 43‒52.

DOI

32
Zheng Y F, He S Q, Yin J F, 2013. An analysis on precipitation characteristics over middle and lower reaches of Yangtze River in the last 50 years. Ecology and Environmental Sciences, 22(7): 1187‒1192. (in Chinese)

Outlines

/