Research Articles

Spatial variation and driving mechanism of soil organic carbon components in the alluvial/sedimentary zone of the Yellow River

  • LI Guodong 1, 2 ,
  • ZHANG Junhua , 1, 2, * ,
  • ZHU Lianqi 1, 2 ,
  • TIAN Huiwen 1, 2 ,
  • SHI Jiaqi 1, 2 ,
  • REN Xiaojuan 1, 2
Expand
  • 1. Key Laboratory of Geospatial Technology for the Middle and Lower Yellow River Regions (Henan University), Ministry of Education, Kaifeng 475004, Henan, China
  • 2. College of Environment and Planning, Henan University, Kaifeng 475004, Henan, China
Zhang Junhua, Professor, E-mail:

Li Guodong, Associate Professor, specialized in land surface processes and environmental change. E-mail:

Received date: 2020-12-08

  Accepted date: 2021-01-28

  Online published: 2021-06-25

Supported by

National Natural Science Foundation of China, No(41101088)

National Natural Science Foundation of China, No(U1404401)

Natural Science Foundation of Henan Province, No(182300410129)

New Interdisciplinary and Characteristic Subject Cultivation Project of Henan University, No(XXJC20140003)

Copyright

Copyright reserved © 2021. Office of Journal of Geographical Sciences All articles published represent the opinions of the authors, and do not reflect the official policy of the Chinese Medical Association or the Editorial Board, unless this is clearly specified.

Abstract

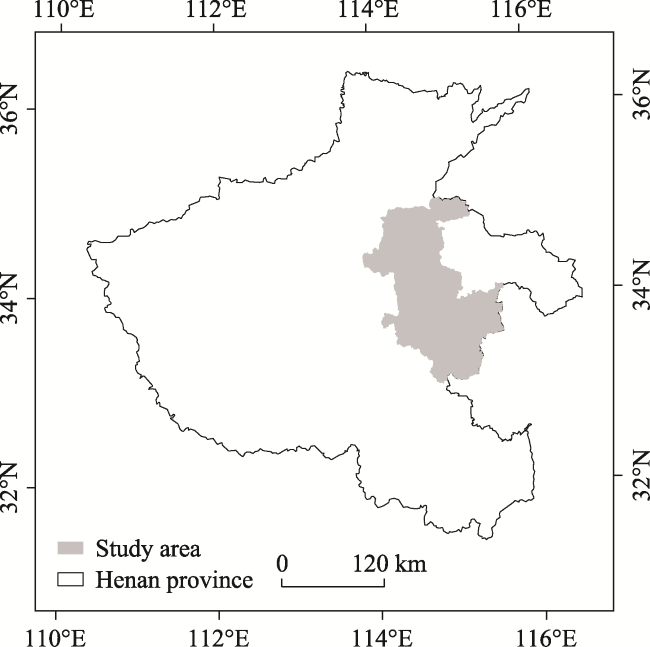
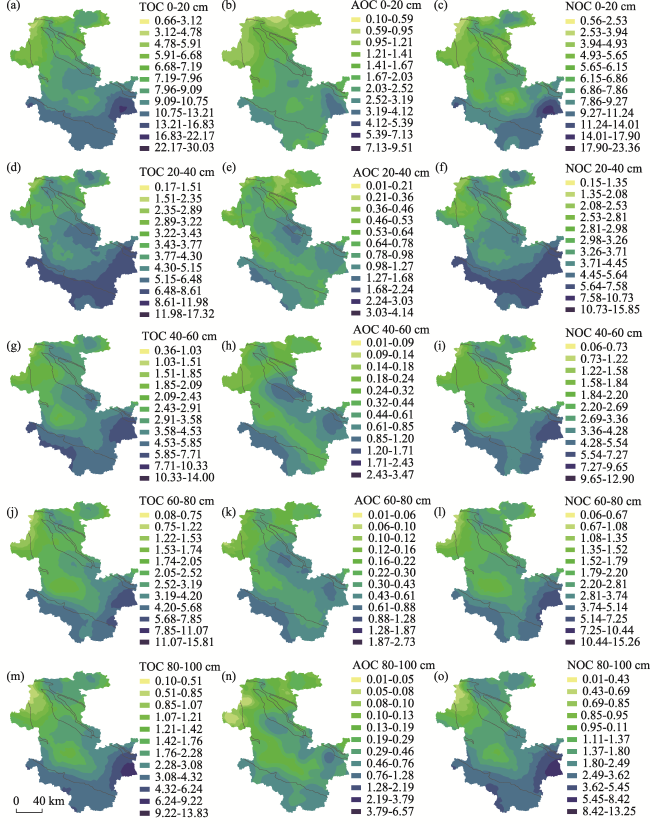
Alluviation and sedimentation of the Yellow River are important factors influencing the surface soil structure and organic carbon content in its lower reaches. Selecting Kaifeng and Zhoukou as typical cases of the Yellow River flooding area, the field survey, soil sample collection, laboratory experiment and Geographic Information System (GIS) spatial analysis methods were applied to study the spatial distribution characteristics and change mechanism of organic carbon components at different soil depths. The results revealed that the soil total organic carbon (TOC), active organic carbon (AOC) and nonactive organic carbon (NOC) contents ranged from 0.05-30.03 g/kg, 0.01-8.86 g/kg and 0.02-23.36 g/kg, respectively. The TOC, AOC and NOC contents in the surface soil layer were obviously higher than those in the lower soil layer, and the sequence of the content and change range within a single layer was TOC>NOC>AOC. Geostatistical analysis indicated that the TOC, AOC and NOC contents were commonly influenced by structural and random factors, and the influence magnitudes of these two factors were similar. The overall spatial trends of TOC, AOC and NOC remained relatively consistent from the 0-20 cm layer to the 20-100 cm layer, and the transition between high- and low-value areas was obvious, while the spatial variance was high. The AOC and NOC contents and spatial distribution better reflected TOC spatial variation and carbon accumulation areas. The distribution and depth of the sediment, agricultural land-use type, cropping system, fertilization method, tillage process and cultivation history were the main factors impacting the spatial variation in the soil organic carbon (SOC) components. Therefore, increasing the organic matter content, straw return, applying organic manure, adding exogenous particulate matter and conservation tillage are effective measures to improve the soil quality and attain sustainable agricultural development in the alluvial/sedimentary zone of the Yellow River.

Cite this article

LI Guodong , ZHANG Junhua , ZHU Lianqi , TIAN Huiwen , SHI Jiaqi , REN Xiaojuan . Spatial variation and driving mechanism of soil organic carbon components in the alluvial/sedimentary zone of the Yellow River[J]. Journal of Geographical Sciences, 2021 , 31(4) : 535 -550 . DOI: 10.1007/s11442-021-1857-5

1 Introduction

As the main part of terrestrial ecosystem carbon pools, the soil carbon pool is an important carbon source and sink on Earth and plays a dual role in climate change regulation (Belay-Tedla et al., 2009). The soil organic carbon (SOC) accounts for two-thirds of the soil carbon pool (Zhu et al., 2015), and it is 2-3 times the vegetation carbon pool. Slight fluctuations occur in the SOC content, and it is one of the most important factors influencing the CO2 content in the atmosphere, soil nutrient release, biological growth and grain yield. Therefore, the sequestration and change mechanism of SOC is a key ecological process and active research field at present. The change process and influence mechanism of SOC have received much attention in regional ecosystem research (Yao and Kong, 2018). Increasing the SOC content has become a core issue in response to climate change, food production safety and sustainable regional development.
SOC affects the supply and turnover processes of life substances and the level of soil fertility and plays an important role in the regulation of the function (Greiner et al., 2017; Drobnik et al., 2018) and structural stability of the soil ecosystem (Wang and Zhang, 2016; Chai et al., 2019; Liu et al., 2019). Organic carbon mainly stems from different tissues of plants, organic fertilizer application, and remains and secretions of soil animals and microorganisms. The decomposition process of organic carbon is affected by the combined effects of microorganisms and various environmental factors. Due to the heterogeneity of material sources and difference in the turnover rate, the content, stability characteristics, sequestration effects and ecological processes of different organic carbon components are distinct. The nonactive organic carbon (NOC) suitably represents the accumulation and storage capacity of SOC, but the proportion of the active organic carbon (AOC) content is low. AOC reflects the short-term variation and the SOC components directly participating in the soil biochemical process (Zhu et al., 2018). AOC is the preferred index reflecting soil environmental changes and biological activities (Laik et al., 2009; Pu et al., 2017), which has become the focus of attention in soil science and related disciplines. At present, the study of the SOC components focuses on content distribution, spatio-temporal characteristics and variation mechanisms, thereby concentrating on typical sample plots on a point scale and representative regions on a large spatial scale (Xu et al., 2018). These two research scales exhibit their own focus aspects and advantages. The former focuses on the long-term dynamic characteristics and change process of organic carbon components (Xu et al., 2017; Chatterjee et al., 2018; Donato et al., 2018), mostly relies on field experimental stations and emphasizes the morphological and structural characteristics of substances and biological process at the microcosmic level, while the associated testing cost is high, testing is time consuming, and the sample size is small. The latter employs geostatistical and GIS spatial analysis methods to study the spatial heterogeneity of SOC (Kumar et al., 2013; Jia et al., 2014; Wu et al., 2016; Du et al., 2018; Li et al., 2018), the corresponding test method is simple and easy to implement, the sample size is large, and the dynamic relations between land surface processes and soil properties are elucidated. There are few studies on component testing and spatial variability for a large number of samples because they have been limited by the testing process, method and sample storage conditions, and more studies have focused on the soil total organic carbon (TOC). Studies on the spatial variability of the SOC components may help to reveal the mechanism of organic carbon variation, expand existing point-scale studies, and enrich organic carbon research on a large scale.
Frequent flooding of the Yellow River is the formation source of the landform types in the lower reaches of the Yellow River, and erosion and sedimentation have caused notable changes in surface soil properties. The lower Yellow River basin is an important grain production area in China, and sandy soil impacts the SOC content during the land use process (Gao et al., 2015; Li et al., 2017; Xu et al., 2017). Moreover, the contradiction between high-intensity agricultural output and soil quality improvement is stark. Hence, appropriate management measures should be adopted to improve the soil quality. The typical regions of Kaifeng and Zhoukou affected by flooding of the Yellow River were selected in this study, and spatial analysis methods were adopted to study the spatial distribution characteristics and change mechanism of organic carbon components at different depths. This research provides scientific evidence for the SOC improvement, soil quality enhancement and sustainable development of regional agriculture.
Figure 1 Location of the study area (Kaifeng and Zhoukou, Henan Province, China)

2 Data and methods

2.1 Study area

The study area is located in the Eastern Henan Plain in Henan Province, China (Figure 1), and it is administratively subordinate to Kaifeng and Zhoukou cities. The geomorphology of the study area is dominated by the large alluvial fan of the Yellow River, the terrain is flat, and the altitude is between 40 and 100 m. The climate of the study area is a warm temperate continental monsoon climate, the annual average temperature is 14.6°C, the annual average precipitation reaches 645 mm, and the annual average frost- free period lasts 220 days. Superior climate conditions, including abundant sunlight, moderate temperature, simultaneous solar irradiation and precipitation and good hydrothermal conditions, facilitate the development of the planting industry, forestry and fruit industry. As a major grain-producing area, the potential for agricultural development is high.
The Yellow River is the second largest river in China, and it is also well known worldwide for its high sediment concentration. Beyond the point where the Yellow River flows into the North China Plain from the Loess Plateau, the river channel gradually widens, the vertical gradient sharply declines, and sediments are commonly displaced by river water and deposited (Li et al., 2010). The Yellow River sediment yields a profound impact on the soil in the North China Plain, and thousands of floods and diversions of the Yellow River have caused serious disasters in the lower reaches in the past, while the Yellow River carries a large amount of sediment and scours the land surface, leading to a decline in soil fertility. The soil type is mainly sandy soil, and sandy soil, loam and clay exhibit a mosaic distribution pattern (Meng et al., 1998). The soil layer is thick, the parent material is fluvial sediment during different periods, and on this basis, certain soil types, such as moist soil, aeolian sandy soil, saline soil and alluvial soil, have been formed. The land-use types in eastern Henan largely included farmland, woodland, grassland, waters, construction land, and unused land in 2015 (Figure 2). The proportions of cultivated and residential land areas in the total area were high, at 75.88% and 21.40%, respectively. The proportions of woodland and water areas were 1.31% and 1.41%, respectively, and the total proportion of grassland and unused land only reached 0.002%. The study area is a typical dry farming area in China, and agricultural planting primarily focuses on wheat, corn, peanuts, watermelon, cotton and vegetables. Considering the land-use type and effect magnitude of the Yellow River sediment, representative land-use types, including farmland, woodland and unused land, were selected to collect soil samples in this study.
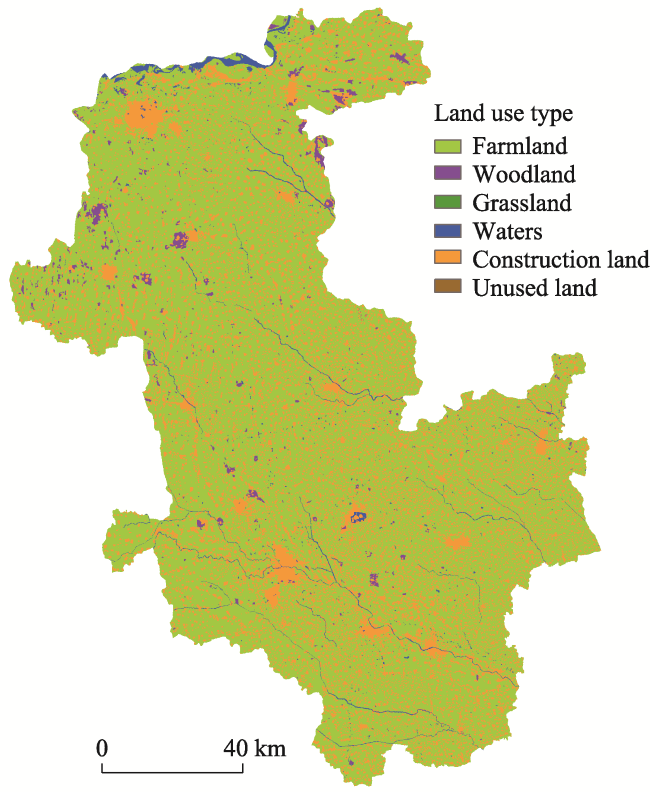
Figure 2 Land-use types in Kaifeng and Zhoukou in 2015

2.2 Soil sampling and laboratory experiment

The grid method was adopted as the soil sample collection method in this study. Referencing the topographic map and land-use type map of the study area, the spatial locations of the sampling points were established. Based on a 10 km×10 km grid as a sampling point and considering the land-use type, planting pattern, fertilization method, soil type, planting history, traffic accessibility, field sampling conditions, etc., these preset sampling points were adjusted. The sampling depth was 100 cm, the sampling interval was 20 cm in the profile, and the total number of sampling points was 283, as shown in Figure 3. After the samples were dried and screened indoors, various indices were measured. The TOC was measured via the oil bath heating method (K2Cr2O7 volumetric method) (Huo and Li, 1986), the AOC was measured via the KMnO4 oxidation method (Loginow et al., 1987; Lefroy et al., 1993), and the difference between TOC and AOC contents was the NOC content. The soil particle diameter was measured with a laser particle size analyzer (Malvern Mastersizer 3000, UK) (Zhang et al., 2012).
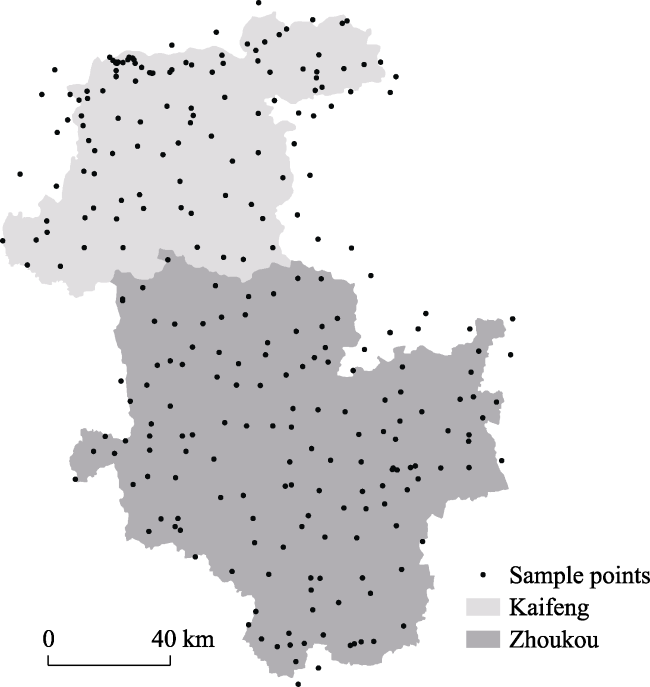
Figure 3 Sampling points in Kaifeng and Zhoukou

2.3 Data analysis method

The normal distribution test, elimination of abnormal values, parameter selection of the semivariance function, selection of the spatial interpolation method, trend effect analysis, and spatial distribution plotting were conducted with GS+9 and ArcGIS10.1 software. The ordinary kriging interpolation method was implemented to simulate the spatial distribution, semivariance function eigenvalues were calculated, and the optimal model was selected. The cross-validation method was applied to test the result and prediction accuracy of different interpolation methods. The mean error (ME), average standard error (ASE), root mean square error (RMSE), mean square error (MSE) and root mean square standard error (RMSSE) were considered to evaluate the fitting accuracy of the models, as expressed by the following equations:
$ME=\frac{1}{n}\sum\limits_{i=1}^{n}{[Z\text{(}{{x}_{i}}\text{)}-{{Z}^{*}}\text{(}{{x}_{i}}\text{)}]}$
$RMSE=\sqrt{\frac{1}{n}\sum\limits_{i=1}^{n}{{{[Z\text{(}{{x}_{i}}\text{)}-{{Z}^{*}}\text{(}{{x}_{i}}\text{)}]}^{2}}}}$
$ASE=\sqrt{\frac{\sum\limits_{i=1}^{n}{{{\sigma }^{\text{2}}}({{x}_{i}})}}{n}}$
$MSE=\frac{1}{n}\sum\limits_{i=1}^{n}{\frac{\left[ Z({{x}_{i}})-{{Z}^{*}}({{x}_{i}}) \right]}{\sigma ({{x}_{i}})}}$
$RMSSE=\sqrt{\frac{1}{n}\sum\limits_{i=1}^{n}{{{\left[ \frac{Z({{x}_{i}})-{{Z}^{*}}({{x}_{i}})}{\sigma ({{x}_{i}})} \right]}^{2}}}}$
where Z(xi) is the observed value, Z*(xi) is the estimated value, and σ(xi) is the estimated standard variance of point xi.

3 Results and analysis

3.1 Content characteristics of the SOC and its components

The TOC, AOC and NOC contents at depths ranging from 0-100 cm were 0.05-30.03 g/kg, 0.01-8.86 g/kg and 0.02-23.36 g/kg, respectively. Analyzing the content and amplitude (Table 1), all soil layers followed the order of TOC>NOC>AOC, and the mean values gradually decreased with increasing soil depth. The standard deviation and variance in the TOC, AOC and NOC in the soil surface layer (0-20 cm) were higher than those below 20 cm, which demonstrated that the contents of TOC, AOC and NOC exhibited the maximum variability in the surface layer, and the variability gradually decreased with increasing soil depth. In comparison, the change range and content difference of the TOC in the same soil layer were the largest, those of the AOC were the smallest, and those of the NOC were moderate. The proportion of the AOC in the TOC at depths from 0-20 cm reached a maximum value of 19.75%, and the proportion declined with increasing soil depth, between 15.74% and 11.28%. However, the proportion of the NOC in the TOC was low in the surface layer and high in the deeper layers, and its change characteristics were the opposite to those of the AOC. These results demonstrate that decomposition of the organisms in the soil surface layer is conducive to the conversion of organic carbon, thus increasing the content and proportion of the AOC and decreasing the NOC content.
Table 1 Statistical characteristics of the SOC at different depths (g/kg)
Indicator Depth (cm) Range Minimum Maximum Mean Variance Skewness Kurtosis
TOC 0-20 28.78 1.25 30.03 8.96±4.31 18.62 0.99 2.44
20-40 16.72 0.59 17.32 5.08±2.87 8.24 1.12 1.81
40-60 13.60 0.40 14.00 3.88±2.50 6.25 1.01 1.19
60-80 15.73 0.08 15.81 3.08±2.24 5.02 1.56 4.64
80-100 13.78 0.05 13.83 2.57±2.12 4.50 1.66 4.34
AOC 0-20 8.75 0.11 8.86 1.77±1.07 1.15 1.70 8.52
20-40 3.47 0.01 3.48 0.80±0.62 0.38 1.19 1.84
40-60 1.98 0.01 2.00 0.51±0.43 0.19 0.97 0.31
60-80 1.49 0.01 1.50 0.37±0.34 0.12 1.00 0.15
80-100 1.42 0.01 1.42 0.29±0.29 0.08 1.39 1.74
NOC 0-20 22.75 0.61 23.36 7.19±3.48 12.13 0.95 1.98
20-40 15.27 0.58 15.85 4.28±2.49 6.25 1.30 2.52
40-60 12.89 0.01 12.90 3.34±2.22 4.95 1.14 1.87
60-80 15.20 0.06 15.26 2.76±2.02 4.07 1.86 6.96
80-100 13.23 0.02 13.25 2.25±1.94 3.75 1.87 5.82

3.2 Spatial variability characteristics of the SOC and its components

3.2.1 Geostatistical characteristics of the organic carbon and its components
GS9+ was employed to calculate the semivariance function eigenvalues and select the optimal model at different levels of the TOC, AOC and NOC. According to the criteria of model determination coefficient (R2) maximization and residual error (RSS) minimization, the optimal fitting parameters of the organic carbon spatial distribution were determined, as listed in Table 2. Two fitting models were considered: exponential (E) and Gaussian (G).
C/C0+C reflects the proportion of the spatial heterogeneity caused by autocorrelation in the total spatial heterogeneity and indicates the interaction between random and structural factors. The influences of structural factors, such as the climate, parent material, terrain and soil, result in spatial variables exhibiting a notable spatial correlation, and random factors, such as fertilization and cultivation, cause a decrease in spatial correlation. The nugget coefficients of the TOC, AOC, and NOC were between 0.50 and 0.67, and they exhibited a moderate spatial correlation. The nugget coefficients fluctuated around 0.50, which indicates that the intensities of the natural and human factors were similar.
The fractal dimension indicates the influence degree of random factors on the organic carbon and spatial distribution patterns, and a low value of the fractal dimension indicates that the organic carbon is less affected by random factors and exhibits a good spatial structure and a relatively simple spatial distribution. With increasing soil profile depth, the fractal dimensions of the TOC and NOC gradually decreased, but the fractal dimension of the TOC increased, demonstrating that the TOC and NOC of the topsoil were relatively more affected by random factors and attained weak spatial structures and complex spatial distributions. In contrast, the TOC and NOC of the deeper soil layers were relatively less affected by random factors and attained good spatial structures and relatively simple spatial distributions. The fractal dimension of the AOC differed from that of the TOC and NOC, the fractal dimension of the AOC in the soil surface layer (0-20 cm) was the lowest, while the fractal dimension of the AOC from 20-40 cm was the highest, which may be the combined result of random factors and AOC activity. Since the downward mobility of the AOC is typically higher than that of the TOC and NOC, the fractal dimensions of the AOC in the middle and lower layers were higher than those in the 0-40 cm interval.
Table 2 Fitting model and parameters of the SOC semivariance function
Depth (cm) Indicator Model Nugget (C0) Sill
(C0+C)
Range (A0) Nugget coefficient (C/C0+C) Decision coefficient (R2) Residual (RSS) Fractal dimension (D)
0-20 TOC E 10.91 27.56 6.52 0.60 0.91 8.37 1.92
AOC E 0.72 1.41 1.55 0.50 0.83 0.08 1.91
NOC E 6.95 14.79 4.04 0.53 0.90 3.92 1.92
20-40 TOC E 4.56 13.28 9.03 0.66 0.93 1.11 1.92
AOC E 0.71 1.43 1.55 0.50 0.83 0.08 1.96
NOC E 3.36 9.79 7.73 0.67 0.93 0.70 1.91
40-60 TOC E 2.92 6.31 3.21 0.54 0.95 0.46 1.91
AOC E 0.11 0.22 0.78 0.50 0.86 0.00 1.93
NOC E 2.27 4.68 2.51 0.52 0.92 0.44 1.91
60-80 TOC E 2.18 5.06 3.35 0.57 0.94 0.38 1.90
AOC E 0.10 0.20 0.66 0.50 0.85 0.00 1.94
NOC G 1.81 3.62 1.23 0.50 0.93 0.35 1.89
80-100 TOC G 1.86 3.72 0.97 0.50 0.93 0.49 1.89
AOC E 0.08 0.22 0.39 0.63 0.68 0.00 1.94
NOC G 1.53 3.07 0.89 0.50 0.90 0.46 1.88
3.2.2 Spatial variation characteristics of the organic carbon and its components
The spatial trend effects of the TOC, AOC and NOC contents in each layer of the soil profile were analyzed. No trend effect (zero order), variables with a linear trend along a certain direction (first order) and variables with a polynomial trend along a certain direction (second order) were selected. Table 3 summarizes the parameters of the various semivariance function fitting models. Based on the data, the absolute value of the ME was close to 0, the RMSE and MSE were the smallest, the ASE and RMSE values were similar, the RMSSE approached 1, and the SOC spatial distribution was simulated. The spatial trend of AOC in the 20-40 cm and 80-100 cm layers has zero order effect, and the others have first order effect. Table 3 lists the simulation errors of the TOC, AOC and NOC in each layer.
Table 3 Simulation error of spatial distribution of the SOC components
Depth (cm) Indicator ME RMSE ASE MSE RMSSE
0-20 TOC 0.02 3.50 3.50 0.01 0.99
AOC 0.01 0.99 0.87 0.01 1.13
NOC 0.00 2.83 2.81 0.00 1.01
20-40 TOC 0.01 2.28 2.27 0.01 1.01
AOC 0.01 0.56 0.58 0.02 0.95
NOC 0.00 1.99 1.95 0.01 1.02
40-60 TOC 0.04 1.89 1.81 0.00 1.04
AOC 0.00 0.38 0.33 0.01 1.15
NOC 0.00 1.69 1.59 0.00 1.06
60-80 TOC 0.00 1.70 1.62 0.00 1.07
AOC 0.00 0.33 0.27 0.00 1.20
NOC 0.01 1.57 1.38 -0.01 1.14
80-100 TOC -0.02 1.50 1.40 -0.01 1.09
AOC 0.02 0.41 0.39 0.01 1.11
NOC -0.01 1.40 1.27 -0.01 1.11
The content classification of the TOC, AOC and NOC trends is shown in Figure 4. The spatial difference and amplitude in the 0-20 cm layer was the largest, and the range of the TOC, AOC and NOC contents narrowed with increasing depth. The AOC variation was the lowest, the TOC variation was the highest, and the NOC variation was moderate. At the spatial level, the high-value areas of the TOC, AOC and NOC were located in the southwest and southeast of Zhoukou and the junction zone of Zhoukou and Shangqiu. The low-value areas of the TOC, AOC and NOC were located in the west of Kaifeng. The contents of the TOC, AOC and NOC gradually increased from northwest (low value) to southeast (high value). From Kaifeng to Lankao, the contents of the TOC, AOC and NOC were between the observed highest and lowest values.
Figure 4 Spatial distribution of the TOC, AOC and NOC at different depths (g/kg)
From the 0-20 cm layer to the 20-100 cm layer, the overall spatial trends of the TOC and NOC were relatively consistent, the AOC variance was consistent with that of the TOC and NOC in 0-20 cm surface layer, and the AOC trend in each layer from 20-100 cm was consistent and differed from that in the 0-20 cm layer, which indicated that the transition between the high-value areas and low-value areas was obvious and that the spatial variance was high. The area enclosed by the black line in Figure 4 is the flooded area of the Yellow River after the Huayuankou embankment burst in 1938, and agricultural production recovered after the Yellow River diversion in 1945. The contents of the TOC, AOC and NOC in the flooded area were lower than those in the surrounding area. The TOC, AOC and NOC contents were the lowest in the burst-affected area between Zhengzhou and Kaifeng, and the contents gradually increased along the direction of water flow. In the vertical profile, the difference and amplitude of the SOC content in each layer showed a trend of TOC>NOC>AOC, the contribution of the NOC content to the TOC was higher than that of the AOC content, and the AOC content better reflected the TOC variation. The contents and spatial distributions of the AOC and NOC better represented the TOC spatial variation and carbon accumulated areas.
3.2.3 Influencing factors of the spatial distribution of the SOC and its components
The SOC is a complex compound consisting of both soil animal and plant residues and soil particles under the comprehensive effect of multiple factors in the process of land use. The content and distribution of different SOC components are jointly affected by the land-use type, land use pattern, tillage mode, planting type, soil texture and climate. The analysis results indicated that the spatial differences in regional temperature and precipitation were small and imposed little influence on the SOC. Agricultural irrigation water is mainly extracted from groundwater or Yellow River water. In the aspect of the land-use type, cultivated land accounted for 75.88% of the area, and the percentages of woodland, grassland and unused land were low, so the agricultural land pattern, planting type and tillage process were the main factors influencing the SOC spatial variation in the region.
The study area has historically been seriously affected by the sediment of the Yellow River, which is composed of the Yellow River flooding area, the ancient course of Yellow River and the area relatively less affected by sedimentation. In the Yellow River flooding area, the organic carbon content is the lowest in the area between Zhengzhou and Kaifeng, which is related to the flow velocity, sediment particle size, sediment thickness and spatial distribution after the Yellow River burst. Fine sand and coarse sand are the main sediments, which exhibit fan-shaped distributions, while clay and silt are deposited in the river (Huang and Wang, 1954). From the aforementioned area to the southeast of Zhoukou, the alluvial/sedimentary thickness gradually thinned and was between 1 and 5 m (Li et al., 1991), and the spatial distribution trend exhibited fragmentation and decentralization characteristics. The contents of the TOC, AOC and NOC presented a decreasing spatial trend in the process of land use. The ancient course of Yellow River during the Ming and Qing dynasties is another area where the sediment of the Yellow River affected the spatial distribution of the organic carbon, located in Lankao in the northeastern part of the study area. Agricultural production in the study area resumed when the Yellow River flowed through Lankao to Shandong and reached the sea in 1855, and the land-use history lasts approximately 160 years. The main land-use types are farmland (irrigated land and dry land), rural construction land and water area; therefore, farmlands, construction land areas and water areas accounted for 73%, 15% and 5%, respectively, of the total area. The main land-use type is farmland, and the other areas are relatively less affected by the Yellow River sediment. Analyzing the content characteristics (Figure 5), the average contents of the TOC, AOC and NOC in the Yellow River flooding area, the Yellow River ancient course area and the area relatively less affected by sedimentation ranged from 1.56-11.18 g/kg, 0.18-2.23 g/kg and 1.35-8.59 g/kg, respectively. The contents of the TOC, AOC and NOC in each soil layer followed the sequence of the area relatively less affected by sedimentation > ancient course of Yellow River > Yellow River flooding area, and the characteristics of the range, minimum, maximum and standard deviation of the TOC, AOC and NOC in each soil layer (Table 4) were similar to those of the mean value. In the Yellow River flooded area at the junction of Zhoukou and Anhui Province, although the Yellow River flowed through this area in the past, it was less affected by the Yellow River sediment. The soil texture was consistent with that in the non-flooded area, and the contents of the TOC, AOC and NOC were high. The contents of the TOC, AOC and NOC in the 0-100 cm layer in the non-flooded area were higher than those in the flooded area. The contents of the TOC, AOC and NOC in the 0-100 cm layer in the ancient course of Yellow River area were higher than those in the flooded area, but lower than those in the area relatively less affected by sedimentation. Since agricultural production resumed in 1945, the soil properties of the 0-40 cm layer changed during the tillage process over nearly 70 years, but the impact on the 40-100 cm surface layer was relatively limited. As a result, the contents of the organic carbon components in the 0-20 cm and 20-40 cm surface layers were higher than those in the 40-100 cm layer. In conclusion, the distribution of the sediment alluvial/sedimentary area, thickness of the sediment layer, agricultural tillage process and tillage history are the main factors influencing the SOC and its components and spatial distribution.
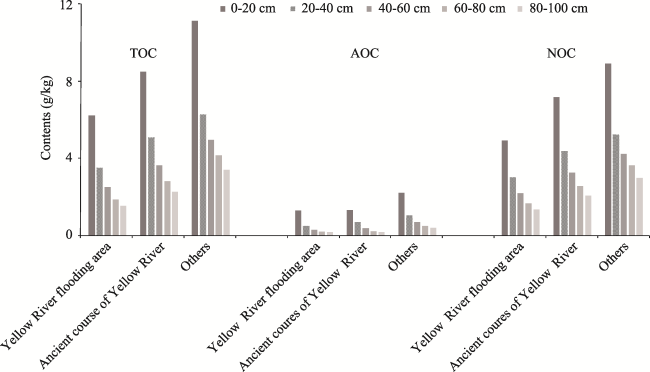
Figure 5 Average SOC contents in the area affected by the Yellow River sedimentation

4 Discussion

The spatial distributions of the TOC, AOC and NOC in different soil layers in the study area are consistent but also exhibit obvious differences. The spatial heterogeneity of the AOC is higher than that of the TOC and NOC, which reflects the impact area of the Yellow River sediment and the transition zone between the sediment areas and non-sediment areas. The thickness and spatial range of the Yellow River sediment layer are the key factors impacting the spatial variation in the organic carbon. After Yellow River flooding, river water commonly carries a large amount of sediment, which scours the land surface. The original soil is washed away, and a large amount of sediment accumulates on the land surface, thus changing the structure of the original soil. In the process of agricultural cultivation, with the return, decomposition and transformation of organic matter, the interaction of organic matter and soil particles forms a stable soil structure and improves the soil fertility and quality.
Table 4 Statistical characteristics of the SOC components in the area affected by the Yellow River sediment (g/kg)
Indicator Depth (cm) Range Minimum Maximum Standard deviation
YRFA ACYR Others YRFA ACYR Others YRFA ACYR Others YRFA ACYR Others
TOC 0-20 13.69 16.16 26.81 1.25 2.03 3.22 14.94 18.19 30.03 2.74 4.72 4.06
20-40 9.48 11.34 15.50 0.59 1.29 1.82 10.07 12.63 17.32 1.87 2.76 2.98
40-60 7.36 9.58 13.17 0.40 0.62 0.83 7.76 10.20 14.00 1.67 2.39 2.55
60-80 5.56 7.54 14.18 0.08 0.46 0.26 5.64 8.00 14.44 1.28 2.02 3.03
80-100 6.66 6.47 13.53 0.05 0.13 0.30 6.71 6.60 13.83 1.32 1.65 2.34
AOC 0-20 3.53 2.74 8.60 0.11 0.15 0.26 3.64 2.89 8.86 0.80 0.84 1.11
20-40 2.60 1.71 3.45 0.01 0.04 0.04 2.61 1.75 3.49 0.45 0.55 0.65
40-60 1.51 1.16 1.99 0.03 0.04 0.01 1.54 1.20 2.00 0.31 0.37 0.44
60-80 1.27 0.67 1.48 0.01 0.03 0.02 1.28 0.70 1.50 0.25 0.26 0.35
80-100 1.21 0.58 1.41 0.00 0.02 0.01 1.21 0.60 1.42 0.22 0.20 0.30
NOC 0-20 11.26 14.21 20.45 0.61 1.87 2.91 11.87 16.08 23.36 2.17 4.00 3.27
20-40 7.39 10.61 14.91 0.58 1.10 0.94 7.97 11.71 15.85 1.62 2.48 2.66
40-60 7.01 8.82 12.89 0.06 0.58 0.01 7.07 9.40 12.90 1.52 2.12 2.31
60-80 4.98 6.97 12.74 0.06 0.43 0.24 5.04 7.40 12.98 1.13 1.81 2.88
80-100 6.17 5.90 13.10 0.02 0.10 0.15 6.19 6.00 13.25 1.18 1.51 2.16

YRFA: The Yellow River flooding area

ACYR: The ancient course of Yellow River

The analysis of the soil particle size demonstrates that the soil particle composition in the area affected by the Yellow River sediment is primarily composed of 0.01-0.05 mm coarse silt and 0.05-0.25 mm fine sand. Coarse silt and fine sand in the Yellow River flooded area and the ancient course of the Yellow River account for 50%-88% and 56%-87%, respectively, and both account for 30%-70% in the area relatively less affected by sedimentation. The soil particle composition in the Yellow River flooded area and the ancient course of the Yellow River is similar to that in the middle reaches of the Yellow River, and fine sand and coarse silt are the predominant types (Xue et al., 2004; Sun et al., 2014; Yang et al., 2016). The deposition process and influence intensity of loess particles in the lower reaches of the Yellow River in different historical periods are the main reasons for the spatial differences in the soil particle size content in the study area. The adsorption capacity and amount of combined organic matter of inorganic particles of different sizes vary due to the difference in specific surface area and cohesive force, and coarse particle matter is not conducive to the formation of a stable soil structure and the accumulation of organic matter. Therefore, the spatial variability of particles of different sizes affects the soil structure and organic carbon content. The statistical characteristics and spatial distributions of the TOC, AOC and NOC contents in the soil profile reveal that the SOC content in the area affected by sedimentation is lower than that in the area relatively less affected by sedimentation, especially the SOC content in the 40-100 cm layer, which is relatively low, indicating that the content of the SOC and its components in the sediment deposition area is low and that there is still room for improvement.
The land use years or cultivation history are important factors impacting the soil organic carbon and its component content and spatial variability. Research has shown that cultivation is beneficial to the increase in the surface organic carbon content, which typically reveals a trend of increasing first and then stabilizing. This is mainly attributed to the increase in surface clay and silt particles and the formation process of organic matter aggregates (Su et al., 2010; 2017), and the size of aggregates is related to the composition, stability and microbial activity of the organic carbon (Vanlauwe et al., 1999; Aye et al., 2016). Cultivation affects the decomposition of soil organic carbon and the agglomeration process of its components and particles of different particle sizes. In uncultivated soil covered by vegetation, the organic carbon of sand grains rapidly increases and tends to remain stable during the early 0-5 years of reclamation, and the organic carbon activity is high and easily changes. With increasing reclamation years (5-20 years), the organic carbon of silt and clay grains (lignin, polyphenols, humus, etc.) increases, and the organic carbon remains stable and hardly degrades, resulting in the accumulation of the inactive organic carbon pool (McConkey et al., 2003; Tan et al., 2010). Spatially, the Yellow River flooding area, the ancient course of the Yellow River and the area less affected by the Yellow River sediment have utilization histories of 70 years, 160 years and > 160 years, respectively. With the extension of cultivation, the TOC content generally exhibits an increasing trend, in which the NOC and AOC also increase, and the NOC generally increases more than the AOC does. The increase in the NOC content reflects the effect of soil carbon sequestration, and the increase in the AOC creates conditions for biological settlement, improves the species diversity and activity of soil organisms, accelerates the decomposition and material cycle of organic matter, and provides conditions for the formation of soil aggregates and the improvement of the soil quality. The effect of the use years on forestland is similar to that of cultivated land, but the intensity of human disturbance is lower than that of cultivated land. Compared to the area relatively less affected by sedimentation, the soil stable organic carbon content in the Yellow River flooding area and the ancient course of the Yellow Rives is relatively low, and there is still room for improvement. In addition, due to the combination of the land-use types, cultivation methods, planting types, fertilization methods, utilization years and other factors, the contents of the active and inactive components of the organic carbon greatly differ in space and profile.
Henan Province is an important grain production base in China, and the contradiction between high-intensity land use, food security and SOC increment in sandy soil is prominent. According to the average content of the TOC in the 0-20 cm cultivated layer, over the past 70 to 160 years of utilization, the TOC contents were 6.24 g/kg and 8.54 g/kg in the ancient course of the Yellow River and the flooding area, respectively, at annual average growth rates of 0.09‰ and 0.05‰, respectively. Compared to the area relatively less affected by sedimentation, there were differences in the TOC content of 4.94 g/kg (the flooding area) and 2.64 g/kg (the ancient course of the Yellow River), and the contents of the AOC and NOC were lower than those in the area relatively less affected by sedimentation. The TOC and its components exhibited much room for improvement at the 20-100 cm depth in the ancient course of the Yellow River and the flooding area. These results suggested that the soil quality affected by the Yellow River sediment should be improved. The input of organic matter and composition of soil particle matter affect the soil structure and content of the SOC components, and effective methods, including straw return promotion, organic fertilizer return, addition of exogenous particulate matter, conservation tillage and other measures, should be implemented and adopted.

5 Conclusions

The alleviation and sedimentation of the Yellow River changed the composition of the soil particulate matter and SOC content. The contents of the TOC, AOC and NOC in the surface layer (0-20 cm) were higher than those in the lower layers (20-100 cm), and the variation range and content difference within the same layer in descending order were the TOC, NOC and AOC. Structural and random factors jointly affected the contents of the TOC, AOC and NOC, and the effect magnitudes of these two factors were similar.
The spatial variation trend of the TOC was consistent with that of the NOC from the surface layer to the bottom layer. The AOC was consistent with the TOC and NOC in the 0-20 cm layer, but there were differences between the 20-100 cm layer and the 0-20 cm layer. The transition between the high-value areas and the low-value areas was obvious, and the spatial variance was high.
The spatial variation in the TOC, NOC and AOC contents was distinct, and the difference and amplitude of the content in the 0-20 cm layer were the largest and revealed a decreasing trend with increasing depth. Within the same layer, the difference and amplitude followed the trend of TOC>NOC>AOC. The contribution of the NOC content to the TOC was larger than that of the AOC content, and the AOC better reflected the change in the TOC and the spatial variation area. The contents and spatial variation in the AOC and NOC better represented the TOC spatial variation and carbon accumulation areas. The distribution of the alluvial/sedimentary area, thickness of the sediment layer, agricultural tillage process and tillage history were the main factors influencing the content and spatial distribution of the SOC and its composition.
Agricultural tillage increased the content of organic carbon in the sandy soil, but the growth rate was low, which was contradictory to the high-intensity agricultural production and agricultural demand of the region. The input of organic matter and the composition of soil particulate matter affected the soil structure and the content of the various organic carbon components. Therefore, promoting straw return, organic fertilizer application, addition of exogenous particulate matter and conservation tillage are effective ways to improve the soil quality and achieve sustainable development of agriculture in the region.
1
Aye N S, Sale P W G, Tang C X, 2016. The impact of long-term liming on soil organic carbon and aggregate stability in low-input acid soils. Biology and Fertility of Soils, 52(5):697-709.

DOI

2
Belay-Tedla A, Zhou X, Su B et al., 2009. Labile, recalcitrant, and microbial carbon and nitrogen pools of a tallgrass prairie soil in the US Great Plains subjected to experimental warming and clipping. Soil Biology & Biochemistry, 41(1):110-116.

DOI

3
Chai Y J, Zeng X B, Sheng Z E et al., 2019. The stability mechanism for organic carbon of aggregate fractions in the irrigated desert soil based on the long-term fertilizer experiment of China. Catena, 173:312-320.

DOI

4
Chatterjee S, Bandyopadhyay K K, Pradhan S et al., 2018. Effects of irrigation, crop residue mulch and nitrogen management in maize (Zea mays L.) on soil carbon pools in a sandy loam soil of Indo-Gangetic plain region. Catena, 165:207-216.

DOI

5
Donato C, Bernardo M, Andrea P et al., 2018. Modeling soil organic carbon and carbon dioxide emissions in different tillage systems supported by precision agriculture technologies under current climatic conditions. Soil & Tillage Research, 183:51-59.

6
Drobnik T, Greiner L, Keller A et al., 2018. Soil quality indicators: From soil functions to ecosystem services. Ecological Indicators, 94:151-169.

7
Du P Y, Zhang H T, Guo L et al., 2018. Variation of soil organic matter in transition zones and its influencing factors. Acta Pedologica Sinica, 55(5):1286-1295. (in Chinese)

8
Gao W, Yang J, Ren S R, 2015. Balance characteristics of soil organic carbon under different long-term fertilization models in the upland fluvo-aquic soil of North China. Journal of Plant Nutrition and Fertilizer, 21(6):1465-1472. (in Chinese)

9
Greiner L, Keller A, Grêt-Regameyb A et al., 2017. Soil function assessment: Review of methods for quantifying the contributions of soils to ecosystem services. Land Use Policy, 69:224-237.

DOI

10
Huang X K, Wang A Q, 1954. Soil geography of the yellow plain region. Acta Geographica Sinica, 20(3):313-331. (in Chinese)

11
Huo Y Z, Li T J, 1986. Experiment and practice of soil geography. Beijing: Higher Education Press. (in Chinese)

12
Jia H F, Luo H X, Hu J M et al., 2014. Spatial variability of topsoil organic carbon and labile components in Napahai Wetland, Northwest of Yunnan, China. Mountain Research, 32(5):624-632. (in Chinese)

13
Kumar S, Lar R, Liu D et al., 2013. Estimating the spatial distribution of organic carbon density for the soils of Ohio, USA. Journal of Geographical Sciences, 23(2):280-296.

DOI

14
Laik R, Kumar K, Das D K et al., 2009. Labile soil organic matter pools in a calciorthent after 18 years of afforestation by different plantations. Applied Soil Ecology, 42(2):71-78.

DOI

15
Lefroy R D B, Blair G J, Strong W M, 1993. Changes in soil organic matter with cropping as measured by organic carbon fractions and 13C natural isotope abundance. Plant and Soil, 155/156(1):399-402.

DOI

16
Li P P, Wang Q, Wen Q et al., 2017. Effects of the return of organic materials on soil physical and chemical properties and bacterial number in sandy soil. Acta Ecological Sinica, 37(11):3665-3672. (in Chinese)

17
Li Y, Wand X, Niu Y et al., 2018. Spatial distribution of soil organic carbon in the ecologically fragile Horqin Grassland of northeastern China. Geoderma, 325:102-109.

DOI

18
Li Y W, Xu X X, Liu Y Z, 2010. Henan Geography. Beijing: Beijing Normal University Press. (in Chinese)

19
Li Z T, Ma Z S, Chen G M, 1991. Soil Resources in Zhoukou Region. Beijing: China Science and Technology Press. (in Chinese)

20
Liu X H, Zhang H B, Li Y et al., 2019. Variation of organic matter in soil aggregates with the succession of tidal flatland from barren land-saltmarsh-upland in the Yellow River delta. Acta Pedologica Sinica, 56(2):374-385. (in Chinese)

21
Loginow W, Wisniweski W, Strong W M et al., 1987. Fractionation of organic carbon based on susceptibility to oxidation. Polish Journal of Soil Science, 20(1):47-52.

22
McConkey B G, Liang B C, Campbell C A et al., 2003. Crop rotation and tillage impact on carbon sequestration in Canadian prairie soils. Soil & Tillage Research, 74(1):81-90.

23
Meng Z J, Liu A N, Wu H Q et al., 1998. Mathematical model of water-fertilizer interaction for water-saving and high-yield winter wheat in east area of Henan Province, Transaction of the CSAE, 1:86-90. (in Chinese)

24
Pu Y L, Ye C, Zhang S R et al., 2017. Effects of different ecological restoration patterns on labile organic carbon and carbon pool management index of desertification grassland soil in zoige. Acta Ecologica Sinica, 37(2):367-377. (in Chinese)

25
Su Y Z, Zhang K, Liu T N et al., 2017. Changes in soil properties and accumulation of soil carbon after cultivation of desert sandy land in a marginal oasis in Hexi corridor region, northwest China. Scientia Agricultura Sinica, 50(9):1646-1654. (in Chinese)

26
Su Y Z, Yang R, Liu W J et al., 2010. Evolution of soil structure and fertility after conversion of native sandy desert soil to irrigated cropland in arid region, China. Soil Science, 175(5):246-254.

DOI

27
Sun C L, Xue S, Liu G B et al., 2014. Effects of long-term fertilization on soil particles and microaggregate distribution in the loess area. Journal of Plant Nutrition and Fertilizer, 20(3):550-561. (in Chinese)

28
Tan G M, Xu W L, Sheng J D et al., 2010. The variation of soil organic carbon and soil particle-size in Xinjiang oasis farmland of different years. Acta Pedologica Sinica, 47(2):279-285. (in Chinese)

29
Vanlauwe B, Nwoke O C, Sanginga N et al., 1999. Evaluation of methods for measuring microbial biomass C and N and relationships between microbial biomass and soil organic matter particle size classes in West-African soils. Soil Biology & Biochemistry, 31(8):1071-1082.

DOI

30
Wang J Y, Zhang H, 2016. Distribution of soil aggregates and aggregate-associated organic carbon from typical halophyte community in arid region. Acta Ecologica Sinica, 36(3):600-607.

31
Wu M, Liu S J, Ye Y Y et al., 2016. Spatial variability of surface soil organic carbon and its influencing factors in cultivated slopes and abandoned lands in a Karst peak-cluster depression area. Acta Ecologica Sinica, 36(6):1619-1627. (in Chinese)

32
Xu L, Wang C, Zhu J et al., 2018. Latitudinal patterns and influencing factors of soil humic carbon fractions from tropical to temperate forests. Journal of Geographical Sciences, 28(1):15-30.

DOI

33
Xu J S, Zhao B Z, Zhang J B et al., 2017. Effects of long-term application of organic manure and chemical fertilizer on structure of humic acid in fluvo-aquic soil. Acta Pedologica Sinica, 54(3):647-656. (in Chinese)

34
Xue W J, Che D F, Cai H et al., 2004. Grain-size compostition of surface layer loess of Xi’an city and its shape character. Journal of Northwest University (Natural Science Edition), 2004,34(2):223-227. (in Chinese)

35
Yao J T, Kong X B, 2018. Modeling the effects of land-use optimization on the soil organic carbon sequestration potential. Journal of Geographical Sciences, 28(11):1641-1658.

DOI

36
Yang T, Jing H, Yao X et al., 2016. Soil particle composition and its fractal dimension characteristics of different land uses in Loess hilly region. Research of Soil and Water Conservation, 23(3):1-24. (in Chinese)

37
Zhang J H, Li G D, Nan Z R et al., 2012. Research on soil particle size distribution and its relationship with soil organic carbon under the effects of tillage in the Heihe oasis. Geographical Research, 31(4):608-618. (in Chinese)

38
Zhu L Q, Hu N J, Zhang Z W et al., 2015. Short-term responses of soil organic carbon and carbon pool management index to different annual straw return rates in a rice-wheat cropping system. Catena, 135:283-289.

DOI

39
Zhu R H, Zheng Z C, Li T X et al., 2018. Effects of converting farmland to tea plantations on soil labile organic carbon fractions in the hilly region of Western Sichuan, China. Acta Scientiae Circumstantiae, 38(2):744-751. (in Chinese)

Outlines

/