Research Articles

Spatial identification and scenario simulation of the ecological transition zones under the climate change in China

  • FAN Zemeng 1, 2, 3
Expand
  • 1. State Key Laboratory of Resources and Environmental Information System, Institute of Geographic Sciences and Natural Resources Research, CAS, Beijing 100101, China
  • 2. College of Resources and Environment, University of Chinese Academy of Sciences, Beijing 100049, China
  • 3. Jiangsu Center for Collaborative Innovation in Geographical Information Resource Development and Application, Nanjing 210023, China

Fan Zemeng, PhD, specialized in ecological modelling and system simulation. E-mail:

Received date: 2020-10-19

  Accepted date: 2021-01-22

  Online published: 2021-06-25

Supported by

National Key R&D Program of China, No(2018YFC0507202)

National Key R&D Program of China, No(2017YFA0603702)

National Natural Science Foundation of China, No(41971358)

National Natural Science Foundation of China, No(41930647)

Strategic Priority Research Program (A) of the Chinese Academy of Sciences, No(XDA20030203)

Innovation Research Project of State Key Laboratory of Resources and Environment Information System, CAS

Copyright

Copyright reserved © 2021. Office of Journal of Geographical Sciences All articles published represent the opinions of the authors, and do not reflect the official policy of the Chinese Medical Association or the Editorial Board, unless this is clearly specified.

Abstract

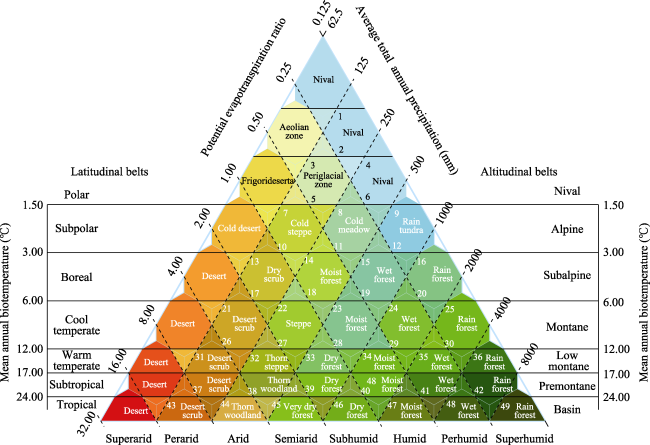
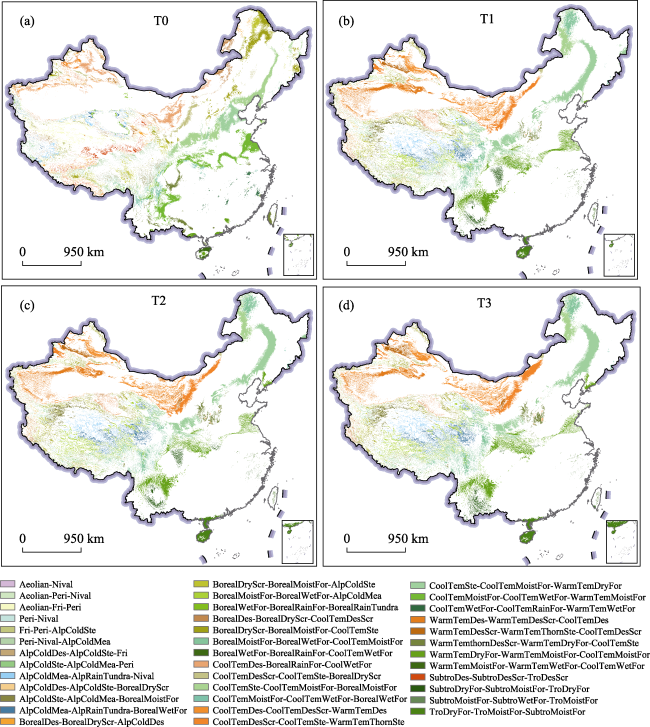
Explicitly identifying the spatial distribution of ecological transition zones (ETZs) and simulating their response to climate scenarios is of significance in understanding the response and feedback of ecosystems to global climate change. In this study, a quantitative spatial identification method was developed to assess ETZ distribution in terms of the improved Holdridge life zone (iHLZ) model. Based on climate observations collected from 782 weather stations in China in the T0 (1981-2010) period, and the Intergovernmental Panel on Climate Change Coupled Model Intercomparison Project (IPCC CMIP5) RCP2.6, RCP4.5, and RCP8.5 climate scenario data in the T1 (2011-2040), T2 (2041-2070), and T3 (2071-2100) periods, the spatial distribution of ETZs and their response to climate scenarios in China were simulated in the four periods of T0, T1, T2, and T3. Additionally, a spatial shift of mean center model was developed to quantitatively calculate the shift direction and distance of each ETZ type during the periods from T0 to T3. The simulated results revealed 41 ETZ types in China, accounting for 18% of the whole land area. Cold temperate grassland/humid forest and warm temperate arid forest (564,238.5 km 2), cold temperate humid forest and warm temperate arid/humid forest (566,549.75 km 2), and north humid/humid forest and cold temperate humid forest (525,750.25 km 2) were the main ETZ types, accounting for 35% of the total ETZ area in China. Between 2010 and 2100, the area of cold temperate desert shrub and warm temperate desert shrub/thorn steppe ETZs were projected to increase at a rate of 4% per decade, which represented an increase of 3604.2, 10063.1, and 17,242 km 2 per decade under the RCP2.6, RCP4.5, and RCP8.5 scenarios, respectively. The cold ETZ was projected to transform to the warm humid ETZ in the future. The average shift distance of the mean center in the north wet forest and cold temperate desert shrub/thorn grassland ETZs was generally larger than that of other ETZs, with the mean center moving to the northeast and the shift distance being more than 150 km during the periods from T0 to T3. In addition, with a gradual increase of temperature and precipitation, the ETZs in northern China displayed a shifting northward trend, while the area of ETZs in southern China decreased gradually, and their mean center moved to high-altitude areas. The effects of climate change on ETZs presented an increasing trend in China, especially in the Qinghai-Tibet Plateau.

Cite this article

FAN Zemeng . Spatial identification and scenario simulation of the ecological transition zones under the climate change in China[J]. Journal of Geographical Sciences, 2021 , 31(4) : 497 -517 . DOI: 10.1007/s11442-021-1855-7

1 Introduction

Since the concept of the ecological transition zone (ETZ) was proposed by Clements (1905) , there have been attempts to clarify its exact definition and meaning. At the 7th Scientific Committee on Problems of the Environment (SCOPE) held in Paris in 1988, an ETZ was defined as the ecological zone between two adjacent ecosystems, with uncertain spatiotemporal characteristics and mutual influences. The 7th SCOPE considered that the concept of an ETZ, which combines the theory of ecosystem interface and the characteristics of vulnerability, can be used as a basic indicator to identify global change, and called on the international ecological community to conduct research on ETZs (Holland, 1988). With an initial definition and an increased research effort in the ETZ concept (Castri et al., 1988; Niu, 1989; Ma, 1990), an ETZ was further defined as the ecological transition area between the dominant vegetation types driven by climate change and human activities at the spatial scale from 100 m2 to 100 km2 (Gosz, 1993; Bestelmeyer et al., 2001). Thus, an ETZ covers the uncertainty in the two dimensions of time and space (Ferro and Morrone, 2014).
One ETZ normally includes two or more ecosystem types, which are easily affected by each other and could eventually transform into the dominant ecosystem. Under the effects of climate change and human activities, there could be a rapid conversion into the dominant ecosystem in an ETZ (Wuyts, 2017), which would lead to a series of changes to the structural and spatial pattern of the ETZ (Ma, 1990; Peteet, 2000). For example, changes in the vegetation distribution and its speed of response to climate change in an ETZ will be faster than in the area adjacent to the ETZ (Breshears et al., 2005; Williamsa et al., 2010). The risk of the growth and decline of different plant species caused by extreme climate events in an ETZ is higher than that in the adjacent area (Feddema et al., 2005; Rich et al., 2015; Dolezal, 2016). The change intensity and landscape diversity of land cover in an ETZ are also higher than in the adjacent area (Fan et al., 2013a; Guan et al., 2015). It has also been shown that ETZs are areas where plant growth and photosynthesis is extremely sensitive to climate warming (Gao, 1994), and the influence of rainfall on the canopy of evergreen plants in an ETZ would cause a larger variation in the range of plant structures than in the adjacent area (Reich et al., 2015).
Many studies have shown that ETZs are the most sensitive areas to climate change and human activities (Smith et al., 1997; Chapin et al., 2000; Mayle, 2000). They are also areas where species can easily expand their distribution, and biodiversity is more vulnerable to climate change than in adjacent areas (Pauli et al., 2012; Marshall and Liebherr, 2000). The spatiotemporal changes of ecosystems in ETZs requires further study, which would enable an analysis of the species transmission mode, build an optimal protection framework for species (Loehle, 2018), and reduce the risk of the impact of climate change on biodiversity (Wang et al., 2018). In recent years, several studies on land cover change (Fan et al., 2013a, 2015; Guan et al., 2015; Rich et al., 2015; Li et al., 2018), vegetation structure and distribution (Bestelmeyer and Wiens, 2001), biodiversity change (Caneva et al., 2016; Fan et al., 2019), ecosystem assessment (Xiao et al., 1997), and remote sensing monitoring in ETZs have been conducted, which have mainly focused on the response of ecosystems to climate change and human activities in a certain ETZ type. The quantitative spatial identification of distribution ranges and boundaries in different ETZ types is still in the stage of conceptual model development, with attempts to identify the boundaries between two ETZ types and to conduct ETZ boundary identification in specific regions (Yarrow and Salthe, 2008; Danz et al., 2013). Alpha and gamma diversity has been used to analyze the transition and abrupt boundary between Trifolium grassland and Acacia shrub in a desert dune region of Australia (Nicholas, 2011), and an analysis method based on the spatial activity characteristics of herbivores has been used to identify the boundary between terrestrial and aquatic ecosystems (Sarneel et al., 2014).
It is not clear how to develop a spatial method for identifying ETZ types, analyzing their distribution and biodiversity change, and explaining their different responses to climate change and human activities at a large scale. Therefore, the purpose of this study was to develop a spatial model for identifying the boundary of each ETZ type and its distribution. During the process of developing an ETZ spatial identification model, the classification criteria of each ETZ type was first established according to the improved Holdridge life zone (iHLZ) model, and then a theoretical equation was developed to distinguish the boundary between any two different ETZ types. Based on climate observation data collected from the 782 weather stations of China in the T0 (1981-2010) period, and the Intergovernmental Panel on Climate Change Coupled Model Intercomparison Project (IPCC CMIP5) RCP2.6, RCP4.5, and RCP8.5 climate scenario data in the periods of T1 (2011-2040), T2 (2041-2070), and T3 (2071-2100), the spatial distribution and changes of every ETZ type were simulated by operating the ETZ spatial identification model, and then a spatial shift of mean center model was developed to calculate the shift direction and distance of each ETZ type during the periods from T0 to T3.

2 Data and methods

2.1 Datasets

The climate data used for the spatial identification and simulation analysis of ETZ types included station observation data and model simulation data. The observed climate data were collected from the 752 meteorological stations located in China during the period from 1981 to 2010. The climate scenario data included the RCP2.6, RCP4.5, and RCP8.5 scenario data for 2011-2040 (T1), 2041-2070 (T2), and 2071-2100 (T3), which were released by the CMIP5 (van Vuuren et al., 2011). The RCP2.6, RCP4.5, and RCP8.5 represent low, middle, and high greenhouse gas emission scenarios (http://www.ipcc-data.org). The digital elevation model (DEM) data of China were obtained from Shuttle Radar Topography Mission (SRTM) data, with a spatial resolution of 1 km × 1 km (http://srtm.csi.cgiar.org).
The quality of the spatial data of climate variables directly affects the accuracy in the simulation of an ETZ (Fan et al., 2013a). The selection of a good method to interpolate the observed climate data and downscale the climate scenario data is important to obtain high accuracy spatial data for climate variables. The currently used interpolation and downscaling methods mainly include the inverse distance weighted (IDW) model, triangulated irregular network (TIN) model, kriging (Kriging) model, spline interpolation (Spline) and high accuracy surface modeling (HASM) (Yue, 2011; Yue et al., 2016). High accuracy surface modeling is a new method based on differential geometry theory, which could overcome the limits of the IDW, TIN, Kriging, and Spline methods and greatly improve the accuracy of interpolating and downscaling the climate data (Yue et al., 2005, 2020). Thus, the HASM method was adopted, and longitude, latitude, and elevation data were incorporated to obtain the spatial grid data of mean annual biotemperature (MAB), average total annual precipitation (TAP), and potential evapotranspiration ratio (PER), with a spatial resolution of 1 km × 1 km during the periods from 1981 to 2010 (T0), 2011 to 2040 (T1), 2041 to 2070 (T2), and 2071 to 2100 (T3) (Yue, 2011; Yue et al., 2016).

2.2 Ecological transition zone spatial identification model

The continuous distribution characteristics of MAB, TAP, and PER determine the independence of different ecosystem types on the terrestrial surface (Biermann, 2007). There is a specific area where two or more ecosystem types can overlap, in which a change of MAB, TAP, and PER would lead directly to the boundary movement of different ecosystem types (Mayle et al., 2004). In this study, these overlapping areas of multiple ecosystem types were defined as an ETZ, and could be represented by the equilateral triangles formed by the intersection of the scale lines of MAB, TAP, and PER in the iHLZ classification system in Figure 1 (Yue et al., 2006; Fan and Fan, 2019; Fan et al., 2020).
Figure 1 The spatial identification mechanism and scheme of ecological transition zones (ETZs)
Based on the ETZ spatial identification mechanism in Figure 1, the ETZs could be classified into 49 types, and the boundary values of MAB, MAP, and PER for each ETZ type were calculated (Table 1). For example, the three lines of MAB (12.00℃), TAP (500 mm), and PER (1.0) intersected to form triangle 28 (Figure 1), which was defined as the transition zone between cool temperate steppe, cool temperate moist forest and warm temperate dry forest, in which the boundary values of MAB, MAP, and TAP were >12.00℃, <500 mm, and <1.00, respectively. The ETZ spatial identification model could be formulated as:
$MAB(x,y,t)=\frac{1}{365}\underset{j=1}{\overset{365}{\mathop \sum }}\,TEM(j,x,y,t)$
$TAP(x,y,t)=\underset{j=1}{\overset{365}{\mathop \sum }}\,P(j,x,y,t)$
$PER(x,y,t)=\frac{58.93MAB(x,y,t)}{MAP(x,y,t)}$
$\begin{matrix} \text{if}((MAB(x,y,t)\in \{MA{{B}_{0i}}\})\text{ }\!\!\And\!\!\text{ }(TAP(x,y,t)\in \{TA{{P}_{0i}}\})\text{ }\!\!\And\!\!\text{ }(PER(x,y,t)\in \{PE{{R}_{0i}}\})) \\ \text{ETZ(}x,y,t\text{)}=i(1,2,3,\ldots ,49);\text{else}\ \text{ETZ(}x,y,t\text{)}=0 \\ \end{matrix}$
where $MAB(x,y,t)$,$\text{ }\!\!~\!\!\text{ }TAP(x,y,t)$, and $PER(x,y,t)$ represent the values of MAB (℃), TAP (mm) and PER, respectively, at site (x, y) in period t; $\text{ETZ(}x,y,t\text{)}$ is the value of the ETZ type at site (x, y); $MA{{B}_{0i}}$, $TA{{P}_{0i}}$, and $PE{{R}_{0i}}$ represent the respective boundary thresholds of the ith (i =1, 2, 3, . . ., 49) ETZ type (Table 1).
Table 1 The identification criterion of ecological transition zone (ETZ) types
Code ETZ Type MAB (℃) TAP (mm) PER
1 Transition zone between aeolian area and nival area (Aeolian-Nival) >0.375 <125 <0.25
2 Transition zone between aeolian area, periglacial area, and nival area (Aeolian-Peri-Nival) <0.75 >125 >0.25
3 Transition zone between aeolian area, frigorideserta, and periglacial area (Aeolian-Fri-Peri) >0.75 <125 <0.50
4 Transition zone between periglacial area and nival area (Peri-Nival) >0.75 <250 <0.25
5 Transition zone between frigorideserta, periglacial area, and alpine cold steppe (Fri-Peri-AlpColdSte) <1.50 >125 >0.50
6 Transition zone between periglacial area, nival area, and alpine cold meadow (Peri-Nival-AlpColdMea) <1.50 >250 >0.25
7 Transition zone between alpine cold desert, alpine cold steppe, and frigorideserta (AlpColdDes-AlpColdSte-Fri) >1.50 <125 <1.00
8 Transition zone between alpine cold steppe, alpine cold meadow, and periglacial area (AlpColdSte-AlpColdMea-Peri) >1.50 <250 <0.50
9 Transition zone between alpine cold meadow, alpine rain tundra, and nival area (AlpColdMea-AlpRainTundra-Nival) >1.50 <500 <0.25
10 Transition zone between alpine cold desert, alpine cold steppe, and boreal dry scrub (AlpColdDes-AlpColdSte-BorealDryScr) <3.00 >125 >1.00
11 Transition zone between alpine cold steppe, alpine cold meadow, and boreal moist forest (AlpColdSte-AlpColdMea-BorealMoistFor) <3.00 >250 >0.50
12 Transition zone between alpine cold meadow, alpine rain tundra, and boreal wet forest (AlpColdMea-AlpRainTundra-BorealWetFor) <3.00 >500 >0.25
13 Transition zone between boreal desert, boreal dry scrub, and alpine cold desert (BorealDes-BorealDryScr-AlpColdDes) >3.00 <125 <2.00
14 Transition zone between boreal dry scrub, boreal moist forest, and alpine cold steppe (BorealDryScr-BorealMoistFor-AlpColdSte) >3.00 <250 <1.00
15 Transition zone between boreal moist forest, boreal wet forest and alpine cold meadow (BorealMoistFor-BorealWetFor-AlpColdMea) >3.00 <500 <0.50
16 Transition zone between boreal wet forest, boreal rain forest, and alpine rain tundra (BorealWetFor-BorealRainFor-BorealRainTundra) >3.00 <1000 <0.25
17 Transition zone between boreal desert, boreal dry scrub, and cool temperate desert scrub (BorealDes-BorealDryScr-CoolTemDesScr) <6.00 >125 >2.00
18 Transition zone between boreal dry scrub, boreal moist forest, and cool temperate steppe (BorealDryScr-BorealMoistFor-CoolTemSte) <6.00 >250 >1.00
19 Transition zone between boreal moist forest, boreal wet forest, and cool temperate moist forest (BorealMoistFor-BorealWetFor-CoolTemMoistFor) <6.00 >500 >0.50
20 Transition zone between boreal wet forest, boreal rain forest, and cool temperate wet forest (BorealWetFor-BorealRainFor-CoolTemWetFor) <6.00 >1000 >0.25
21 Transition zone between cool temperate desert, cool temperate desert scrub, and boreal desert (CoolTemDes-BorealRainFor-CoolWetFor) >6.00 <125 <4.00
22 Transition zone between cool temperate desert scrub, cool temperate steppe, and boreal dry scrub (CoolTemDesScr-CoolTemSte-BorealDryScr) >6.00 <250 <2.00
23 Transition zone between cool temperate steppe, cool temperate moist forest, and boreal moist forest (CoolTemSte-CoolTemMoistFor-BorealMoistFor) >6.00 <500 <1.00
24 Transition zone between cool temperate moist forest, cool temperate wet forest, and boreal wet forest (CoolTemMoistFor-CoolTemWetFor-BorealWetFor) >6.00 <1000 <0.50
25 Transition zone between cool temperate wet forest, cool temperate rain forest, and boreal rain forest (CoolTemWeFor-CoolTemRainFor-BorealRainFor) >6.00 <2000 <0.25
26 Transition zone between cool temperate desert, cool temperate desert scrub, and warm temperate desert (CoolTemDes-CoolTemDesScr-WarmTemDes) <12.00 >125 >4.00
27 Transition zone between cool temperate desert scrub, cool temperate steppe, and warm temperate thorn steppe (CoolTemDesScr-CoolTemSte-WarmTemThornSte) <12.00 >250 >2.00
28 Transition zone between cool temperate steppe, cool temperate moist forest, and warm temperate dry forest (CoolTeSte-CoolTemMoistFor-WarmTemDryFor) <12.00 >500 >1.00
29 Transition zone between cool temperate moist forest, cool temperate wet forest, and warm temperate moist forest (CoolTemMoistFor-CoolTemWetFor-WarmTemMoistFor) <12.00 >1000 >0.50
30 Transition zone between cool temperate wet forest, cool temperate rain forest, and warm temperate wet forest (CoolTemWetFor-CoolTemRainFor-Warm TemWetFor) <12.00 >2000 >0.25
31 Transition zone between warm temperate desert, warm temperate desert scrub, and cool temperate desert (WarmTemDes-WarmTemDesScr-CoolTemDes) >12.00 <125 <8.00
32 Transition zone between warm temperate desert scrub, warm temperate thorn steppe, and cool temperate desert scrub (WarmTemDesScr-WarmTemThornSte-CoolTemDesScr) >12.00 <250 <4.00
33 Transition zone between warm temperate thorn steppe, warm temperate dry forest, and cool temperate steppe (WarmTemthornDesScr-WarmTemDryFor-CoolTemSte) >12.00 <500 <2.00
34 Transition zone between warm temperate dry forest, warm temperate moist forest, and cool temperate moist forest (WarmTemDryFor-WarmTemMoistFor-CoolTemMoistFor) >12.00 <1000 <1.00
35 Transition zone between warm temperate moist forest, warm temperate wet forest and cool temperate wet forest (WarmTemMoistFor-WarmTemWetFor- CoolTemWetFor) >12.00 <2000 <0.50
36 Transition zone between warm temperate wet forest, warm temperate rain forest, and cool temperate rain forest (WarmTemWetFor-WarmTemRainFor- CoolTemRainFor) >12.00 <4000 <0.25
37 Transition zone between subtropical desert, subtropical desert scrub, and tropical desert scrub (SubtroDes-SubtroDesScr-TroDesScr) <24.00 >125 >8.00
38 Transition zone between subtropical desert scrub, subtropical thorn steppe, and tropical thorn forest (SubtroDesScr-SubtroThornSte-TroThornFor) <24.00 >250 >4.00
39 Transition zone between subtropical thorn woodland, subtropical dry forest, and tropical very dry forest (SubtroThornWood-SubtroDryFor-TroVeryDryFor) <24.00 >500 >2.00
40 Transition zone between subtropical dry forest, subtropical moist forest, and tropical dry forest (SubtroDryFor-SubtroMoistFor-TroDryFor) <24.00 >1000 >1.00
41 Transition zone between subtropical moist forest, subtropical wet forest, and tropical moist forest (SubtroMoistFor-SubtroWetFor-TroMoistFor) <24.00 >2000 >0.50
42 Transition zone between subtropical wet forest, subtropical rain forest, and tropical wet forest (SubtroWetFor-SubtroRainFor-TroWetFor) <24.00 >4000 >0.25
43 Transition zone between tropical desert, tropical desert scrub, and subtropical desert (TroDes-TroDesScr-SubtroDes) >24.00 <125 <16.00
44 Transition zone between tropical desert scrub, tropical thorn woodland, and subtropical desert (TroDesScr-TroDesThornwood-SubtroDesScr) >24.00 <250 <8.00
45 Transition zone between tropical thorn woodland, tropical very dry forest, and subtropical thorn woodland (TroThornWood-TroVeryDryFor-SubtroThornWood) >24.00 <500 <4.00
46 Transition zone between tropical very dry forest, tropical dry forest, and subtropical dry forest (TroVeryDryFor-TroDryFor-SubtroDryFor) >24.00 <1000 <2.00
47 Transition zone between tropical dry forest, tropical moist forest, and subtropical moist forest (TroDryFor-TroMoistFor-SubtroMoistFor) >24.00 <2000 <1.00
48 Transition zone between tropical moist forest, tropical wet forest, and subtropical wet forest (TroMoistFor-TroWetFor-SubtroWetFor) >24.00 <4000 <0.50
49 Transition zone between tropical wet forest, tropical rain forest, and subtropical wet forest (TroWetFor-TroRainFor-SubtroWetFor) >24.00 <8000 <0.25

2.3 Spatial shift of mean center model for ETZs

Based on the ETZ classification results, the mean center model was introduced to analyze the shift direction and distance of every ETZ type. The spatial shift model of mean center of ETZ was formulated as follows (Yue et al., 2005, 2006; Fan et al., 2019):
${{x}_{j}}(t)=\underset{i=1}{\overset{{{K}_{j}}(t)}{\mathop \sum }}\,\frac{{{S}_{ij}}(t){{x}_{ij}}(t)}{{{S}_{j}}(t)}$
${{y}_{j}}(t)=\underset{i=1}{\overset{{{K}_{j}}(t)}{\mathop \sum }}\,\frac{{{S}_{ij}}(t){{y}_{ij}}(t)}{{{S}_{j}}(t)}$
where t is the variable of time;$\text{ }\!\!~\!\!\text{ }{{K}_{j}}(t)$. is the patch number of ETZ type j; ${{S}_{ij}}(t)$ is the area of the ith patch of ETZ type j; ${{S}_{j}}(t)$ is the total area of ETZ type j; (${{x}_{ij}}(t)$, ${{y}_{ij}}(t)$) are the longitude and latitude coordinates of the geometric center of the ith patch of HLZ type j, respectively; (${{x}_{j}}(t)$, ${{y}_{j}}(t)$) is the mean center of the HLZ type j.
Shift distance and direction of ETZ type j in the period from t to t + 1 were respectively formulated as:
${{D}_{j}}=\sqrt{~{{({{x}_{j}}(t+1)-{{x}_{j}}(t))}^{2}}+{{({{y}_{j}}(t+1)-{{y}_{j}}(t))}^{2}}}$
${{\theta }_{j}}=arctg\left(\frac{{{y}_{j}}(t+1)-{{y}_{j}}(t)}{{{x}_{j}}(t+1)-{{x}_{j}}(t)} \right)$
where Dj is the shift distance of ETZ type j in the period from t to t + 1; θj is the shift direction of ETZ type j, in which due east is 0°, due north is 90°, due west is 180°, and due south is 270°; (${{x}_{j}}(t)$, ${{y}_{j}}(t)$) and (${{x}_{j}}(t+1)$, ${{y}_{j}}(t+1)$) are the coordinates of the mean center of ETZ type j in the years t and t + 1, respectively. When 0° < θj < 90°, ETZ type j shifts to the northeast during the period from t to t + 1; when 90° < θj < 180°, ETZ type j shifts to the northwest; when 180° < θj < 270°, ETZ type j shifts to the southwest; when 270° < θj < 360°, ETZ type j shifts to the southeast.

3 Results

3.1 Spatial distribution pattern of ETZs

The ETZ simulation results under the RCP2.6, RCP4.5, and RCP8.5 climate scenarios showed that 41 ETZ types would be distributed in China during the periods from T0 to T3. The ETZs in eastern China displayed a belt distribution pattern from northeast to southwest. The ETZs in western China displayed a scattered distribution pattern that had significant heterogeneity, and they were mainly distributed in mountainous areas. The transition zones between cool temperate steppe, cool temperate moist forest, and warm temperate dry forest (CoolTemSte-CoolTemMoistFor-WarmTemDryFor), warm temperate dry forest, warm temperate moist forest and cool temperate moist forest (WarmTemDryFor-WarmTemMoistFor-CoolTemMoistFor), and boreal moist forest, boreal wet forest and cool temperate moist forest (BorealMoistFor-BorealWetFor-CoolTemMoistFor) were the major ETZ types. The areas of the three ETZ types accounted for one third of the total area of ETZs in China. The CoolTemSte-CoolTemMoistFor-WarmTemDryFor ETZ was mainly distributed in the Changbai Mountains, the southern Lvliang-Taihang Mountains, and the mountainous and hilly regions along the north bank of the Weihe River. The WarmTemDryFor-WarmTemMoistFor-CoolTemMoistFor ETZ was mainly distributed in the middle and lower reaches of the Yangtze River and the west of the Yunnan-Guizhou Plateau. The BorealMoistFor-BorealWetFor-CoolTemMoistFor ETZ was mainly distributed in the mountainous and hilly regions of the north of Daxing'anling, the Hengduan Mountains, and northwest of Sichuan Basin.
The area of the transition zones between the aeolian area and nival area (Aeolian-Nival), aeolian area, periglacial area, and nival area (Aeolian-Peri-Nival), aeolian area, frigorideserta, and periglacial area (Aeolian-Fri-Peri), periglacial area and nival area (Peri-Nival), frigorideserta, periglacial area, and alpine cold steppe (Fri-Peri-AlpColdSte), alpine cold desert, alpine cold steppe, and frigorideserta (AlpColdDes-AlpColdSte-Fri), alpine cold desert, alpine cold steppe, and boreal dry scrub (AlpColdDes-AlpColdSte-BorealDryScr), boreal desert, boreal dry scrub, and alpine cold desert (BorealDes-BorealDryScr-AlpColdDes), boreal wet forest, boreal rain forest, and alpine rain tundra (BorealWetFor-BorealRainFor-BorealRainTundra), boreal desert, boreal dry scrub, and cool temperate desert scrub (BorealDes-BorealDryScr-CoolTemDesScr), boreal wet forest, boreal rain forest, and cool temperate wet forest (BorealWetFor-BorealRainFor-CoolTemWetFor), cool temperate wet forest, cool temperate rain forest, and boreal rain forest (CoolTemWeFor- CoolTemRainFor-BorealRainFor), cool temperate wet forest, cool temperate rain forest, and warm temperate wet forest (CoolTemWetFor-CoolTemRainFor-WarmTemWetFor), subtropical desert, subtropical desert scrub, and tropical desert scrub (SubtroDes-SubtroDesScr-TroDesScr), and subtropical moist forest, subtropical wet forest, and tropical moist forest (SubtroMoistFor-SubtroWetFor-TroMoistFor) only covered about 2% of the total area of ETZs in China, and were mostly distributed in the Qinghai-Tibet Plateau region.

3.2 Changes in the area of ETZs

The ETZ simulation results under the RCP2.6, RCP4.5, and RCP8.5 scenarios in China (Table 2 and Figures 2-4) revealed a series of different changing trends during the periods from 2011 to 2100.
Figure 2 Spatial distribution of ecological transition zones (ETZs) under the RCP2.6 scenario
Under the RCP2.6 scenario, the BorealWetFor-BorealRainFor-CoolTemWetFor, CoolTemWetFor-CoolTemRainFor-BorealRainFor, SubtroDes-SubtroDesScr-TroDesScr, SubtroDesScr-SubtroThornSte-TroThornFor, SubtroThornWood-SubtroDryFor-TroVeryDryFor transition zones would disappear in the future. The BorealMoistFor-BorealWetFor- CoolTemMoistFor, WarmTemDes-WarmTemDesScr-CoolTemDes, and CoolTemDesScr- CoolTemSte-WarmTemThornSte transition zones had the largest increase in area, with increases of 114,836, 87,608, and 82,160 km2 between the T0 and T3 periods, respectively. The WarmTemthornDesScr-WarmTemDryFor-CoolTemSte, Peri-Nival-AlpColdMea, and CoolTemSte-CoolTemMoistFor-BorealMoistFor transition zones had the largest decrease in area, with decreases of 65,967, 61,577, and 51,623 km2, respectively. The Fri-Peri-AlpColdSte and WarmTemDesScr-WarmTemThornSte-CoolTemDesScr transition zones had the fastest rate of increase in area, with decadal rates of increase of 144% and 101%, respectively. The BorealWetFor-BorealRainFor-BorealRainTundra and SubtroMoistFor-SubtroWetFor-TroMoistFor transition zones had the fastest rate of decrease, with decadal rates of decrease of 9.9% and 9.6%, respectively.
Table 2 Areas in different ecological transition zones (ETZs) under the three scenarios of RCP2.6, RCP4.5, and RCP8.5 during the periods from T0 to T3 (km2)
ETZ
type code
T0 RCP 2.6 RCP 4.5 RCP 8.5
T1 T2 T3 T1 T2 T3 T1 T2 T3
1 0 18 11 28 33 20 16 19 12 4
2 0 331 319 186 359 234 60 358 44 8
3 0 112 61 44 99 82 32 106 36 6
4 4133 2523 1929 2252 2249 1362 1255 2311 1251 177
5 69 1733 1621 1066 2043 1487 444 1937 235 21
6 67207 10165 5417 5630 9968 2705 2324 9085 2328 1271
7 0 496 569 85 494 503 38 462 33 0
8 21710 11833 8575 10436 11382 6306 5947 10986 6176 1778
9 50942 61529 54199 57642 56865 39831 35050 58659 30123 3972
10 6226 8108 7560 4602 7505 7651 3534 6888 1899 51
11 42813 72193 62699 63182 77481 51897 33686 74401 29872 9700
12 51665 60798 74726 76468 56264 81194 91293 57836 86511 64255
13 3698 2938 2566 1301 3330 2810 891 3097 568 9
14 33304 43970 35350 28835 44576 26912 22438 39653 26194 20468
15 53039 104570 121523 125735 105814 129326 145756 109206 147273 124791
16 20394 10 16 14 14 1 27 14 15 414
17 14482 16502 13437 13794 17491 11940 11067 15377 10001 3115
18 31289 45109 46366 43487 39986 50052 53911 40208 57198 32904
19 52387 135375 135381 167223 152001 164383 160644 151677 152096 182743
20 5537 0 0 0 0 21 21 0 15 14
21 13194 22047 18090 14887 20233 9779 5739 17244 4532 2311
22 63353 42135 42346 47085 45189 44690 46499 47416 45579 28390
23 148436 108981 102719 96813 104815 91829 77895 106336 86948 58513
24 21484 2006 4495 2412 1909 2212 5104 1702 1580 9054
25 186 0 0 0 0 0 0 0 0 0
26 130080 145120 136429 143718 143769 105773 102151 150962 92610 23052
27 49453 107082 126616 131613 116791 144363 139982 120822 144384 119965
28 206067 247976 236233 227930 215464 268572 267315 215277 230023 200860
29 37587 5908 7822 2878 204 1386 3071 133 315 1645
30 17 43 32 32 39 11 3 41 3 0
31 17491 107649 119337 105099 92396 114786 145654 104675 152720 101876
32 3540 21099 32599 39582 23460 70216 104171 26351 115379 175955
33 98325 19043 29874 32358 27524 50384 46884 28507 102668 167583
34 221686 226182 188416 212098 239735 163580 154365 225159 132460 132566
35 15214 6769 3878 4046 6482 2097 1362 6260 1291 16
37 0 0 0 0 0 0 0 0 0 884
38 13 0 0 0 0 0 0 0 0 0
39 62 0 0 0 0 0 0 0 0 0
40 65438 40014 39494 36285 48298 89004 109617 66368 237548 515481
41 25166 364 3349 1005 3 2304 5937 0 2991 7498
47 18348 39697 55697 54925 41424 85862 134610 42064 157828 317434
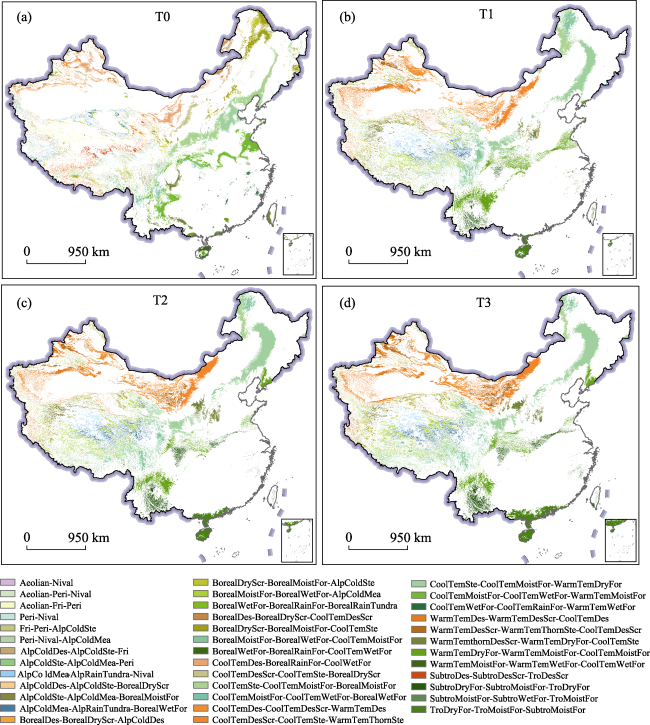
Figure 3 Spatial distribution of ecological transition zones (ETZs) under the RCP4.5 scenario
Under the RCP4.5 scenario, the CoolTemWetFor-CoolTemRainFor-BorealRainFor, SubtroDes-SubtroDesScr-TroDesScr, SubtroDesScr-SubtroThornSte-TroThornFor, and SubtroThornWood-SubtroDryFor-TroVeryDryFor transition zones may disappear in the future. The WarmTemDes-WarmTemDesScr-CoolTemDes,TroDryFor-TroMoistFor-SubtroMoistFor, and BorealMoistFor-BorealWetFor-CoolTemMoistFor transition zones had the largest increase in area, with increases of 128,163, 116,262, and 108,257 km2 between T0 and T3, respectively. The CoolTemSte-CoolTemMoistFor-BorealMoistFor, WarmTemDryFor-War mTemMoistFor-CoolTemMoistFor, and Peri-Nival-AlpColdMea transition zones had the largest decrease in area, with decreases of 70,541, 67,321, and 64,883 km2, respectively. The WarmTemDesScr-WarmTemThornSte-CoolTemDesScr and WarmTemDes-WarmTem Des Scr-CoolTemDes transition zones had the fastest rates of increase, with decadal rates of increase of 284% and 73%, respectively. The area in the BorealWetFor-BorealRainFor-Bo realRainTundra and BorealWetFor-BorealRainFor-CoolTemWetFor transition zones decreased by 9.9% per decade from 2011 to 2100.
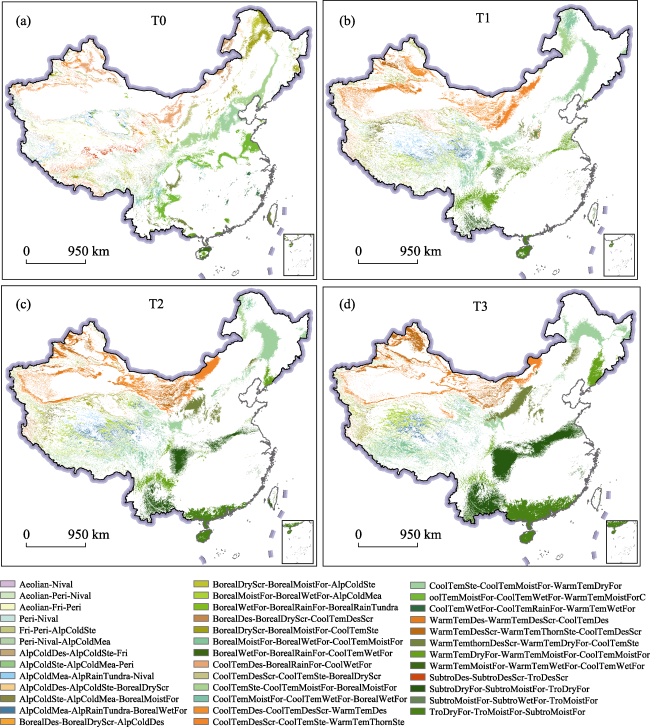
Figure 4 Spatial distribution of ecological transition zones (ETZs) under the RCP8.5 scenario
Under the RCP8.5 scenario, the CoolTemWetFor-CoolTemRainFor-BorealRainFor, SubtroDesScr-SubtroThornSte-TroThornFor, and SubtroThornWood-SubtroDryFor-TroVery DryFor transition zones would disappear in the future. The SubtroDryFor-SubtroMoistFor- TroDryFor, TroDryFor-TroMoistFor-SubtroMoistFor, and WarmTemDesScr-WarmTem ThornSte-CoolTemDesScr transition zones had the largest increase in area, with an increase of 450,043, 299,086, and 172,415 km2 between T0 and T3, respectively. The CoolTemDes- CoolTemDesScr-WarmTemDes, CoolTemSte-CoolTemMoistFor-BorealMoistFor, and WarmTemDryFor-WarmTemMoistFor-CoolTemMoistFor transition zones had the largest decrease in area, with a decrease of 107,028, 89,923, and 89,120 km2, respectively. The WarmTemDesScr-WarmTemThornSte-CoolTemDesScr and TroDryFor-TroMoistFor-SubtroMoistFor transition zones had the fastest rates of increase, with decadal rates of increase of 487% and 163%, respectively. The WarmTemMoistFor-WarmTemWetFor-CoolTemWetFor, Boreal Des-BorealDryScr-AlpColdDes, and BorealWetFor-BorealRainFor-CoolTemWetFor transition zones had the fastest rates of decreasing, with decadal rates of increase of 9.9% per decade.

3.3 Spatial shift of mean center in different ETZs

The ETZ simulation results showed that the mean center of the different ETZ types would be significantly different under the RCP2.6, RCP4.5, and RCP8.5 scenarios (Tables 3-5 and Figure 5). There were 15, 27, and 31 ETZ types for which the mean center shifted by more than 50 km under the RCP2.6, RCP4.5, and RCP8.5 scenarios, respectively.
Table 3 Trends in the spatial shift (km) of mean center in ecological transition zones (ETZs) under the RCP2.6 scenario
ETZ type code T0-T1 T1-T2 T2-T3
Shift distance Shift direction Shift distance Shift direction Shift distance Shift direction
1 575.89 Southeast 158.44 West
2 36.46 North 364.35 Southeast
3 524.49 Northwest 440.09 Southeast
4 313.37 West 45.65 Northwest 33.72 West
5 163.57 Northeast 204.43 Northwest 80.98 Southeast
6 75.23 South 111.08 Northwest 34.18 Southwest
7 62.35 East 183.79 Northwest
8 344.76 West 9.82 Northeast 34.16 South
9 65.01 North 66.15 West 3.16 Northeast
10 114.76 Northwest 102.64 Northwest 80.54 Northwest
11 133.99 South 90.37 Northwest 25.27 South
12 265.35 Northeast 75.64 West 10.24 East
13 221.60 West 33.91 Northwest 23.62 West
14 226.46 Southwest 72.05 Northwest 153.18 Northwest
15 171.44 Southeast 110.42 West 36.23 Southeast
16 2827.93 Northeast 251.73 Southwest 251.45 Northeast
17 289.66 Southwest 134.86 West 218.66 West
18 447.75 South 64.87 Southwest 127.80 North
19 119.67 Southeast 150.92 Southwest 197.31 South
21 86.68 Southeast 56.18 Southwest 97.37 Southwest
22 981.11 Southwest 167.08 Southwest 30.74 Northeast
23 533.87 Southwest 66.24 West 309.09 Northeast
24 2268.19 Northeast 843.93 Southwest 1032.88 Northeast
26 54.23 Southwest 18.27 West 9.99 Southeast
27 101.50 Northeast 38.75 Northwest 167.87 East
28 216.51 Northeast 101.74 Northeast 72.23 Northeast
29 160.22 West 20.78 West 46.98 North
30 766.46 Southeast 13.12 South 0.00
31 259.19 Southeast 95.16 Southeast 44.37 Northwest
32 839.21 North 415.56 Southeast 112.89 Northwest
33 294.23 Southwest 48.46 Northwest 21.06 Southeast
34 220.07 Southwest 52.50 North 19.88 Northwest
35 378.48 East 35.47 Southeast 9.45 Southeast
40 488.65 Northwest 48.12 Northeast 381.42 South
41 641.45 Northeast 216.49 Northeast 169.64 Northeast
47 29.03 Northwest 61.20 North 2.36 South
Table 4 Trends in the spatial shift (km) of mean center in ecological transition zones (ETZs) under the RCP4.5 scenario
ETZ type code T0-T1 T1-T2 T2-T3
Shift distance Shift direction Shift distance Shift direction Shift distance Shift direction
1 293.08 East 123.63 South
2 36.08 Northeast 279.36 Southeast
3 473.97 Northwest 494.86 Southeast
4 320.13 West 52.11 Northwest 57.99 West
5 170.54 East 203.39 Northwest 70.2 Southeast
6 87.43 South 237.81 West 161.8 Northwest
7 120.74 Northwest 104.33 South
8 321.52 West 28.5 North 112.16 Northwest
9 64.65 North 115.89 Northwest 71.13 Northwest
10 170.76 Northwest 119.2 Northwest 33.71 West
11 131.38 South 114.57 Northwest 101.63 Northwest
12 268.45 Northeast 149.39 West 95.55 West
13 226.55 West 28.13 North 54.75 West
14 217.42 Southwest 248.67 West 175.08 Northwest
15 213.48 Southeast 120.03 Northwest 119.29 West
16 2827.64 Northeast 2225.08 Southwest 60.36 South
17 384.24 West 372.57 West 72.11 Southwest
18 325.97 Southwest 234.82 South 52.36 South
19 174.34 South 432.43 Southwest 308.11 Southwest
20 0.28 Northeast
21 69.1 South 377.76 Southwest 412.93 Southwest
22 919.58 Southwest 332.35 Southwest 150.7 Southwest
23 445.81 Southwest 260.71 Southwest 155.94 Southwest
24 2650.17 Northeast 179.94 Southwest 1561.57 Southwest
26 63.85 West 82.43 West 57.92 Southwest
27 306.92 East 146.99 Northwest 140.7 Northwest
28 320.71 Northeast 191.07 Northeast 24.79 Northwest
29 153.5 Northwest 214.07 West 103.68 West
30 768.54 Southeast 19.08 North 24.07 North
31 235.48 Southeast 346.37 East 67.52 Southeast
32 743.09 North 664.54 Southeast 20.01 North
33 274.56 Southwest 99.58 Northwest 89.56 Northwest
34 322.29 Southwest 137.42 Northeast 76.99 Northeast
35 384.46 East 105.23 Southeast 94.5 Southeast
40 556.84 West 253.32 Northeast 108.94 Northeast
41 1017.64 Northeast 58.91 Southeast 7.72 Northeast
47 34.71 Northwest 136.54 Northeast 74.47 North
Table 5 Trends in the spatial shift (km) of mean center in ecological transition zones (ETZs) under the RCP8.5 scenario
ETZ type code T0-T1 T1-T2 T2-T3
Shift distance Shift direction Shift distance Shift direction Shift distance Shift direction
1 122.27 Southeast 333.54 West
2 930.5 Southeast 285.74 Southeast
3 297.21 Southeast 81.38 East
4 326.75 West 136.14 Northwest 64.26 South
5 173.46 East 246.25 Southeast 840.32 Southeast
6 86.9 South 445.58 Northwest 133.04 Northwest
7 295.09 Southeast
8 333.53 West 147.15 Northwest 78.14 West
9 67.49 North 185.05 Northwest 150.35 Northwest
10 189.19 Northwest 76.72 West 74.34 South
11 137.95 South 239.1 Northwest 265.65 Northwest
12 280.61 Northeast 257.8 West 290.64 West
13 224.04 West 79.49 Southwest 50.82 Northwest
14 259.6 Southwest 386.82 Northwest 113.5 Northwest
15 196.98 Southeast 202.81 Northwest 299.93 Northwest
16 2827.64 Northeast 2282.75 Southwest 206.86 South
17 479.18 West 346.49 Southwest 49.96 West
18 326.78 Southwest 349.86 South 428.34 Southwest
19 231.84 South 727.43 Southwest 656.35 West
20 1.12 South
21 100.83 South 1140.32 Southwest 89.01 Northwest
22 956.6 Southwest 508.54 Southwest 719.47 Southwest
23 389.8 Southwest 791.86 Southwest 1331.83 Southwest
24 2649.15 Northeast 744.07 Southwest 1838.76 Southwest
26 64.76 West 206.18 West 427.11 West
27 289.31 Northeast 278.89 Northwest 378.4 West
28 364.48 Northeast 312.33 Northeast 176.63 North
29 153.47 Northwest 267.16 West 138.46 North
30 767.04 Southeast 39.75 North
31 260.29 Southeast 388.81 East 189.04 East
32 720.01 North 631 Southeast 250.86 Northwest
33 280.88 Southwest 215.3 Northwest 137.05 North
34 349.58 Southwest 165.45 North 953.92 Northeast
35 401.18 East 232.65 Southeast 202.82 Southeast
40 510.16 West 418.01 Northeast 128.65 Northeast
41 13.76 Northwest
47 36.96 Northwest 233.08 Northeast 102.5 North
The mean center of the AlpColdDes-AlpColdSte-BorealDryScr, AlpColdSte-AlpColdMea- BorealMoistFor, and BorealDryScr-BorealMoistFor-AlpColdSte transition zones shifted toward the northwest. The mean center of the BorealDryScr-BorealMoistFor-CoolTemSte, BorealMoistFor-BorealWetFor-CoolTemMoistFor, CoolTemDes-BorealRainFor-CoolWetFor, CoolTemDesScr-CoolTemSte-BorealDryScr, and CoolTemSte-CoolTemMoistFor-BorealMoistFor transition zones moved toward the southwest. The mean center of the AlpColdMea-AlpRainTundra-Nival and TroDryFor-TroMoistFor-SubtroMoistFor transition zones moved toward the northwest, and their original distribution area was replaced by other ETZ types. In general, the shift distance of the BorealDryScr-BorealMoistFor-AlpColdSte, BorealDes-BorealDryScr-CoolTemDesScr, BorealDryScrBorealMoistFor-CoolTemSte, BorealMoistFor-BorealWetFor-CoolTemMoistFor, CoolTemDesScr-CoolTemSte-BorealDryScr, C oolTemSte-CoolTemMoistFor-BorealMoistFor, CoolTemWetFor-CoolTemRainFor-WarmT emWetFor, WarmTemDesScr-WarmTemThornSte-CoolTemDesScr, and SubtroDryFor-Sub troMoistFor-TroDryFor transition zones was larger than that of the other ETZs, with a shift in mean center of more than 150 km per period between T0 and T3. The ETZs listed above were therefore more sensitive to climate change than other ETZs under the same climate change conditions.
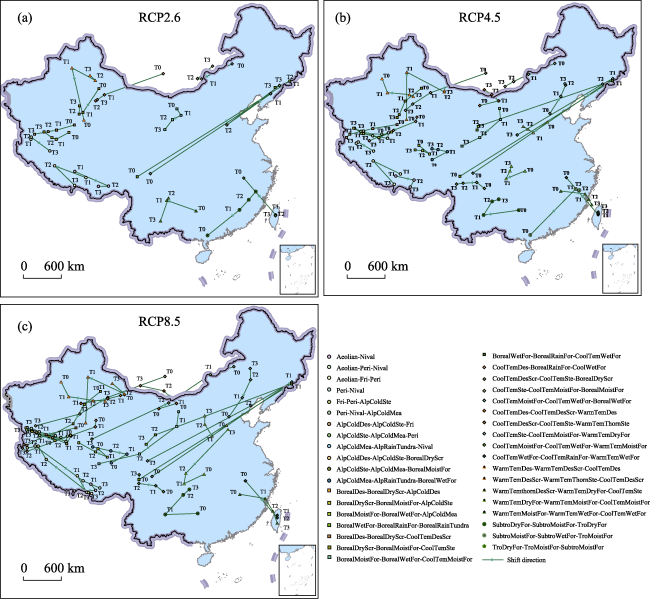
Figure 5 Trends in the spatial shift of mean center in different ecological transition zones (ETZs) under the RCP2.6, RCP4.5, and RCP8.5 scenarios during the periods from T0 to T3

3.4 Comparative analysis of different ETZ types under the three scenarios of RCP2.6, RCP4.5, and RCP8.5

The simulated spatio-temporal changes of the ETZ under the RCP2.6, RCP4.5, and RCP8.5 scenarios showed that the spatial distribution and mean center of ETZs in China presented different trends under the different climate scenarios during the periods from T0 to T3. The areas of the Peri-Nival, Peri-Nival-AlpColdMea, AlpColdSte-AlpColdMea-Peri, and WarmTemMoistFor-WarmTemWetFor-CoolTemWetFor transition zones displayed a continuously decreasing trend, while the area of the TroDryFor-TroMoistFor-SubtroMoistFor transition zone continued to increase under the RCP4.5 and RCP8.5 scenarios from 2011 to 2100. The area of the BorealMoistFor-BorealWetFor-CoolTemMoistFor transition zone continued to increase under the three scenarios from T0 to T3, except under the RCP4.5 scenario between T2 and T3. The areas of the AlpColdSte-AlpColdMea-BorealMoistFor and BorealMoistFor-BorealWetFor-AlpColdMea transition zone displayed a continuously increasing trend under the three scenarios from T0 to T3, except under the RCP8.5 scenario between T2 and T3. Under the RCP2.6, RCP4.5, and RCP8.5 scenarios, the areas of the BorealDes-BorealDryScr-AlpColdDes and CoolTemSte-CoolTemMoistFor-BorealMoistFor transition zones continued to decrease, and the area of the WarmTemDesScr-WarmTemThornSte-CoolTemDesScr transition zones continued to increase during the periods from T1 to T3.
The area of the alpine cold ETZ types accounted for about 20% of the total area of ETZs in China, with most displaying a decreasing trend, and even disappearing over time, although a few alpine cold ETZ types did increase under the three scenarios from 2011 to 2100. For example, the areas in the Aeolian-Nival, Aeolian-Fri-Peri, and AlpColdDes- AlpColdSte-Fri transition zones were all less than 50 km2, and the AlpColdDes- AlpColdSte-Fri transition zone disappeared under the RCP8.5 scenario in the T3 period.
In addition, under the three scenarios, the distances of the shift in the mean center of the BorealDryScr-BorealMoistFor-AlpColdSte, BorealDes-BorealDryScr-CoolTemDesScr, BorealDryScr-BorealMoistFor-CoolTemSte, BorealMoistFor-BorealWetFor-CoolTemMoist For, CoolTemDesScr-CoolTemSte-BorealDryScr, CoolTemSte-CoolTemMoistFor-Boreal MoistFor, CoolTemWetFor-CoolTemRainFor-WarmTemWetFor, CoolTemDesScr-Cool TemSte-WarmTemThornSte, and SubtroDryFor-SubtroMoistFor-TroDryFor transition zones was larger than that for other ETZ types, with all of them being more than 150 km between any two periods from T0 to T3. These ETZ types had a higher sensitivity to climate change than the other ETZ types from 2011 to 2100.

4 Discussion and conclusions

4.1 Discussion

The resolution and accuracy of MAB, TAP, and PER directly affects the reliability of results simulated by ETZ spatial identification methods (Fan et al., 2013a). In this study, the HASM method (Yue, 2011; Yue et al., 2020) was introduced to simulate the spatial distribution of MAB, TAP, and PER, which effectively ensured the accuracy and quality of the climate parameters adopted in the ETZ spatial identification method.
The limitations in the existing ETZ analysis models were overcome by developing a novel ETZ spatial identification method. The existing models cannot effectively identify the boundaries of multiple ETZ types, and are limited to recognizing the abrupt boundary between two ecosystem types (Nicholas et al., 2011; Danz et al., 2013; Sarneel et al., 2014). The ETZ spatial identification method developed in this study was used to identify the 49 surface terrain ETZ types in China, and ETZ simulations under different climate scenarios were conducted based on MAB, TAP, and PER spatial grid data.
With an increase in biotemperature, the areas of alpine cold ETZ types have been reported to display a decreasing trend in China from 2011 to 2100 (Fan and Fan, 2019), especially in the Qinghai-Tibet Plateau, which was verified in the present study by the simulated ETZ changes under the RCP2.6, RCP4.5, and RCP8.5 scenarios during the periods from T0 to T3. The area of ice and snow is projected to reduce due to melting under future global warming (Fan et al., 2019). Under these conditions soil moisture will increase, which will lead to a shift of alpine cold ETZ types toward their adjacent areas (Fan et al., 2013a). The mean centers of arid ETZ types have been predicted to shift toward the southwest with an increase in the temperature and evapotranspiration ratio (Fan and Fan, 2019). In general, the alpine cold and arid ETZ types had a higher sensitivity to climate change than other ETZ types during the period from 2011 to 2100.
The vegetation distribution and land cover is more easily changed in an ETZ than in the adjacent region under similar climate change conditions (Smith et al., 1997; Chapin et al., 2000; Mayle et al., 2000), and is also easily disturbed by human activities (Fan et al., 2013b). Most of the agriculture and animal husbandry transition zones in China are located in ETZ regions, where the intensity and amplitude of changes between cultivated land and grassland are higher than in adjacent regions. Under the effects of agricultural and animal husbandry production, forest and fruit planting, and eco-tourism, the vegetation and land cover in water conservation areas and basic farmland aeras would be changed more than that in other ETZ regions (Shi et al., 2017).
The aim of the ETZ spatial identification method was to identify and explain the spatio-temporal changing trends of ETZ types driven by different climate change scenarios, which could be used to effectively reveal the sensitivity of different ETZ types to the effects of climate change. However, because its main focus was on the effects of climate change on the ETZs, the effects of human activities on ETZ change still need to be evaluated in future studies.

4.2 Conclusions

The simulated ETZ results in China showed that the ETZ spatial identification method based on the iHLZ model could be used to effectively recognize the boundaries of different ETZ types and their spatial distribution patterns in China. A spatial shift of mean center model was used to determine the shift distance and direction of each ETZ type. Under the RCP2.6, RCP4.5, and RCP8.5 climate scenarios, the CoolTemSte-CoolTemMoistFor- WarmTemDryFor, WarmTemDryFor-WarmTemMoistFor-CoolTemMoistFor, and BorealMoistFor- BorealWetFor-CoolTemMoistFor transition zones were the three largest ETZ types in China, with average areas of 564,238.5, 566,549.75, and 525,750.25 km2, respectively, and their total area accounted for one-third of the whole ETZ area. The WarmTemDesScr-WarmTemThornSte-CoolTemDesScr transition zone had the largest increase in area, with an increase in area under the three scenarios of 3604.2, 10,063.1, and 17,242 km2 from 2011 to 2100, respectively. The change intensity of the ETZ distribution was the largest under the RCP8.5 scenario, followed by the RCP4.5 scenario, and the lowest under the RCP2.6 scenario. The BorealDes-BorealDryScr-AlpColdDes, Peri-Nival-AlpColdMea, and WarmTemMoistFor-WarmTemWetFor-CoolTemWetFor transition zones had the fastest rate of increase in area among the ETZ types in China under the RCP2.6, RCP4.5, and RCP8.5 scenarios, respectively, from 2011 to 2100.
1
Bestelmeyer B T, Wiens J A, 2001. Local and regional-scale responses of ant diversity to a semiarid biome transition zone. Ecography, 24:381-392.

DOI

2
Biermann F, 2007. ‘Earth system governance’ as a crosscutting theme of global change research. Global Environmental Change-Human Policy Dimension, 17(3/4):326-337.

DOI

3
Breshears D D, Cobb N S, Rich P M et al., 2005. Regional vegetation die-off in response to global-change-type drought. Proceedings of the National Academy of Sciences of the United States of America, 102(42):15144-15148.

4
Caneva G, Bartoli F, Savo V et al., 2016. Combining statistical tools and ecological assessments in the study of biodeterioration patterns of stone temples in Angkor (Cambodia). Scientific Reports, 6:32601.

DOI PMID

5
Castri F, Hansen A J, Holland M M, 1988. A New Look at Ecotones. Biology International, Special Issue 17. Paris: International Union of Biological Sciences.

6
Chapin II I F S, Zavaleta E S, Eviner V T et al., 2000. Consequences of changing biodiversity. Nature, 405:234-242.

PMID

7
Clements F C, 1905. Research Methods in Ecology. Lincoln: University Publishing Corporation.

8
Danz N P, Frelich LE, Reich P B et al., 2013. Do vegetation boundaries display smooth or abrupt spatial transitions along environmental gradients? Evidence from the prairie-forest biome boundary of historic Minnesota, USA. Journal of Vegetation Science, 24:1129-1140.

DOI

9
Fan Z M, Bai R Y, Yue T X, 2019. Spatio-temporal distribution of vascular plant species abundance on Qinghai-Tibet Plateau. Journal of Geographical Sciences, 29(10):1625-1636.

DOI

10
Fan Z M, Fan B, 2019. Shifts of the mean center of potential vegetation ecosystems under future climate change in Eurasia. Forests, 10(10):873.

DOI

11
Fan Z M, Li J, Yue T X, 2013a. Land-cover changes of biome transition zones in Loess Plateau of China. Ecological Modelling, 252(1):129-140.

DOI

12
Fan Z M, Li J, Yue T X et al., 2015. Scenarios of land cover in karst area of southwestern China. Environmental Earth Sciences, 74:6407-6420.

DOI

13
Fan Z M, Zhang X, Li J et al., 2013b. Land-cover changes of national nature reserves in China. Journal of Geographical Sciences, 23(2):258-270.

DOI

14
Feddema J J, Oleson K W, Bonan G B et al., 2005. The importance of land-cover change in simulating future climates. Science, 310(5754):1674-1678.

DOI

15
Ferro I, Morrone J J, 2014. Biogeographical transition zones: A search for conceptual synthesis. Biological Journal of the Linnean Society, 113:1-12.

DOI

16
Gao H W, 1994. Advancement of theoretical research in ecotone. Chinese Journal of Ecology, 13(1):32-38. (in Chinese)

17
Gosz J R, 1993. Ecotone hierarchies. Ecological Application, 3(3):369-376.

DOI

18
Guan K Y, Pan M, Li H B et al., 2015. Photosynthetic seasonality of global tropical forests constrained by hydroclimate. Nature Geoscience, 8:284-289.

DOI

19
Holland M M, 1988. SCOPE/M AB technical consultations on landscape boundaries: Report on an ACOPE/MAB Workshop on Ecotones. Biology International, 17:47-106.

20
Li S J, Sun Z G, Tan M H, 2018. Changing patterns in farming-pastoral ecotones in China between 1990 and 2010. Ecological Indicators, 89:110-117.

DOI

21
Loehle C, 2018. Disequilibrium and relaxation times for species responses to climate change. Ecological Modelling, 384:23-29.

DOI

22
Ma S J, 1990. A Perspective of Modern Ecology. Beijing: Science Press. (in Chinese)

23
Marín V H, 2007. Toward conceptual cohesiveness: A historical analysis of the theory and utility of ecological boundaries and transition zones. Ecosystems, 10:462-476.

DOI

24
Marshall C J, Liebherr J K, 2000. Cladistic biogeography of the Mexican transition zone. Journal of Biogeography, 27(1):203-216.

DOI

25
Mayle F E, Beerling D J, Gosling W D et al., 2004. Responses of Amazonian ecosystems to climate and atmospheric carbon dioxide changes since the Last Glacial Maximum. Philosophical Transactions of the Royal Society B: Biological Sciences, 359:499-514.

DOI

26
Mayle F E, Burbridge R, Killeen T J, 2000. Millennial-scale dynamics of southern Amazonian rain forests. Science, 290(22):2291-2294.

DOI

27
Nicholas A M M, Franklin D C, Bowman D M J S, 2011. Floristic uniformity across abrupt boundaries between Triodia hummock grassland and Acacia shrubland on an Australian desert sandplain. Journal of Arid Environments, 75:1090-1096.

DOI

28
Niu W Y, 1989. The discriminatory index with regard to the weakness, overlapness, and breadth of ecotone. Acta Ecologica Sinica, 9(2):97-105. (in Chinese)

29
Pauli H, Gottfried M, Dullinger S et al., 2012. Recent plant diversity changes on Europe’s mountain summits. Science, 336(20):353-355.

DOI

30
Peteet D, 2000. Sensitivity and rapidity of vegetational response to abrupt climate change. Proceedings of the National Academy of Sciences of the United States of America, 97(4):1359-1361.

31
Reich P B, Sendall K M, Rice K et al., 2015. Geographic range predicts photosynthetic and growth response to warming in co-occurring tree species. Nature Climate Change, 5(2):148-152.

DOI

32
Rich R L, Stefanski A, Montgomery R A et al., 2015. Design and performance of combined infrared canopy and belowground warming in the B4WarmED (Boreal Forest Warming at an Ecotone in Danger) experiment. Global Change Biology, 21(6):2334-2348.

DOI PMID

33
Sarneel J M, Huig N, Veen G F et al., 2014. Herbivores enforce sharp boundaries between terrestrial and aquatic ecosystems. Ecosystems, 17(8):1426-1438.

DOI

34
Shi W J, Liu Y T, Shi X L, 2017. Quantitative methods for detecting the impacts of climate change on the fluctuation of farming-pastoral ecotone boundaries in northern China. Acta Geographica Sinica, 72(3):407-419. (in Chinese)

35
Smith T B, Wayne R K, Girman D J et al., 1997. A role for ecotones in generating rainforest biodiversity. Science, 276(20):1855-1857.

DOI

36
van Vuuren D P, Edmonds J, Kainuma M et al., 2011. The representative concentration pathways: An overview. Climatic Change, 109:5-31.

DOI

37
Wang X Y, Li Y, Chen Y P et al., 2018. Temporal and spatial variation of extreme temperatures in an agropastoral ecotone of northern China from 1960 to 2016. Scientific Reports, 8:8787.

DOI

38
Williamsa A P, Allen C D, Millar C I et al., 2010. Forest responses to increasing aridity and warmth in the southwestern United States. Proceedings of the National Academy of Sciences of the United States of America, 107(50):21289-21294.

39
Wuyts B, Champneys A R, House J I, 2017. Amazonian forest-savanna bistability and human impact. Nature Communication, 8(1):15519.

DOI

40
Xiao Q G, Chen W Y, Du P et al., 1997. Monitoring the ecological transect in East Asia monsoon region by meteorological satellite remote sensing. Acta Botanica Sinica, 39(9):826-830. (in Chinese)

41
Yarrow M M, Salthe S N, 2008. Ecological boundaries in the context of hierarchy theory. BioSystems, 92(3):233-244.

DOI

42
Yue T X, Fan Z M, Liu J Y et al., 2005. Changes of major terrestrial ecosystems in China since 1960. Global and Planetary Change, 48(4):287-302.

DOI

43
Yue T X, Fan Z M, Liu J Y, 2006. Scenarios of major terrestrial ecosystems in China. Ecological Modelling, 199(3):363-376.

DOI

44
Yue T X, Zhao N, Liu Y et al., 2020. A fundamental theorem for eco-environmental surface modelling and its applications. Science China Earth Sciences, 63(8):1092-1112.

DOI

45
Yue T X, Zhao N, Fan ZM et al., 2016. CMIP5 downscaling and its uncertainty in China. Global and Planetary Change, 146:30-37.

DOI

46
Yue T X, 2011. Surface Modelling: High Accuracy and High Speed Methods. New York: CRC Press.

Outlines

/