Research Articles

Spatial and temporal variabilities of rainstorms over China under climate change

  • HUANG Chang 1, 2, 3 ,
  • ZHANG Shiqiang 1, 2, 3 ,
  • DONG Linyao 4 ,
  • WANG Zucheng 5 ,
  • LI Linyi 6 ,
  • CUI Luming 3
Expand
  • 1. Shaanxi Key Laboratory of Earth Surface System and Environmental Carrying Capacity, Northwest University, Xi’an 710127, China;
  • 2. Institute of Earth Surface System and Hazards, Northwest University, Xi’an 710127, China;
  • 3. College of Urban and Environmental Sciences, Northwest University, Xi’an 710127, China;
  • 4. Changjiang River Scientific Research Institute, Wuhan 430010, China
  • 5. State Environmental Protection Key Laboratory of Wetland Ecology and Vegetation Restoration, Institute for Peat & Mire Research, Northeast Normal University, Changchun 130021, China;
  • 6. School of Remote Sensing and Information Engineering, Wuhan University, Wuhan 430070, China

Huang Chang (1986–), PhD and Associate Professor, specialized in hydrological remote sensing. E-mail:

Received date: 2020-04-28

  Accepted date: 2020-12-23

  Online published: 2021-06-25

Supported by

National Key Research and Development Program of China, No(2017YFC1502501)

National Key Research and Development Program of China, No(2017YFC0404302)

National Natural Science Foundation of China, No(41501460)

Copyright

Copyright reserved © 2021. Office of Journal of Geographical Sciences All articles published represent the opinions of the authors, and do not reflect the official policy of the Chinese Medical Association or the Editorial Board, unless this is clearly specified.

Abstract

Rainstorms are one of the extreme rainfall events that cause serious disasters, such as urban flooding and mountain torrents. Traditional studies have used rain gauge observations to analyze rainstorm events, but relevant information is usually missing in gauge-sparse areas. Satellite-derived precipitation datasets serve as excellent supplements or substitutes for the gauge observations. By developing a grid-based rainstorm-identification tool, we used the Tropical Rainfall Measurement Mission (TRMM) Multi-satellite Precipitation Analysis (TMPA) time series product to reveal the spatial and temporal variabilities of rainstorms over China during 1998-2017. Significant patterns of both increasing and decreasing rainstorm occurrences were detected, with no spatially uniform trend being observed across the whole country. There was an increase in the area being affected by rainstorms during the 20-year period, with rainstorm centers shifting along the southwest-northeast direction. Rainstorm occurrence was found to be correlated with local total precipitation. By comparing rainstorm occurrence with climate variables such as the El Niño-Southern Oscillation and Pacific Decadal Oscillation, we also found that climate change was likely to be the primary reason for rainstorm occurrence in China. This study complements previous studies that used gauge observations by providing a better understanding of the spatiotemporal dynamics of China’s rainstorms.

Cite this article

HUANG Chang , ZHANG Shiqiang , DONG Linyao , WANG Zucheng , LI Linyi , CUI Luming . Spatial and temporal variabilities of rainstorms over China under climate change[J]. Journal of Geographical Sciences, 2021 , 31(4) : 479 -496 . DOI: 10.1007/s11442-021-1854-8

1 Introduction

Extreme weather and climate events have happened more frequently in recent decades due to climate change, which has become one of the greatest threats to human society (Wang et al., 2017). Extreme rainfalls are one of the deadliest weather events worldwide, which usually cause serious societal impacts, such as flash flooding, crop destruction, loss of lives, and infrastructure damage (Witze, 2018). Rainstorms, or so-called downpours, are one of the extreme rainfall events that generate a large volume of precipitation within a short period of time. They are even more disastrous due to their suddenness and destructiveness. With rapid urbanization across the world, rainstorm-induced disaster losses are becoming increasingly severe (Chen et al., 2018).
Climate change is causing wide variations in precipitation patterns and intensities over space and time, especially for vast countries such as China. Because of the country’s vast territory that covers multiple climatic zones, weather and climate extremes frequently cause damages, for example, in the form of urban flooding and mountain torrents (Domroes and Schaefer, 2008; Liu et al., 2020). Therefore, changes in total and extreme precipitation have attracted increasing attention (Gemmer et al., 2004). For example, Zhai et al. (2005) used a dataset of daily precipitation observations at 740 gauging stations for the period 1951-2000 to characterize daily precipitation extremes across China. Daily precipitation data collected at 112 meteorological stations over East China were used by Domroes and Schaefer (2008) to characterize the occurrence of rainstorms in the region. A series of similar studies have successively investigated precipitation extremes in other parts of China, including Shaanxi Province (Liu et al., 2013), the Pearl River Basin (Zhao et al., 2014), Tibetan Plateau (Xiong et al., 2019), and the Three-River Headwaters Region (Cao and Pan, 2014), using rain-gauge data. Although conventional rain gauges are considered as the standard apparatus for measuring precipitation, their spatial limitation in point-based measurements and their relatively limited networks worldwide indicate that they cannot accurately reflect the spatial distribution of precipitation. These gauges are distributed so sparsely that there are no precipitation information records for many places, limiting regional hydrological studies. It is becoming increasing important to understand how extreme precipitation impacts a region, and not just a single point location (Saunders et al., 2017).
With the development of remote sensing technology, satellites have become the primary tool for accurately monitoring the global distribution of precipitation (Battaglia et al., 2020). They are particularly useful for the vast oceans and inland remote areas where it is difficult to deploy ground-based sensors. A series of satellite missions, including the Tropical Rainfall Measurement Mission (TRMM) and the Global Precipitation Measurement (GPM), have started to acquire large-scale and continuous precipitation data. Quantitative Precipitation Estimates (QPE) from these satellite-borne sensors provide critical water cycle information at a global scale, and are an essential source of observational data over large areas worldwide, particularly where ground-level rain gauge stations are sparse (Chen and Wang, 2018; Kidd et al., 2017; Zorzetto and Marani, 2020). Their data have become a major source of accurate and continuous precipitation information, mitigating the gap of sparse rain gauge locations by providing spatially continuous gridded products of precipitation data at different resolutions for making alternative or supplementary estimates (Mantas et al., 2015; Chen et al., 2020). A large volume and time series of grid-based precipitation data have been accumulated by different satellite missions. With the launch of the GPM mission in 2014, precipitation information can be estimated by satellites at an unprecedented high spatial resolution (0.1° ´ 0.1°). Different algorithms have been applied to produce a series of precipitation products, such as Integrated Multi-satelliE Retrievals for GPM (IMERG) and Global Satellite Mapping of Precipitation (GSMaP). TRMM products have a relatively low spatial resolution (0.25° ´ 0.25°), but they have accumulated a longer record as the mission was launched in 1997. They can be a valuable data source for studying the long-term spatiotemporal variations in precipitation in recent decades.
In this study, we propose an efficient rainstorm-identification tool that can extract rainstorm events automatically from a time series of gridded precipitation data. The time, magnitude, and duration of rainstorm events are recorded, thereby facilitating the analysis of their seasonality, occurrence, and intensity. Here we employed the TRMM precipitation product as the input to study the spatial and temporal variabilities of China, taking advantage of its unparalleled long record. We generated a set of characteristic maps, including seasonality, occurrence, and intensity maps, to illustrate the spatiotemporal dynamics of rainstorms over the last two decades, 1998-2017, in China. Furthermore, we investigated the uncertainties of using TRMM data to identify rainstorms by comparing these data with those obtained from ground observations. We explored the correlation between rainstorm occurrence and total precipitation volume as well as the connections between rainstorms and climate variables. Although several studies have used gauge observations to study rainstorms in different areas of China, this study is a new attempt that tries to reveal the whole picture of rainstorms in China based on a long time series of satellite precipitation product. It fills the gap of the lack of observational data in gauge-sparse areas, and facilitates the analysis on spatial and temporal variabilities of rainstorm events across the entire country.

2 Materials and methods

2.1 TRMM satellite precipitation data

TRMM was a joint mission by the U.S. National Aeronautics and Space Administration (NASA) and the Japan Aerospace Exploration Agency (JAXA) that aimed to measure the intensity and area coverage of rainfall in the tropical latitudes (50°S-50°N). The TRMM satellite mission ended in April 2015, but the final TRMM multi-satellite precipitation analyses (TMPA, product 3B42/3B43) data processing continued till December 2019, providing a time series of precipitation for over 20 years. In this study, we used the TRMM 3B42 v7 product, which provides relatively high-precision precipitation data at a temporal resolution of 3 hours and a spatial resolution of 0.25° ´ 0.25°. This product maintains the average precipitation centered in the middle of each 3-hour period for each grid. The TRMM 3B42 v7 product time series for the period 1998-2017 was obtained from NASA (https://trmm.gsfc.nasa.gov/data_dir/data.html) and processed as a GeoTiff formatted dataset of the study area via Python programming.

2.2 Meteorological station based precipitation data

Daily precipitation data were acquired by national standard meteorological stations all across China (Figure 1). Of the 740 stations, 522 stations were selected on the basis of their record length and alignment with TRMM grids to ensure that each station had a single set of daily precipitation record for the entire period of 1998-2017 by which to evaluate the reliability of rainstorm identification in the corresponding TRMM grid. All the daily precipitation data were obtained from the National Meteorological Information Center of the China Meteorological Administration (http://www.nmic.gov.cn).
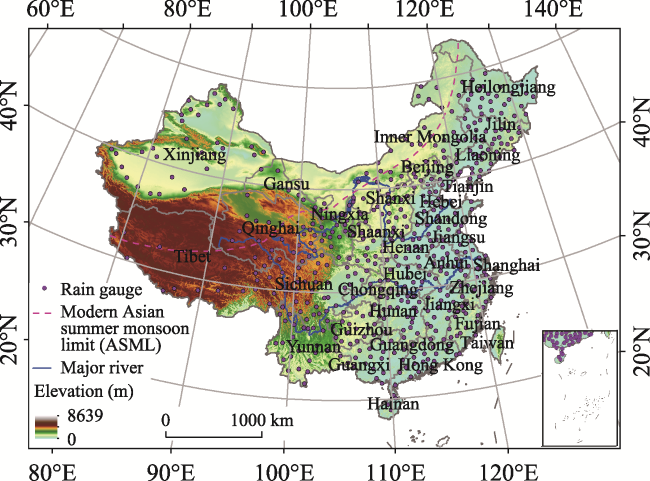
Figure 1 Location and terrain of China with modern Asian summer monsoon limit (ASML) adopted from Chen et al. (2015), and geographical distribution of rain gauge stations

2.3 Extracting rainstorms with rainstorm-identification tool

Using Python programming, we developed a tool that analyzes gridded time series precipitation data to identify rainstorms within each grid. The input precipitation dataset can be interpolated ground observations, reanalysis precipitation data, or satellite-based precipitation data, as long as they are stored in gridded data format with regular time intervals.
As shown in the flow diagram of the rainstorm-identification algorithm (Figure 2), given N grids in the whole study area, rainstorm events are extracted individually for each grid (i=1, 2, 3, … N). The core algorithm for identifying rainstorm events is to examine the time series of each grid from the beginning to the end (t=1, 2, 3, … n), with the time interval (TR) determined by the input temporal resolution of the precipitation dataset. Five variables are initialized as 0 to store the attributes of rainstorm events, including candidate rainfall peak (PCi), time of rainfall peak (Di), rainfall volume (PTi), duration (Ci), and intensity (Li). Intensity is calculated as PTi/Ci, which is also set to 0 at the beginning.
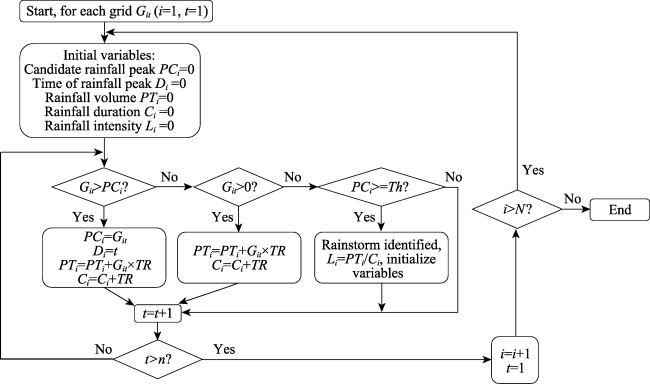
Figure 2 Flow of the rainstorm identification algorithm
The procedure starts at the first grid (i = 1) at the first moment (t = 1) by checking whether precipitation Git > PCi or not. If so, it means that the current moment is more likely to indicate a rainfall peak. In such cases, PCi would be replaced by Git, and the correlated variables including Di, PTi and Ci would also be updated. If 0 < PCi < Git, rainfall is occurring in this grid at this moment (t), and it would be combined into the current rainfall event by updating the PTi and Ci. If Git = 0, this usually means that a rainfall event has ended in this grid. The candidate-rainfall peak is compared with a predefined rainstorm threshold (Th), which, if reached, serves to identify a rainstorm event. All the related variables of the rainstorm event are stored in a data table, which records the position of each grid and can thus be used to map the rainstorms with their information. These variables are then reinitialized to find another rainstorm. The aforementioned procedure is reiterated separately for each individual grid until t = n.
In this study, we used the TRMM 3B42 v7 precipitation dataset from 1998-2017 as the input and set the time interval TR to be 3 hours. The China Meteorological Administration (CMA, 2019) considers rainstorms to be those precipitation events with an hourly rainfall of > 16 mm, a continuous rainfall of > 30 mm in 12 hours, or a 24-hour rainfall of > 50 mm. Accordingly, we set Th with rainfall duration Ci in hours as Equation (1).
$Th=\left\{ \begin{matrix} 16, & {} & {{C}_{i}}<12 \\ 2.5, & 12\le & {{C}_{i}}<24 \\ 2.1, & {} & {{C}_{i}}\ge 24 \\ \end{matrix} \right.$

2.4 Revealing rainstorm occurrence trend via trend analysis

We chose the Mann-Kendall (MK) trend test for analyzing the trend of annual rainstorm occurrence in recent 20 years in this study. This method does not require the samples to follow a specific distribution, and its results are not easily affected by abnormal values (Hirsch and Slack, 1984). The MK method is effective for dealing with abnormal distribution data in many fields, in particular hydrology and meteorology. The trend can be detected successfully when the sample size is over 10 (Yue and Wang, 2004). It is also noted that the existence of serial correlation can alter the variance of the estimate of the MK statistic (Yue et al., 2002). In this study, as the input to the MK method is the annual rainstorm occurrence, which was derived from the precipitation data of each independent year, it is legitimate to assume that there is no autocorrelation in the annual rainstorm occurrence series that would affect the trend analysis results.
To quantify the significance of a trend, we first compute a standardized Z test statistic and then fit the standard normal distribution to the S statistic (Douglas et al., 2000; de Jong et al., 2011). Upward trend would be indicated by a positive Z value, whereas downward trend would have a negative Z value (Neeti and Eastman, 2011). The significance of the trend was further evaluated by comparing the Z value with the referencing value at a given confidence level (α).
To further assess the magnitude of the trend, a nonparametric method called the Theil-Sen approach was employed here (Sen, 1968). This approach provides a more robust slope estimate than the least-squares method because the impact of outliers or extreme values in the time series would be minimized by this approach. The slope calculated by the Theil-Sen estimator represents a robust estimate of the magnitude of a trend. Therefore, it has been commonly used to determine the slopes of trend lines in hydrological time series (Mohsin and Gough, 2010).

2.5 Exploring spatial pattern of rainstorms based on centroids

To reveal the overall distribution of rainstorms, we calculated the centroid coordinates of rainstorm precipitation for each year on the basis of the total rainstorm precipitation volume, as Equations (2) and (3),
${{Y}_{t}}=\frac{\mathop{\sum }_{i=1}^{n}\left( {{C}_{i}}\times {{Y}_{i}} \right)}{\mathop{\sum }_{i=1}^{n}{{C}_{i}}}$
${{X}_{t}}=\frac{\mathop{\sum }_{i=1}^{n}\left( {{C}_{i}}\times {{X}_{i}} \right)}{\mathop{\sum }_{i=1}^{n}{{C}_{i}}}$
where Yt and Xt are the centroid coordinates of rainstorm precipitation at time t, Yi and Xi are the coordinates of grid i that have rainstorms, and Ci is the precipitation volume of grid i.

3 Spatiotemporal dynamics of rainstorms

3.1 Trend of annual rainstorm occurrence

Using the TRMM 3B42 v7 precipitation dataset for 1998-2017 as input, we derived annual rainstorm occurrence in China by applying the rainstorm-identification tool. Figure 3 shows the total rainstorm count during 1998-2017 over China. The area filled with diagonal-line shading is north of 50°N, the northern limit of TRMM data. In this study, this area will be ignored due to missing TRMM data for this area. The map shows an obvious southeast-northwest pattern, with rainstorms occurring mainly in the monsoon region. The highest rainstorm count during the studied 20-year period was >300, which mainly occurred in Guangdong, Guangxi, Jiangxi, Fujian, and Taiwan. In the low-lying area in the southeastern part of Tibet, rainstorm occurrence is also very high, due to the southwesterly monsoon with moisture and heat blowing in from the Indian Ocean.
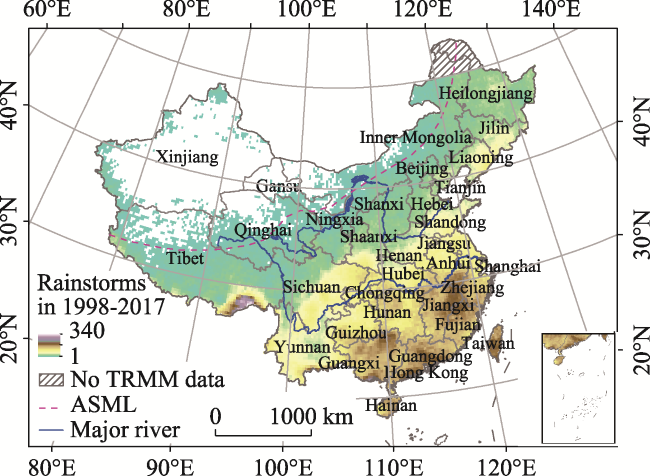
Figure 3 Total count of rainstorms during 1998-2007
To show annual differences in rainstorm occurrence, a rainstorm count map was produced for each year (Figure 4). Although each year differs in rainstorm occurrence distribution, their overall patterns are generally similar. Among these years, 1998, 2012, and 2016 have broader storm coverage and higher storm occurrence in many locations, whereas 2000, 2003, 2004, 2007, and 2009 have smaller coverage and lower occurrence in most areas.
To reveal the trend of annual rainstorm occurrence, we used the MK trend analysis and Theil-Sen’s slope methods to derive the annual rainstorm count series for each grid location. Z values of the trend were compared with the reference values at 90%, 95%, and 99% confidence levels. We then identified grids that showed significant variation in trend at these three confidence levels (Figure 5). The absolute value of the slope indicates the intensity of change, and the sign of the slope represents whether the trend is increasing or decreasing. The changing grids are distributed as belts parallel to the Asian summer monsoon limit (ASML) (Figure 5a). Slightly increasing or decreasing trends were identified close to the summer monsoon limit in the northeast. The slope values of these grids were close to 0, but their significance levels were > 90% or >95%. Toward the south was a belt of significantly decreasing trends with slope values close to -0.5, which means that the rainstorm count in this region was lessening by 0.5 per year from 1998 to 2017. This region includes Shandong, Henan, Sichuan, Yunnan and Tibet. Further south, a belt of significantly increasing trends with slope values as high as 0.4 was identified, which suggests that the rainstorm count was increasing by 0.4 per year during the 20-year period in this region. This area mainly consists of several of the southern provinces, notably Anhui, Guangdong, Guangxi and Hainan. This pattern is similar to the findings by Zeng et al. (2019), who used a 30-year moving window method and proposed that south, east, and northeast China mainly exhibited an increasing trend, while southwest and north China showed a decreasing trend of designed rainstorms.
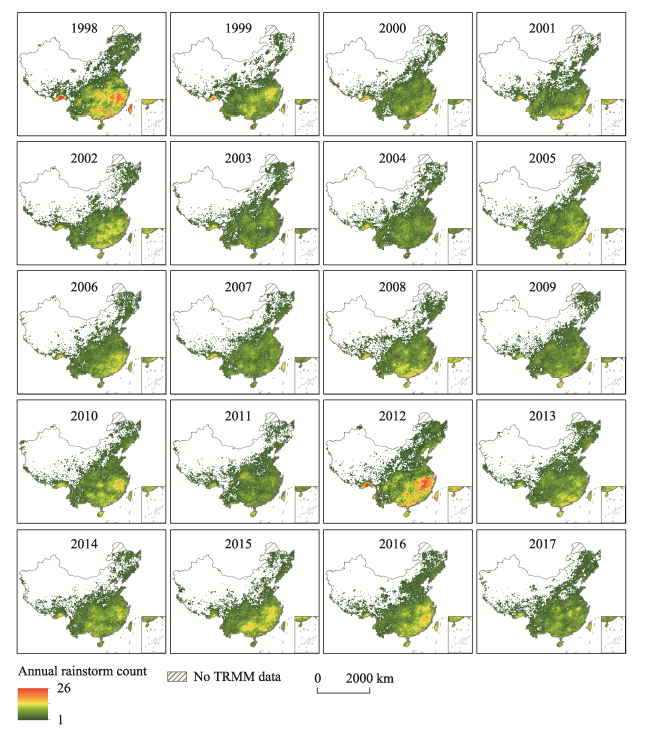
Figure 4 Annual rainstorm count during 1998-2017
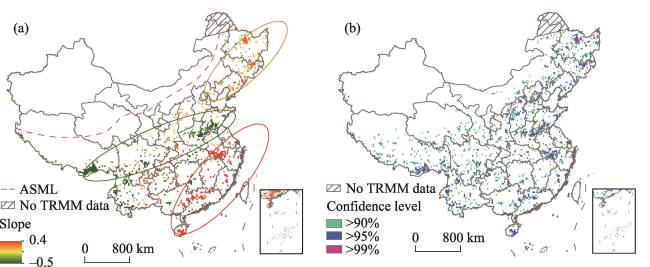
Figure 5 Grids that have significant increasing or decreasing trend of rainstorm occurrence, with the slope of trend shown in (a) and confidence level shown in (b)

3.2 Intensity of the biggest rainstorms

Among all the rainstorm events that have been identified for each grid in the 20-year period, the biggest rainstorm (largest volume of rainfall) was extracted for each individual grid. We mapped its total rainfall volume, maximum instantaneous rainfall, duration, and overall rainfall intensity on a grid basis as in Figure 6. We observed that in the observation period, the biggest rainstorm events reached total rainfall volumes of >800 mm, mainly in the lower latitudes. The maximum instantaneous rainfall of these events reached as high as 78 mm/h, sparsely distributed over the eastern side of the summer monsoon limit. The duration of these biggest rainstorms is polarized, with a large proportion of them less than a day and another large proportion of them more than 4 days. In the areas that are close to the monsoon limit, the biggest rainstorms generally arrive and escalate swiftly and are of short-duration. Other places, such as Jiangxi, Guangdong, and Guangxi, experience rainstorms of longer duration, usually >4 days. We considered the biggest of these rainstorms in each grid as an individual rainfall event and calculated its overall intensity by dividing the total rainfall volume by the duration. We found that the spatial pattern of overall intensity (Figure 6d) is different from that of the total rainfall, the maximum instantaneous rainfall, or the duration.
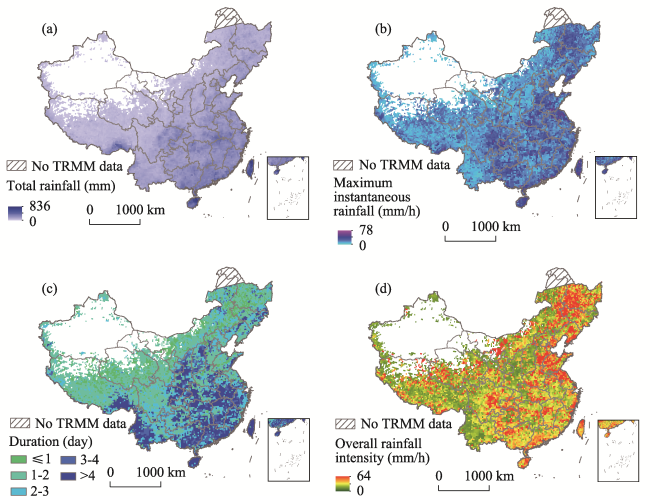
Figure 6 Total rainfall (a), maximum instantaneous rainfall (b), duration (c) and overall rainfall intensity (d) of the biggest rainstorm during 1998-2017
Its peaks occur more broadly than those of the other three. This means that rapid and intense rainstorms not only happen in the abundant-rainfall southeastern region, but also happen in locations close to or even on the other side of the monsoon limit.

3.3 Seasonality of rainstorms

For each rainstorm, the time of its rainfall peak was stored and converted to the day of year (DOY), which was then used to identify in which of the four seasons this rainstorm event occurred. We observed that high rainstorm occurrence happens in the southeastern provinces, including Jiangxi, Zhejiang, Fujian, Guangdong and Guangxi. When we separately compiled rainstorm count by season (Figure 7) through the 20-year period, we found the maximum rainstorm count in spring is as high as 99, while that in summer is over 200, indicating that approximately five rainstorm events happened in each year in spring and over ten rainstorms events in summer. For autumn, the high-occurrence center moved farther south. Wintertime rainstorms are relatively rare during 1998-2017, fewer than 30 rainstorms occurred in winter, and they were mainly in southeastern area.
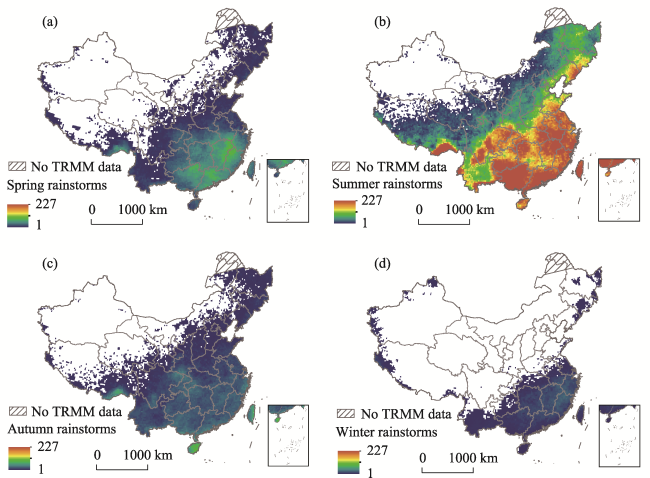
Figure 7 Rainstorm count in spring (a), summer (b), autumn (c) and winter (d) during 1998-2017
Total rainfall volume of the rainstorms in each season (Figure 8) exhibits patterns similar to their counts by season. In some areas, such as Zhejiang, Guangdong and Guangxi provinces, the rainstorm precipitation volume in spring was as high as 10,000 mm in the 20-year period, indicating annual average precipitation of ~500 mm. The rainstorm precipitation volume in summer was over 20,000 mm, and the high volume area is much broader. The high-value center in autumn, which is much smaller than that in summer, moved toward south, mostly in Hainan and Taiwan. In winter, there were only small amounts of rainstorm precipitation, mainly in the southeastern region of China.
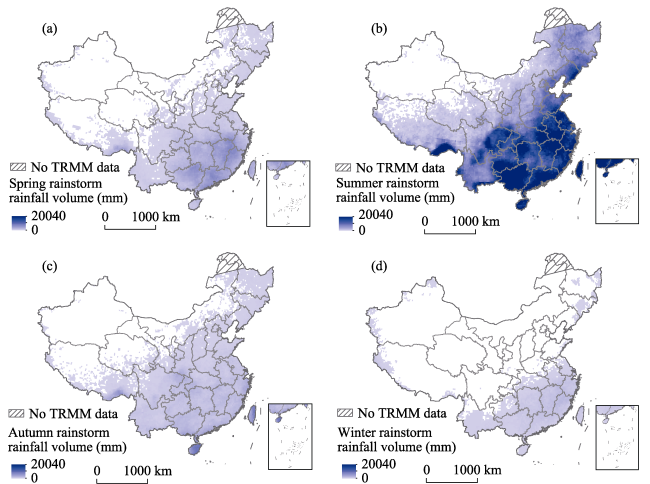
Figure 8 Total rainstorm rainfall volume in (a) spring, (b) summer, (c) autumn and (d) winter during 1998-2017

3.4 Temporal variation of rainstorms

We compiled the total count of grids where rainstorm peaks occurred on each day of a year (Figure 9). The largest number of grids in which rainstorm peaks occurred obviously was around DOY 200 (mid-July). The maximum number of grids that had rainstorm peaks was ~900, representing an area of ~562,500 km2 (Each grid covers an area of 0.25° ´ 0.25°). This means that nearly 6% of the land area in China was experiencing rainstorms on that day.
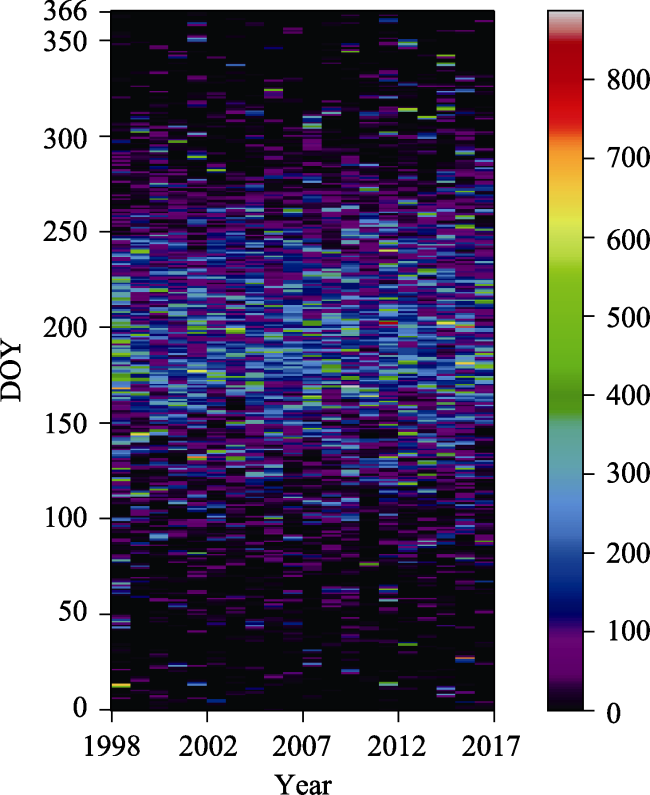
Figure 9 Total count of grids that have rainstorms occurred on each day of year during 1998- 2017
For each year, those grids where at least one rainstorm occurred were marked, and their total number of storms was counted and plotted (Figure 10). The two obvious high peaks (for 1998 and 2012) indicate that rainstorms affected the largest area of China in these two years. Although there is a high peak in 1998, the linear regression suggests an increasing trend of storm grid count, bearing in mind its number fluctuates above and below the regression line. This means that in the recent 20-year period, rainstorms tend to be affecting more areas in China.
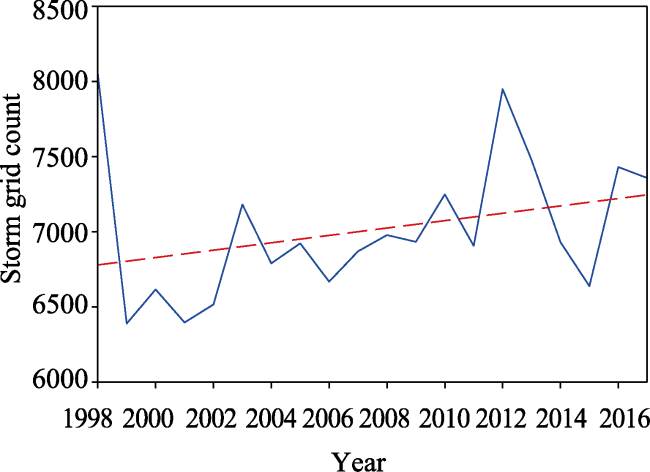
Figure 10 Total count of grids that have rainstorms occurred in each year during 1998-2017
By calculating the centroid coordinates of rainstorm precipitation at each year using Equations (2) and (3), we found that the rainstorm centroids for all the 20 years distributed at the junction of Hubei and Henan provinces (Figure 11), longitude changing from 111.2°E to 113°E, whereas latitude varying from 30.9°N to 33.5°N. Obviously the annual rainstorm centroids are quite unstable over time. From the trajectories shown in Figure 11, it is observed that the centroids shifted mainly along the southwest-northeast direction. For years with relatively more rainstorms, such as 1998 and 2016, their rainstorm centroids tend to be distributed in the northeast part, while for those years with less rainstorms, including 2000 and 2001, their rainstorm centroids tend to be distributed in the southwest part.
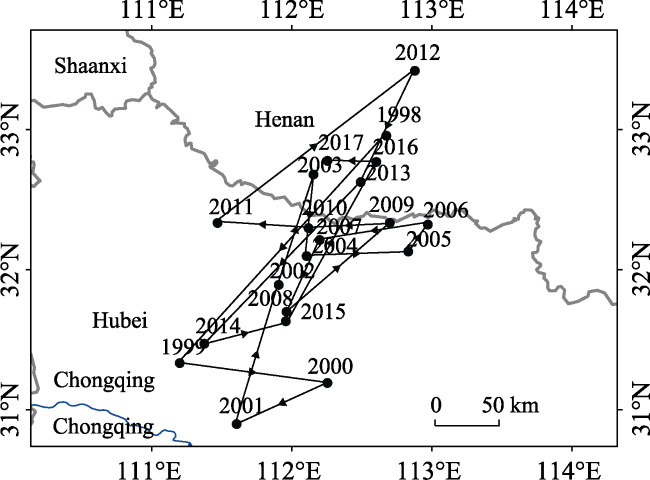
Figure 11 Movement of annual centroids of rainstorm precipitation during 1998-2017

4 Discussion

4.1 Rainstorms identified by satellite data compared with in situ observations

Although TRMM data can provide spatially continuous precipitation information, there are unignorable uncertainties in the data. Many studies have evaluated TRMM data accuracy in China at national and regional scales (Cao et al., 2018; Chen and Li, 2016; Fang et al., 2019; Qin et al., 2014; Wang et al., 2018; Zhang et al., 2018a; Zhang et al., 2018b). It was found that TRMM-3B42RT overestimated the number of rainfall events in the range of 8-128 mm/day. In general, TRMM data overestimated precipitation for eastern Tibet and for most parts of the northwestern arid and semiarid regions of China (Qin et al., 2014). According to Fang et al. (2019) , although there is substantial bias in the estimation of extreme precipitation rates, especially in very high mountainous and arid areas, TRMM data generally performed well in representing the spatial pattern, overall volume, and probability characteristics of extreme precipitation over China. These findings demonstrated the great potential for its application of climatological and risk analyses with regard to extreme precipitation.
In this study, we did not mean to perform another evaluation regarding the accuracy of TRMM data, as there are many prior-mentioned studies that have already done this. However, we still wanted to know the difference between TRMM data and rain-gauge data with regard to rainstorm identification. The same rainstorm threshold was applied to the rain-gauge observation series to extract rainstorms by gauge. The results were then compared with the rainstorm information extracted from TRMM for corresponding grids. From the difference between rainstorm quantity identified from TRMM and rain-gauge data (Figure 12), we observed that TRMM generally overestimated rainstorm occurrences, especially for southeastern area of China. The TRMM-identified rainstorms in these 20 years may be several dozens more than those identified by the gauge data. In contrast, TRMM has tended to slightly underestimate rainstorm occurrence in northern China, especially the northwestern areas including Xinjiang and Inner Mongolia. From the rainstorm rainfall volume difference between TRMM-identified rainstorms and gauge-observed rainstorms (Figure 12b), it is clear that the pattern of rainfall volume does not correspond to the occurrence pattern (Figure 12a). Although at the majority of gauges, TRMM generally overestimates rainfall volume for all rainstorm events, the distribution of these gauges is quite even all over China. Underestimated rainfall volume is also found but is uncommon. There are several reasons for the differences evident in Figure 12. First of all, there are uncertainties inherent in both data sources, especially in the TRMM data. Besides, another reason is their different temporal resolutions. We used a 3-hour temporal resolution when applying the TRMM product data and 1-day resolution for the rain-gauge data. This makes the selection of rainstorms from the two data sources slightly different. The rain-gauge series likely missed some rapid and severe rainfall events that happened within just a few hours.
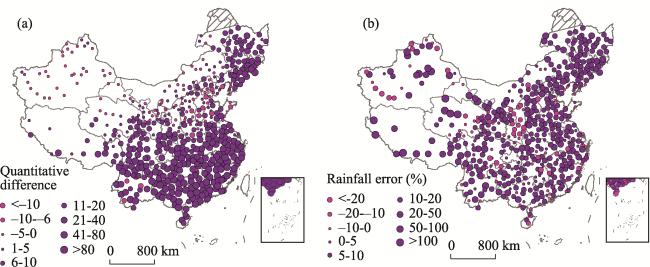
Figure 12 Comparison with rain gauge observations (a) quantitative difference between rainstorm count, (b) rainfall error of TRMM observation

4.2 Correlation between rainstorms and total precipitation

The aforementioned analyses indicate great similarity between the spatial patterns of rainstorms and total precipitation, which suggests their linkage. Zhai et al. (2005) also found that the frequency of extreme precipitation showed positive correlation with total precipitation at almost all rain gauge stations in China. To see if this correlation also exists in gaugeless areas in China, we used TRMM product data to map rainstorm rainfall as a percentage of total rainfall (Figure 13). We found that although total rainfall is very limited in northwestern China, rainstorm rainfall accounts for only a small percentage (<5%) of the total regional rainfall. In contrast, in the southeastern area, where precipitation is common, rainstorm rainfall is generally >20% of the total rainfall, and the percentage may reach 40% locally, such as on the islands of Hainan and Taiwan.
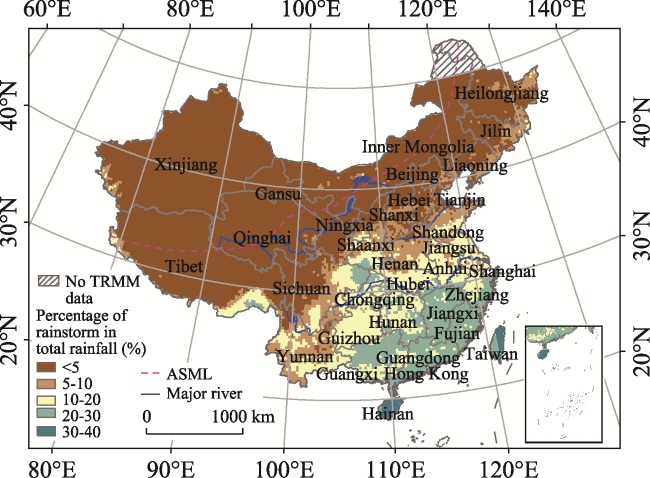
Figure 13 Percentage of rainstorm rainfall in total rainfall volume
For each grid, we plotted the observed rainstorm count and total rainfall during the 20 years and superposed the linear-regression line (Figure 14). We found a significant linear correlation (coefficient of determination R2 > 0.97). This fitted linear regression implies that when the total rainfall volume in each grid increased by 1,000 mm, there would be 4.5 more rainstorms. According to the data scatter (Figure 14), we found that for those grids that had <30,000 mm of rainfall, the rainstorm rate of increase was <0.4509%, and we attributed that to most of the scatters being below the regression line, whereas for those that had >30,000 mm of rainfall, the rate of increase was greater. This suggests that wet locations tend to have
more rainstorms with increasing total rainfall, which is consistent with the findings of Zhai et al. (2005) .
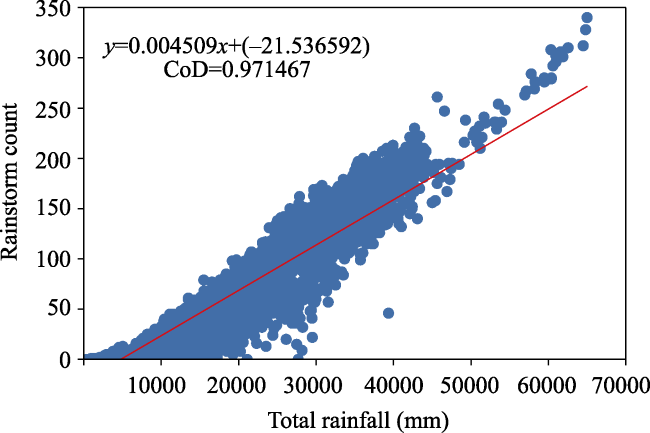
Figure 14 Scatterplot of rainstorm count and total rainfall volume

4.3 Relations between monsoon area rainstorms and climate variables

In previous studies (Chan and Zhou, 2005; Zhang et al., 2013; Hao and He, 2017; Wei et al., 2017), researchers have suggested that large-scale climate variables, such as El Niño-Southern Oscillation (ENSO) and Pacific Decadal Oscillation (PDO), have had substantial influence on the variability of precipitation over the monsoon regions in China under a warming climate. However, the relationships between rainstorm occurrence and different climate variables remain unclear. In this study, we selected four climate indices, PDO (Mantua et al., 1997; Zhang et al., 1997), Southern Oscillation Index (SOI) (Ropelewski and Jones, 1987), Trans-Niño Index (TNI) (Trenberth and Stepaniak, 2001) and Multivariate ENSO Index Version 2 (MEI) (Wolter and Timlin, 2011; Zhang et al., 2019) to explore the relationships between China monsoon area rainstorms and climate variables. Time series of these climate indices were acquired from the Earth System Research Laboratory (ESRL) Physical Sciences Division of the U.S. National Ocean and Atmospheric Administration (https://www.esrl.noaa.gov/psd/).
We calculated the average rainstorm count in each grid in the monsoon area of China for each year during 1998-2017 and plotted the resulting series with each of the four climate indices (Figure 15a). We found that the annual variation of rainstorm count exhibits patterns similar to all these four climate indices, particularly MEI. This suggests that ENSO might be the primary reason for the occurrence of rainstorms in China in the monsoon region. Zhang et al. (2013) also found that ENSO was a major influence on precipitation in the east river basin of south China. Similar findings were also reported by Chen et al. (2018) and Chan and Zhou (2005). We also calculated the annual average rainstorm volume (total rainfall of rainstorms) in each grid in the monsoon area of China during 1998-2017 and plotted it with these four climate variables (Figure 15b). Compared with the rainstorm occurrence (count), although correlations are still evident, rainstorm volume has weaker relationships with the four climate variables, among which TNI seems closely connected with the annual average rainstorm volume. Overall, however, rainstorms that occurred in the monsoon area of China during 1998-2017 were obviously driven by climate fluctuations, and apparently rainstorm occurrence was more readily influenced than rainfall volume by climate variables.

5 Conclusions

This study used a TRMM precipitation dataset to characterize the spatial and temporal dynamics of rainstorms in recent 20-year period in China. Unlike most of the existing studies, which were based on rain-gauge observations to achieve this, we used satellite acquired data, which could provide precipitation information covering the whole area. This is particularly useful in countries where rain-gauge observations are sparse, such as China. Using Python programming, we developed a rainstorm-identification tool that can be used for identifying rainstorms from gridded precipitation data series. In addition, this tool was applied to map the spatial and temporal variabilities of rainstorms in China during 1998-2017 using a 3-hour TRMM product as the input.
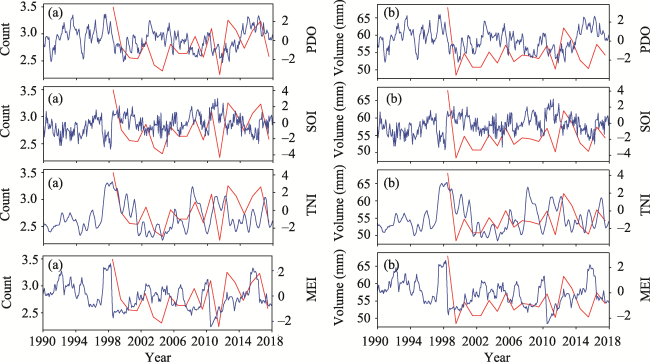
Figure 15 Line charts of (a) average rainstorm count and (b) average rainstorm volume in each grid in the monsoon area of China (red), along with four climate indices (blue)
As was expected, the majority of rainstorms occurred in the east, in the vicinity of the Asian Summer Monsoon Limit. We found that areas with significant increasing or decreasing rainstorm occurrence form belt pattern parallels to the monsoon limit. Most of the rainstorms occurred in spring and summer, with the highest rainstorm occurrence being in July. During the 20-year period (1998-2017) in China, the number of areas that experienced rainstorms at least once a year steadily increased. Also, the rainstorm rainfall centroid has been shifting along the southwest-northeast direction. We also found that rainstorm occurrence is closely related to total precipitation, which means locations with more total precipitation generally have more frequent rainstorms, although the rainstorm precipitation as a proportion of total precipitation varies from place to place. Basically, areas with more precipitation have a higher proportion of rainstorm rainfall.
Although global warming is expected to change the regime of extreme precipitation, the role of global warming in unusually large rainfall events in countries from the United Kingdom to China has been hotly debated. However, the latest study shows that climate change is driving an overall increase in rainfall extremes (Donat et al., 2016). Our study found that rainstorms within the monsoon limit that occurred during 1998-2017 were closely related to climate variables such as MEI, which also suggests that climate change might be a major driver of the rainstorms that occur in the monsoon region of China.
By comparing with in situ rain-gauge observation data, we have noticed that there are unignorable uncertainties in the TRMM data, which inevitably affects rainstorm identification. Nevertheless, we believe that this study is still helpful as it provides a large-scale rainstorm regime fully covering China, which would benefit urban-flooding and mountain torrent studies on a national scale.
With the development of remote sensing technology and climate modeling, an increasing number of precipitation data sources with different characteristics and accuracy levels are emerging. A comprehensive review of global precipitation datasets has been provided by Sun et al. (2018). Readers are encouraged to choose the data source that best suits their own purpose, considering factors such as the data accuracy, spatial coverage, spatial and temporal resolution requirement, and time span. The proposed rainstorm-identification tool can be applied to any of these precipitation data sources to extract the rainstorm events and study their spatiotemporal patterns, as long as the precipitation datasets are gridded data with a regular time series record.
1
Battaglia A, Kollias P, Dhillon R et al., 2020. Spaceborne cloud and precipitation radars: Status, challenges, and ways forward. Reviews of Geophysics, 58: e2019RG000686

2
Cao L, Pan S, 2014. Changes in precipitation extremes over the “Three-River Headwaters” region, hinterland of the Tibetan Plateau, during 1960-2012. Quaternary International, 321:105-115.

DOI

3
Cao Y, Zhang W, Wang W, 2018. Evaluation of TRMM 3B43 data over the Yangtze River Delta of China. Scientific Reports, 8(1):5290.

DOI

4
Chan J, Zhou W, 2005. PDO, ENSO and the early summer monsoon rainfall over south China. Geophysical Research Letters, 32(8):L08810.

5
Chen F, Li X, 2016. Evaluation of IMERG and TRMM 3B43 monthly precipitation products over mainland of China. Remote Sensing, 8(6):472.

DOI

6
Chen F, Xu Q, Chen J et al., 2015. East Asian summer monsoon precipitation variability since the last deglaciation. Scientific Reports, 5:11186.

DOI

7
Chen L, Wang L, 2018. Recent advance in earth observation big data for hydrology. Big Earth Data, 2(1):86-107.

DOI

8
Chen S, Zhang L, Zhang Y et al., 2020. Evaluation of Tropical Rainfall Measuring Mission (TRMM) satellite precipitation products for drought monitoring over the middle and lower reaches of the Yangtze River Basin, China. Journal of Geographical Sciences, 30(1):53-67.

DOI

9
Chen W, Huang G, Zhang H et al., 2018. Urban inundation response to rainstorm patterns with a coupled hydrodynamic model: A case study in Haidian Island, China. Journal of Hydrology, 564:1022-1035.

DOI

10
Chen X, Wang S, Hu Z et al., 2018. Spatiotemporal characteristics of seasonal precipitation and their relationships with ENSO in Central Asia during 1901-2013. Journal of Geographical Sciences, 28(9):1341-1368.

DOI

11
CMA, 2019. Definition and classification of rainstorms,http://www.cma.gov.cn/kppd/2011qqxkp/2011qkpdt/201205/t20120508_172024.html , accessed on 2019-03-14.

12
De Jong R, de Bruin S, de Wit A et al., 2011. Analysis of monotonic greening and browning trends from global NDVI time-series. Remote Sensing of Environment, 115(2):692-702.

DOI

13
Domroes M, Schaefer D, 2008. Recent climate change affecting rainstorm occurrences? A case study in East China. Climate of the Past, 4(2):289-308.

14
Donat M G, Lowry A L, Alexander L V et al., 2016. More extreme precipitation in the world’s dry and wet regions. Nature Climate Change, 6:508-513.

DOI

15
Douglas E M, Vogel R M, Kroll C N, 2000. Trends in floods and low flows in the United States: Impact of spatial correlation. Journal of Hydrology, 240(1/2):90-105.

DOI

16
Fang J, Yang W, Luan Y et al., 2019. Evaluation of the TRMM 3B42 and GPM IMERG products for extreme precipitation analysis over China. Atmospheric Research, 223:24-38.

DOI

17
Gemmer M, Becker S, Jiang T, 2004. Observed monthly precipitation trends in China 1951-2002. Theoretical and Applied Climatology, 77(1):39-45.

DOI

18
Hao X, He S, 2017. Combined effect of ENSO-like and Atlantic multidecadal oscillation SSTAs on the interannual variability of the East Asian winter monsoon. Journal of Climate, 30(7):2697-2716.

DOI

19
Hirsch R M, Slack J R, 1984. A nonparametric trend test for seasonal data with serial dependence. Water Resources Research, 20(6):727-732.

DOI

20
Kidd C, Becker A, Huffman G J et al., 2017. So, how much of the Earth’s surface is covered by rain gauges? Bulletin of the American Meteorological Society, 98(1):69-78.

DOI

21
Liu W, Zhang M, Wang S et al., 2013. Changes in precipitation extremes over Shaanxi Province, northwestern China, during 1960-2011. Quaternary International, 313/314:118-129.

DOI

22
Liu Y, Li L, Liu Y et al., 2020. Dynamic spatial-temporal precipitation distribution models for short-duration rainstorms in Shenzhen, China based on machine learning. Atmospheric Research, 237:104861.

DOI

23
Mantas V M, Liu Z, Caro C et al., 2015. Validation of TRMM multi-satellite precipitation analysis (TMPA) products in the Peruvian Andes. Atmospheric Research, 163:132-145.

DOI

24
Mantua N J, Hare S R, Zhang Y et al., 1997. A Pacific interdecadal climate oscillation with impacts on Salmon production. Bulletin of the American Meteorological Society, 78(6):1069-1080.

DOI

25
Mohsin T, Gough W A, 2010. Trend analysis of long-term temperature time series in the Greater Toronto Area (GTA). Theoretical and Applied Climatology, 101(3):311-327.

DOI

26
Neeti N, Eastman J R, 2011. A contextual Mann-Kendall approach for the assessment of trend significance in image time series. Transactions in GIS, 15(5):599-611.

DOI

27
Papalexiou S M, Montanari A, 2019. Global and regional increase of precipitation extremes under global warming. Water Resources Research, 55(6):4901-4914.

28
Qin Y, Chen Z, Shen Y et al., 2014. Evaluation of satellite rainfall estimates over the Chinese mainland. Remote Sensing, 6(11):11649-11672.

DOI

29
Ropelewski C F, Jones P D, 1987. An extension of the Tahiti-Darwin Southern Oscillation Index. Monthly Weather Review, 115(9):2161-2165.

DOI

30
Saunders K, Stephenson A G, Taylor P G et al., 2017. The spatial distribution of rainfall extremes and the influence of El Niño Southern Oscillation. Weather and Climate Extremes, 18:17-28.

DOI

31
Sen P K, 1968. Estimates of the regression coefficient based on Kendall's Tau. Journal of the American Statistical Association, 63(324):1379-1389.

DOI

32
Sun Q, Miao C, Duan Q et al., 2018. A review of global precipitation data sets: Data sources, estimation, and intercomparisons. Reviews of Geophysics, 56(1):79-107.

DOI

33
Trenberth K E, Stepaniak D P, 2001. Indices of El Niño evolution. Journal of Climate, 14(8):1697-1701.

DOI

34
Wang X, Ding Y, Zhao C et al., 2018. Validation of TRMM 3B42V7 rainfall product under complex topographic and climatic conditions over Hexi region in the northwest arid region of China. Water, 10(8):1006.

DOI

35
Wang Z, Zeng Z, Lai C et al., 2017. A regional frequency analysis of precipitation extremes in mainland of China with fuzzy c-means and L-moments approaches. International Journal of Climatology, 37(Suppl.1):429-444.

DOI

36
Wei W, Shi Z, Yang X et al., 2017. Recent trends of extreme precipitation and their teleconnection with atmospheric circulation in the Beijing-Tianjin sand source region, China, 1960-2014. Atmosphere, 8(5):83.

DOI

37
Witze A, 2018. Why extreme rains are getting worse. Nature, 563(7732):458-460.

DOI

38
Wolter K, Timlin M S, 2011. El Niño/Southern Oscillation behaviour since 1871 as diagnosed in an extended multivariate ENSO index (MEI.ext). International Journal of Climatology, 31(7):1074-1087.

DOI

39
Xiong J, Yong Z, Wang Z et al., 2019. Spatial and temporal patterns of the extreme precipitation across the Tibetan Plateau (1986-2015). Water, 11(7):1453.

DOI

40
Yue S, Pilon P, Phinney B et al., 2002. The influence of autocorrelation on the ability to detect trend in hydrological series. Hydrological Processes, 16:1807-1829.

DOI

41
Yue S, Wang C, 2004. The Mann-Kendall test modified by effective sample size to detect trend in serially correlated hydrological series. Water Resources Management, 18:201-218.

DOI

42
Zeng Z, Lai C, Wang Z et al., 2019. Intensity and spatial heterogeneity of design rainstorm under nonstationarity and stationarity hypothesis across mainland of China. Theoretical and Applied Climatology, 138:1795-1808.

DOI

43
Zerzetto E, Marani M, 2020. Extreme value metastatistical analysis of remotely sensed rainfall in ungauged areas: Spatial downscaling and error modelling. Advances in Water Resources, 135:103483

DOI

44
Zhai P, Zhang X, Wan H et al., 2005. Trends in total precipitation and frequency of daily precipitation extremes over China. Journal of Climate, 18(7):1096-1108.

DOI

45
Zhang Q, Li J, Singh V P et al., 2013. Influence of ENSO on precipitation in the East River basin, south China. Journal of Geophysical Research: Atmospheres, 118(5):2207-2219.

DOI

46
Zhang S, Wang D, Qin Z et al., 2018. Assessment of the GPM and TRMM precipitation products using the rain gauge network over the Tibetan Plateau. Journal of Meteorological Research, 32(2):324-336.

DOI

47
Zhang T, Hoell A, Perlwitz J et al., 2019. Towards probabilistic multivariate ENSO monitoring. Geophysical Research Letters, 46(17/18):10532-10540.

DOI

48
Zhang W, Yang C, Zhao Q et al., 2018. Evaluation of the validation of TRMM data over the region of Qilianshan Mountain in Northwest China. Remote Sensing of the Atmosphere, Clouds, and Precipitation VII, 10776:107760T.

49
Zhang Y, Wallace J M, Battisti D S, 1997. ENSO-like interdecadal variability: 1900-93. Journal of Climate, 10(5):1004-1020.

DOI

50
Zhao Y, Zou X, Cao L et al., 2014. Changes in precipitation extremes over the Pearl River Basin, southern China, during 1960-2012. Quaternary International, 333:26-39.

DOI

Outlines

/