The spatio-temporal heterogeneity of county-level economic development and primary drivers across the Loess Plateau, China

  • LIU Shijun ,
  • XUE Liang , *
Expand
  • School of Geography and Tourism, Shaanxi Normal University, Xi’an 710119, China
*Xue Liang (1978‒), PhD and Associate Professor, E-mail:

Liu Shijun (1996‒), Master Candidate, specialized in economic geography and regional studies. E-mail:

Received date: 2020-03-31

  Accepted date: 2020-07-23

  Online published: 2021-05-25

Supported by

Shaanxi Provincial Planning Office of Philosophy and Social Science(2019D045)

Copyright

Copyright reserved © 2021. Office of Journal of Geographical Sciences All articles published represent the opinions of the authors, and do not reflect the official policy of the Chinese Medical Association or the Editorial Board, unless this is clearly specified.

Abstract

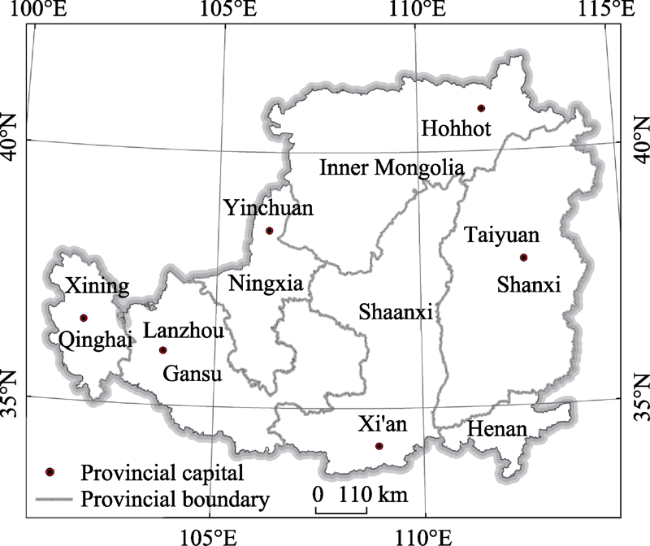
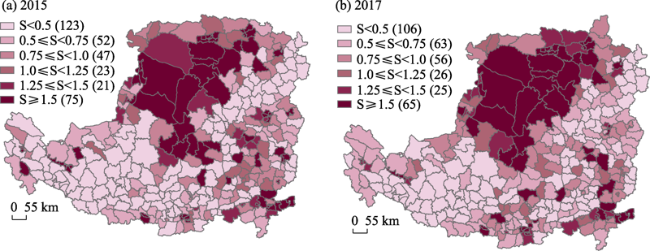
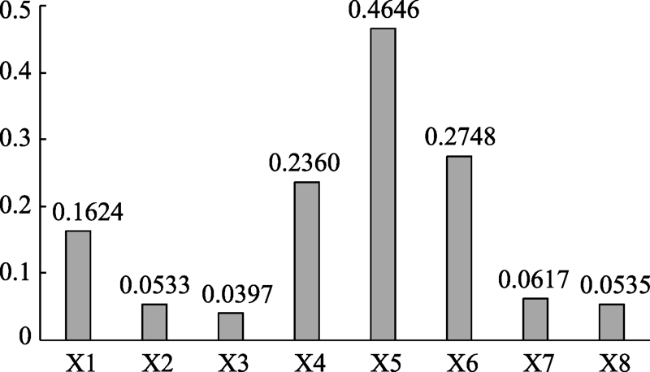
Unbalanced economic growth is a ubiquitous phenomenon while investigating the regional development at a large spatial scale. Therefore, it is of great significance to analyze the spatio-temporal pattern of regional economic growth and the drivers to understand and facilitate the economic development of low development areas. Taking a county as a fundamental study unit, we used the county-level per capita GDP data on the Loess Plateau from 2005 to 2017, and geographic variables such as slope, elevation, and population density to analyze the spatio-temporal differences and the driving factors of the county-level economic development in the Loess Plateau by employing both conventional and advanced quantitative methods including Exploratory Spatial Data Analysis (ESDA) and the geographic detector model. Our results suggested that: (1) The selected indicators, including absolute difference, the fluctuation of relative difference and total difference of economic development on the Loess Plateau, all show steady increasing trends, respectively. (2) There are 64.5% of the counties with economic development being below the average level of the whole Loss Plateau region. The relatively high developed counties are distributed in the “A”-shaped regions in Inner Mongolia Autonomous Region, Shaanxi, and Henan provinces, however, the low development counties are mainly located in the “V”-shaped regions in Gansu and Shanxi provinces. (3) GDP, investment in fixed assets and urbanization rate are the major driving factors influencing the regional economic development, and the combined effects are far greater than that of any individual factor.

Cite this article

LIU Shijun , XUE Liang . The spatio-temporal heterogeneity of county-level economic development and primary drivers across the Loess Plateau, China[J]. Journal of Geographical Sciences, 2021 , 31(3) : 423 -436 . DOI: 10.1007/s11442-021-1851-y

1 Introduction

Regional economic differences have always been a hot spot of research interests to the academic community. Since the 1990s, a great many researches had been conducted to this topic both at domestic or international level (Yang et al., 2010; Wu et al., 2011; Feng et al., 2015). County, as a fundamental unit of national economy, constitutes the foundation of regional economy such as economic regions. The county-level economy can better reflect the characteristics of regional economic development when we use a bottom-up approach in investigation (Li et al., 2001). With the ubiquitous occurrence of the fragile ecology and lagging economic development, the county-level economic growth of the Loess Plateau is extremely uneven. For instance, based on the 2015 census data, it showed that the production value of Daning County in Linfen City was only 0.45 billion yuan, while the production value of Yanta District reached 116.51 billion yuan. Thus, the quantitative analysis of the spatio-temporal economic disparities among counties on the Loess Plateau and its underlying mechanism is essential for sustainable regional development and implementation of the poverty alleviation policies by local government.
Although previous studies investigated urban economic development of China by international scholars, regional economic development of counties in China had rarely been studied by scholars outside China due to its distinct nature of administrative division of China (Ciccone et al., 1996; Broersma et al., 2009). In the 19th century, the origin of regional economic theory was proposed in the West. To study the regional economic discrepancy (Alfred, 1909; Rosenstein, 1943), and the convergence of the regional economy (Abramowitz, 1986; Robert, 1997), novel economic growth theories were used to analyze the regional economic problems (Mankiw et al., 1992), and the location effect of macro policies (Kuznets, 1955; Fei et al., 1979). Before the 1980s, research on regional economic differences in China was mainly based on city level statistics. With the further development of urbanization, county issues began to be revealed, and had gradually caught the attention of scientific community in China. Liu et al. (2012) used the relative difference measurement and the Theil index to study the spatio-temporal differentiation characteristics of the county-level economy in the Bohai Rim region. Zhang et al. (2009) used the Exploratory Spatial Data Analysis (ESDA) method to study the regional economic differences in Qinghai Province. Liu (2014) explored the spatial pattern of evolution of the county-level economy in Shaanxi Province by GIS software and ESDA method. All the above studies showed that the research scale in China had changed from the macro scales (i.e., the national) and provincial levels to the meso scales (i.e. the municipal and county levels). The research scope varied from the developed areas such as the Yangtze River Delta and the Pearl River Delta to the underdeveloped areas such as the northwest and southwest (Wang et al., 2011).
Although there has been a massive workload on economic differences, there are still some limitations and shortcomings existing in the pioneering studies. From the perspective of the research scope, the research on county scale economic development is mostly limited to a provincial scale, and the research on large-scale areas is still relatively rare (Guan et al., 2004; Ke et al., 2011). From the perspective of research methods, the traditional methods to measure regional economic differences mainly include the Theil index, Gini coefficient, coefficient of variation, etc. These methods assume that regions are independent (Arbia, 2001), which is unrealistic in most of the situation. Thus, it is still hard to get a comprehensive understanding about spatial distribution of regional economic differences and dynamics. Additionally, most of the driving factors are explored from a qualitative perspective, quantitative research is still lacking at the current stage. Therefore, we implemented traditional metrological and ESDA methods on socio-economic and geographic data to analyze the spatiotemporal heterogeneity in economic development from 2005 to 2017, which was a rapid economic growth period of the Loess Plateau.

2 Material and methods

2.1 Study area

The Loess Plateau, recognized as the largest soil loss region in the world, covers an area of 640,000 square kilometers (Figure 1). This area starts from Yinshan Mountains in the north, Qinling Mountains in the south, and stretches from Riyue Mountain in the west to Taihang Mountain in the east. The plateau includes 341 county-level administrative units across 44 prefecture-level administrative units in the entire territory of Shanxi Province and Ningxia Hui Autonomous Region, parts of Shaanxi, Henan, Gansu and Qinghai provinces and Inner Mongolia Autonomous Region. At present, the Loess Plateau has a big economic volume. According to 2015 national census, the total GDP of 341 counties in the regions reached 537.79 billion yuan, accounting for significant portions of the national economy. However, the GDP gaps among the counties are relatively large and the GDP of each county ranges from several hundred million yuan to hundreds of billion yuan. With the further development of society, these differences have even further expanded. In spite of its relatively large economy, the poverty of some counties on the Loess Plateau is pretty striking that more than 19% of 600 key poverty alleviation counties released by the central government in 2001 are located on the plateau.
Figure 1 Location of the Loess Plateau

2.2 Datasets

Considering the fact that the county-level administrative divisions on the Loess Plateau changed more frequently before 2005, it is not conducive to research and analysis due to lack of data. Thus, the starting point of time was selected from 2005, and the end time was 2017 with the latest available data. In this study, we used the per capita GDP data, calculated by dividing GDP by the resident population, of 341 county-level administrative units of the Loess Plateau to analyze the economic development changes from 2005 to 2017. Population density, urbanization rate, road density, etc. were regarded as driving factors. The socio-economic data were derived from the statistical yearbooks of Qinghai, Ningxia, Gansu, Inner Mongolia, Shaanxi, Shanxi, and Henan provinces. Some of the missing data were complemented by using the statistical yearbooks of each city and the China County Statistical Yearbook. The counties' vector data such as border, highway and railway data were downloaded from the 1:1 million national essential geographic databases in the National Geographic Information Resource Directory Service System (http://www.webmap.cn). The elevation and slope data with a resolution of 90 meters were harvested from the DEM digital elevation data in the geospatial data cloud (http://www.gscloud.cn) platform.

3 Methods

3.1 Coefficient of variation analysis

When there is a difference in the measurement scale or dimension between the two sets of data, it is not appropriate to directly compare the data with the standard deviation. To eliminate the influence of measurement scale and dimension, a dimensionless coefficient of variation can be used. The coefficient of variation represents the relative volatility of geographic data. The formula is as follows (Liu et al., 2012):
$Cv=\frac{1}{{\bar{y}}}\sqrt{\sum\limits_{i=1}^{n}{{{({{y}_{_{i}}}-\bar{y})}^{2}}/n}}$
where Cv, yi, $\bar{y}$ and n are the coefficient of variation, the per capita GDP of the county, the average GDP per capita, and the county-level administrative units respectively.

3.2 Theil index analysis

The Theil Index can effectively measure the contribution of intra-(T1) and inter-regional differences (T2) to the overall variation. The formula is as follows:
$T=T1+T2=\sum\limits_{i=1}^{n}{{{P}_{i}}{{T}_{i}}}+\sum\limits_{i=1}^{n}{{{P}_{i}}}\log \frac{{{P}_{i}}}{{{V}_{i}}}$
${{T}_{i}}=\sum\limits_{j=1}^{m}{{{P}_{i}}_{j}\log \frac{{{P}_{i}}_{j}}{{{V}_{i}}_{j}}}$
where n, Pi, Vi, m, Pij and Vij are the number of subgroups, the proportion of the population, GDP of the first region to the total population and total GDP of the entire Loess Plateau, the number of groups in the first region, the proportion of the population and GDP of the first region to the total population and total GDP of the entire region respectively.

3.3 ESDA

The ESDA method can provide an effective tool for measuring correlation of any particular feature between neighboring spatial unit (Chen et al., 2011). The Moran's I index represents spatial autocorrelation among unit attribute values. The formula is as follows (Fang et al., 2017):
$I\text{=}\frac{N}{{{S}_{0}}}\times \frac{\sum\limits_{i=1}^{N}{\sum\limits_{j=1}^{N}{{{W}_{ij}}}}({{x}_{i}}-\bar{x})({{x}_{j}}-\bar{x})}{\sum\limits_{i=1}^{N}{{{({{x}_{i}}-\bar{x})}^{2}}}}$
${{S}_{0}}\text{=}\sum\limits_{i=1}^{N}{\sum\limits_{j=1}^{N}{{{W}_{ij}}}}$
where N, xi, xj, $\bar{x}$ and Wij represent the number of county-level administrative units, the attribute values, the spatial weight matrix on the i and j units and the average value.

3.4 Geo-detector analysis

Geo-detector is mainly used to analyze the driving forces of various phenomena and multi-factor interactions (Wang et al., 2017). The main assumption is that if an independent variable has significant influence on a dependent variable, the spatial distribution of the independent variable and the dependent variable should have similarities (Wang et al., 2010; Wang et al., 2012; Dong et al., 2017). It can be divided into four categories: differentiation and factor detection, interaction detection, risk area detection and ecological detection. Factor detection and interaction detection were used in this study due to its effectiveness in difference detection.
3.4.1 Factor detection
Factor detection is mainly used to explain the extent to which a factor explains the spatial differentiation of a certain property. If the similarity is high enough, then the factor is well explained. The formula is as follows (Zhang et al., 2018):
$P=1-\frac{1}{N{{\sigma }^{2}}}\sum\limits_{i=1}^{L}{{{N}_{i}}{{\sigma }_{i}}^{2}}$
where P, N, Ni, L,${{\sigma }^{2}}$and${{\sigma }_{i}}^{2}$ are the degree to which the factor explains the spatio-temporal differentiation of economic development, the number of county-level administrative units, the number of samples in the sub-level region, the number of sub-regions, the variance of GDP per capita in each county of the Loess Plateau and the variance of regional per capita GDP at the next level, respectively.
3.4.2 Interaction detection
Interaction detection can study the combined effects of two factors on the spatio-temporal differentiation of economic development (Li et al., 2019). Its formulas are as follows:
Nonlinear attenuation: q(X1∩X2) < min[q(X1), q(X2)]
Single factor nonlinear attenuation: min[q(X1), q(X2)] < q(X1∩X2) < max[q(X1), q(X2)]
Two-factor enhancement: q(X1∩X2) > max[q(X1), q(X2)]
Independent: q(X1∩X2) = q(X1) + q(X2)
Nonlinear enhancement: q(X1∩X2) > q(X1) + q(X2)

4 Results and analysis

4.1 Temporal difference characteristics of county-level economic development

4.1.1 Absolute difference gradually increases, relative difference increases
It can be seen from Table 1 and Figure 2 that the county-level standard deviation on the Loess Plateau has continued to rise during 2005‒2017, indicating that the absolute difference in the county-level economy of the Loess Plateau has gradually increased. According to the analysis (Zhang et al., 2017), the main reason for this feature is the vast territory of the Loess Plateau and the great differences in geographical location, mineral resources and policy orientation among the counties. Each municipal district has a good policy guidance for economic development, which mainly promotes the rapid economic development of the municipal district from the aspects of tax revenue, high-tech industry, investment promotion, etc. The economic development of the coal-producing areas including most of Shanxi, northern Shaanxi, and Ordos in Inner Mongolia is much faster than that of the areas with scant natural resources, which produced huge absolute economic disparities. The coefficient of variation shows a fluctuant and increasing tendency from 2005 to 2017, implying the increase in the fluctuation of relative difference in county-level economy of the Loess Plateau. Specifically, this specific change can be divided into two stages. From 2005 to 2009, the coefficient of variation experienced a gradual increase from 0.8970 in 2005 to 1.0682 in 2009, while from 2009 to 2017, the number shrank to 0.9209 in 2017. The relative difference has been declining since 2009, thanks to the implementation of the coordinated national development strategy and the establishment of the Guanzhong-Tianshui Economic Zone in 2009, with six cities and one district. The strategy of regional coordinated development puts forward that we should actively promote the policy of western development and continue to give full play to the advantages and enthusiasm of all regions. The Guanzhong-Tianshui Economic Zone made the plan of to creating a new economic growth pole in the western region, to form a developed urban agglomeration and industrial cluster belt in western China. With the rapid economic development in this region, the relative differences in county-level economies have narrowed down.
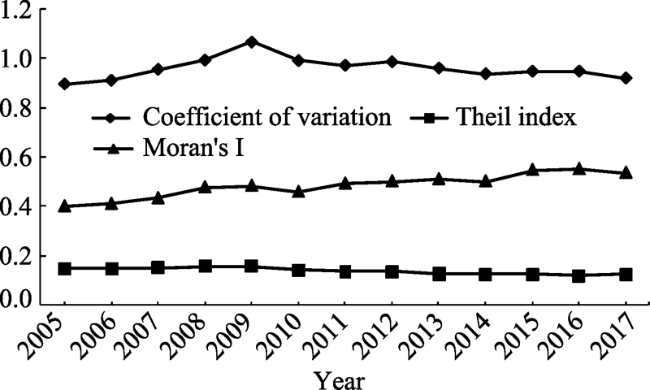
Table 1 The county-level economic difference of the Loess Plateau from 2005 to 2017
Coefficient of variation Theil index Moran's I Coefficient of skewness Standard deviation
2005 0.8970 0.1492 0.4022 1.9926 11555
2006 0.9119 0.1493 0.4121 2.0377 14022
2007 0.9568 0.1545 0.4347 2.3423 18035
2008 0.9944 0.1581 0.4785 2.5692 23413
2009 1.0682 0.1576 0.4853 3.2159 28000
2010 0.9918 0.1418 0.4605 2.6865 30627
2011 0.9727 0.1373 0.4937 2.6151 36325
2012 0.9874 0.1365 0.5030 2.7705 42080
2013 0.9619 0.1270 0.5116 2.9628 43184
2014 0.9384 0.1250 0.5027 2.8944 43484
2015 0.9486 0.1236 0.5487 3.0198 43630
2016 0.9492 0.1189 0.5523 3.1181 45453
2017 0.9209 0.1260 0.5370 2.8887 49112
Figure 2 Changes of county-level economic differences on the Loess Plateau from 2005 to 2017
4.1.2 Spatial agglomeration is gradually enhanced
From Table 1 and Figure 2, it can be seen that Moran's I is greater than 0 during 2005‒2017. It presents gradual increase, indicating an obvious positive spatial correlation. This reflects the fact that county-level administrative units with a similar level of economic development (high or low) on the Loess Plateau are relatively clustered in space due to the aggregation of critical national development areas in the region. As time went by, major urban agglomerations including Guanzhong Plain, Taiyuan, Hubaoeyu, and Lanxi Urban Agglomerations; and Ningxia Economic Zone along the Yellow River have been constructed. As an advanced phenomenon in regional spatial form in the process of industrialization and urbanization, urban agglomeration can produce huge agglomeration economic benefits. In 2009, 2014 and 2017, Moran's I show a certain decline, indicating that the spatial agglomeration in these years may be weakened. This provides a stark contrast to the increase of the agglomeration effect in other years.
4.1.3 Inter-regional differences are the main contributing factors to the total difference
Although there are some differences in county-level economy, due to the consistency in the overall economic development planning, the economic and social factors of population are not very different. On the contrary, there are considerable differences among provinces in various aspects, leading to the significant difference among provinces. Table 2 and Figure 3 show that the disparities among the seven provinces increase gradually from 2005 to 2017, then decrease from 0.03 to 0.0427 and then to 0.0401; and the weight of the total disparities increase from 20.11% to 33.64% and finally to 31.83%. Variations in intra-county differences among the seven provinces are also shown during the same period. The province with increased volatility is Henan while the volatility shows stable in certain province such as Qinghai or decrease in others such as Shanxi, Inner Mongolia, Shaanxi, Gansu, and Ningxia during this period. From the contribution of intra-county differences in seven provinces to the total difference of the Loess Plateau, Shanxi, Shaanxi and Gansu accounted for about 20% while Inner Mongolia, Henan, Qinghai and Ningxia are only responsible for 5% variation.
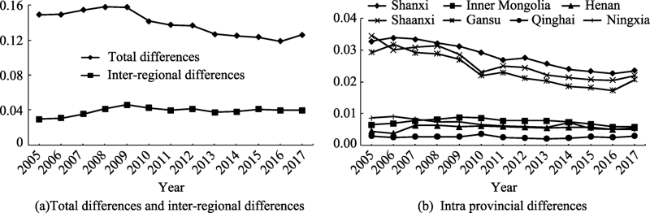
Table 2 Change and decomposition of county-level economic differences on the Loess Plateau from 2005 to 2017
2005 2006 2007 2008 2009 2010 2011 2012 2013 2014 2015 2016 2017
Total difference 0.1492 0.1493 0.1545 0.1581 0.1576 0.1418 0.1373 0.1365 0.1270 0.1250 0.1236 0.1189 0.1260
Shanxi Difference 0.0327 0.0339 0.0334 0.0321 0.0312 0.0292 0.0269 0.0276 0.0257 0.0241 0.0234 0.0227 0.0236
Proportion 21.92% 22.71% 21.62% 20.30% 19.80% 20.59% 19.59% 20.22% 20.24% 19.28% 18.93% 19.09% 18.73%
Inner
Mongolia
Difference 0.0065 0.0068 0.0077 0.0081 0.0088 0.0086 0.0078 0.0077 0.0078 0.0072 0.0066 0.0058 0.0059
Proportion 4.36% 4.55% 4.98% 5.12% 5.58% 6.06% 5.68% 5.64% 6.14% 5.76% 5.34% 4.88% 4.68%
Henan Difference 0.0046 0.0039 0.0063 0.0062 0.0058 0.0061 0.0060 0.0058 0.0055 0.0057 0.0057 0.0050 0.0056
Proportion 3.08% 2.61% 4.08% 3.92% 3.68% 4.30% 4.37% 4.25% 4.33% 4.56% 4.61% 4.21% 4.44%
Shaanxi Difference 0.0346 0.0301 0.0310 0.0313 0.0286 0.0230 0.0251 0.0245 0.0221 0.0214 0.0206 0.0205 0.0220
Proportion 23.19% 20.16% 20.06% 19.80% 18.15% 16.22% 18.28% 17.95% 17.40% 17.12% 16.67% 17.24% 17.46%
Gansu Difference 0.0293 0.0318 0.0292 0.0289 0.0270 0.0220 0.0230 0.0211 0.0203 0.0186 0.0181 0.0173 0.0207
Proportion 19.64% 21.30% 18.90% 18.28% 17.13% 15.51% 16.75% 15.46% 15.98% 14.88% 14.64% 14.55% 16.43%
Qinghai Difference 0.0029 0.0026 0.0027 0.0027 0.0026 0.0036 0.0026 0.0023 0.0021 0.0023 0.0026 0.0025 0.0029
Proportion 1.94% 1.74% 1.75% 1.71% 1.65% 2.54% 1.89% 1.68% 1.65% 1.84% 2.10% 2.10% 2.30%
Ningxia Difference 0.0086 0.0091 0.0083 0.0075 0.0073 0.0066 0.0061 0.0059 0.0056 0.0072 0.0053 0.0051 0.0052
Proportion 5.76% 6.10% 5.37% 4.74% 4.63% 4.65% 4.44% 4.32% 4.41% 5.76% 4.29% 4.29% 4.13%
Interregional Difference 0.0300 0.0312 0.0359 0.0414 0.0461 0.0426 0.0398 0.0416 0.0378 0.0385 0.0413 0.0400 0.0401
Proportion 20.11% 20.83% 23.24% 26.13% 29.38% 30.13% 29.00% 30.48% 29.85% 30.80% 33.42% 33.64% 31.83%
Figure 3 Regional decomposition of county-level economic differences on the Loess Plateau from 2005 to 2017

4.2 Spatial difference characteristics of county-level economic development

4.2.1 There are more counties with economy below the average, and the deviation from the average is significant but weakening
To analyze the spatial variation characteristics of the county-level economic development on the Loess Plateau from 2005 to 2017, we divided the per capita GDP data of each county by the S-value of the per capita GDP of the entire region. According to 0.5, 0.75, 1.0, 1.25 and 1.5 times of GDP per capita in the entire region, the counties were divided into six levels. In ArcGIS software, we selected the color scheme of classification to draw Figure 4. The value in brackets is the number of county-level administrative units in this range. Figure 4 shows that there are more than 220 county-level administrative units with per capita GDP below average (S<1.0) on the Loess Plateau between 2005 and 2017, accounting for more than 64.5% of the entire region. The number of county-level administrative units at the lowest level (S<0.5), and the highest level (S≥1.5) are the same for each year in 2005 and 2017. The two largest numbers in the range (0.5≤S<1.5) indicate that the two levels of county economy on the Loess Plateau are significantly different. At the same time, the number of county-level administrative units at the lowest and highest levels decrease from 123 and 75 in 2005 to 106 and 65 in 2017, showing gradual decline in differences.
Figure 4 Spatial difference of county-level economy on the Loess Plateau in 2005 and 2017
4.2.2 The relatively developed counties are mainly distributed in Inner Mongolia, Shaanxi and Henan provinces, with A-shaped spatial distributional pattern
It can be seen from Figure 4 that there are 90 county-level administrative units with relatively higher per capita GDP (S>1.25), of which 27 are in Inner Mongolia, 12 in Henan and 39 in Shaanxi. The number of counties with relatively prosperous economy in three provinces accounts for 86.7% of the total area. Developed counties in Inner Mongolia are relatively concentrated, and every two of them are basically adjacent to each other while in Shanxi and Henan provinces the counties are relatively scattered, which together create the of A-shaped spatial distribution pattern in the relatively wealthy counties in the Loess Plateau. Firstly, the reason for such a spatial distribution pattern is that the economic development level of the three provinces is on the top three list of the plateau. With the provincial capitals of Hohhot, Xi'an and Zhengzhou as centers radiating to the surrounding areas; the economic development of these provinces are relatively fast in recent years, especially the GDP growth rate of Henan and Shaanxi provinces are significantly higher than that of the national GDP average growth rate.
4.2.3 The poorer counties are mainly distributed in Gansu and Shanxi provinces, with V-shaped spatial distribution pattern
Figure 4 shows that there are 169 county-level administrative units with per capita GDP of P<0.75, 40 in Gansu, and 74 in Shanxi. The number of poor counties in the two provinces accounts for 23.7% and 43.8% of the region due to the economic development level of the two provinces. Gansu Province with relatively scarce financial resources, rarely solid industrial structure and sparse foreign capital exchange is always in the bottom position of the national GDP ranking. Although Shanxi has abundant natural resources, its economic development is still at a low level due to its less convenient geographical location, blocked conversion of resource advantage, and misplaced national preferential policies. The poor counties in Gansu Province are relatively concentrated while they are fairly scattered in Shanxi Province, forming a V-shaped spatial distribution pattern.

4.3 Driving factors of county-level economic development

4.3.1 Driving factors selection
The development of a regional economy is affected by many driving factors, which cannot be discussed one by one. We tried to explore the factors affecting the economic development of the Loess Plateau from the aspects of nature, population and society. According to the previous studies (Zhang et al., 2013; Li et al., 2019), combined with the actual situation of the Loess Plateau and the availability of data, we selected eight factors as the detection elements: average slope, average elevation, population density, urbanization rate, GDP, real estate investment of the whole society, highway density and railway density. As shown in Table 3, the influencing factors that affect the economic development level of the Loess Plateau are determined accordingly.
Table 3 Driving factors of county-level economic development on the Loess Plateau
Driving factors Calculation
Average slope (degree) (X1) With ArcGIS partition statistics
Average elevation (m) (X2) With ArcGIS partition statistics
Population density (person/km2) (X3) Resident population/county area
Urbanization rate (%) (X4) Urban population/total population
GDP (ten thousand yuan) (X5) Statistical yearbook query
Fixed assets investment of the whole society
(ten thousand yuan) (X6)
Statistical yearbook query
Highway density (km/km2) (X7) The total length of the county road/the area of the county
Railway density (km/km2) (X8) Total length of railways in the county/area of the county
4.3.2 Factor detection
The above driving factors were classified into six levels and then discretized according to the natural discontinuous point classification method by ArcGIS software classification method. The per capita GDP as the dependent variable (Y) and the discrete driving factors as the independent variables (X1, X2, X3, X4, X5, X6, X7, X8) were put into the geographic detector model. Subsequently, explanatory power of each driving factor to the economic development was calculated by applying the factor detection of the geographic detector. The result is shown in Figure 5.
Figure 5 Explanatory power of driving factors of county- level economic development on the Loess Plateau
The selected eight types of driving factors significantly affect the development of the county-level economy on the Loess Plateau (Figure 5). The order of influence of the factors are GDP (0.4646), total social fixed assets investment (0.2748), urbanization rate (0.2360), average slope (0.1624), highway density (0.0617), railway density (0.0535), average elevation (0.0533), and population density (0.0397). The GDP, the strongest driver on the list, reflects the huge impact of local fiscal revenue on the economic development of the Loess Plateau, which is also the case in the national economic development. Only a higher fiscal revenue can guarantee sufficient fiscal expenditure, and the government can better intervene and regulate the macro-economy and promote the rapid economic development.
4.3.3 Interactive detection
Factor detection is mainly used to detect the interpretation of a single factor on the dependent variable. Normally, the interactive detection function of the geographic detector is used to analyze the interaction between the factors. The individual driving force of any factor for economic development is smaller than its interaction with another factor (Table 4). The interaction between GDP and road density is the largest (0.6416), which is greater than the GDP (0.4646) and highway density (0.0617); and the interaction between GDP and population density is the second. Meanwhile, when other factors such as average slope and average elevation interact with GDP, their influences on the county-level economic development of the Loess Plateau increase significantly, confirming significance of GDP in the county-level economic development of the plateau.
Table 4 Interaction of driving factors of county-level economic development on the Loess Plateau
X1 X2 X3 X4 X5 X6 X7 X8
X1 0.1624
X2 0.3063 0.0533
X3 0.2870 0.1231 0.0397
X4 0.3410 0.3429 0.3074 0.2360
X5 0.5467 0.6032 0.6186 0.5922 0.4646
X6 0.3806 0.4102 0.4007 0.4386 0.5232 0.2748
X7 0.2692 0.1441 0.1312 0.3442 0.6416 0.4037 0.0617
X8 0.2432 0.1307 0.1180 0.2878 0.5598 0.3350 0.1448 0.0535

5 Discussion

Based on the traditional statistical model, ESDA, and geographic detector model, we explored the spatio-temporal differences of county-level economy on the Loess Plateau and the drivers of the differences. The temporal difference increased gradually, and the contribution of regional difference was the largest. In space, the two levels of differentiation were significant, forming different distribution patterns in different provinces. GDP and fixed asset investment of the whole study area was the primary reason of regional differences. In recent years, with the rapid increase of population and the development of resources, the unbalanced economic development on the Loess Plateau had become increasingly prominent. The spatial differentiation and combination of resources, environment, ecology, population and economy had become a key problem restricting the sustainable development of the region. Therefore, it is of practical significance to analyze the comprehensive economic growth characteristics of the Loess Plateau spatially and temporally for the effective implementation of the national main function zoning policy.
Similar changing characteristics of economic differences were found in China's Bohai Rim region (Liu et al., 2012), Huaihai Economic Zone (Qiu et al., 2009), Fujian Province (Fang et al., 2017) and other regions. The absolute economic differences in each region were increasing, forming the corresponding spatial distribution pattern. However, the regional difference of the Loess Plateau was the biggest contributor of the total difference, not the internal difference of a certain region. The distribution of developed counties was not like the distribution of transportation lines, but had a closer relationship with the mineral resources and economic policies of provinces. Comparing the findings with the spatio-temporal differentiation characteristics of economic growth on the Loess Plateau in recent 20 years obtained by Liu Yanhua et al. (2012), northern Shaanxi and Ordos in Inner Mongolia of the Loess Plateau region developed rapidly after decades of fast economic changes. The high per capita GDP counties were well distributed in a belt shape, which was consistent with the evolution law and actual situation of economic development.
Economic growth is an extremely complicated process, which is affected by multiple factors, such as national policies, investment attraction, resources and so on. The driving factors selected in this study are the primary ones based on our professional experience, which may arouse certain limitations. Restricted by the changes of administrative divisions and the difficulty in obtaining inventory data, we only studied the changes and causes of economic development of each county in the 13 years. The future research prospects may consider the following three points: firstly, extend the temporal scale from the China's Reform and Opening-up (from 1976 to 1989) or even since the Founding of China (1959); secondly, further refine the research units to towns, in order to conduct a more comprehensive and detailed analysis; thirdly, introduce more factors into the attribution analysis, and use new methods to screen and calculate the results.

6 Conclusions

This paper investigated the spatio-temporal heterogeneity in the county-level economic growth of the Loess Plateau from 2005 to 2017. The major conclusions of the study include:
(1) In terms of temporal patterns, economic development has shown great differences in many aspects. The absolute gap of economic growth and relative difference volatility on the Loess Plateau has increased substantially during the study period. The economic difference of each county follows a favorable skew distribution: the average is greater than the median, and the median is greater than the mode. Spatial agglomeration has increased significantly and has a positive correlation with the expansion of regional economic differences. Inter-regional difference is the largest contributor to the total difference in economic development, and it contributes more than the internal differences to each sub-region.
(2) In terms of spatial patterns, the county-level economy presents different spatial patterns. The number of counties with economic volume below the average level is much larger than that above the average economic level; and this two-level differentiation is very significant. The high development counties are mainly distributed in Inner Mongolia, Shaanxi, and Henan provinces, which create an A-shaped spatial distribution pattern. The low development counties are mainly distributed in Gansu and Shanxi provinces forming a V-shaped spatial distribution pattern.
(3) The eight driving factors selected in this study, including the average slope, average elevation, population density, urbanization rate, GDP, real estate investment of the whole society, highway density and railway density, show great impact on the economic differences of the counties on the Loses Plateau. Among which, GDP, real estate investment of the whole society and urbanization rate are considered as the bottleneck of the county-level economy in the study area. Although the other factors have minor effects solely, their explanatory power is greatly enhanced when interacting with GDP compared with the driving effect of other factors.
[1]
Abramowitz M, 1986. Catching up, forging ahead, and falling behind. The Journal of Economic History, 46(2):385-406.

[2]
Alfred W, 1909. Theory of the Location of Industries. Chicago: The University of Chicago Press.

[3]
Arbia G, 2001. The role of spatial effects in the empirical analysis of regional concentration. Journal of Geographical Systems, 3(3):271-281

[4]
Bai X, Du B B, Jiang Y L, 2019. Spatial disparities of economy and its evolvement at county level in Guangdong Province. Research of Soil and Water Conservation, 26(5):296-303. (in Chinese)

[5]
Broersma L, Oosterhaven J, 2009. Regional labor productivity in the Netherlands: Evidence of agglomeration and congestion effects. Journal of Regional Science, 49(3):483-511

DOI

[6]
Chen P Y, Zhu X G, 2011. Spatial analysis on Fujian’s regional inequalities and mechanisms. Economic Geography, 31(8):1252-1257. (in Chinese)

[7]
Chen P Y, Zhu X G, 2012. Regional inequalities in China at different scales. Acta Geographica Sinica, 67(8):1085-1097. (in Chinese)

[8]
Ciccone A, Hall R E, 1996. Productivity and the density of economic activity. National Bureau of Economic Research, 86(1):54-70

[9]
Dong Y X, Xu Q, Yang R et al., 2017. Delineation of the northern border of the tropical zone of China’s mainland using Geodetector. Acta Geographica Sinica, 72(1):135-147. (in Chinese)

[10]
Elena G, 2010. New directions for urban economic models of land use change: Incorporating spatial dynamics and heterogeneity. Journal of Regional Science, 50(1):65-91

[11]
Fang C L, 2010. Development status quo and key points of construction of urban agglomerations in west regions of China. Arid Land Geography, 33(5):667-675. (in Chinese)

[12]
Fang W T, Teng T W, Chen Z Q, 2017. Analysis of the evolution of temporal and spatial pattern of county economic difference in Fujian Province. Human Geography, 32(2):103-110. (in Chinese)

[13]
Fei, Ranis, Kuo, 1979. Growth with Equity: The Taiwan Case. New York: Oxford University Press.

[14]
Feng C C, Zeng Z R, Cui N N, 2015. The economic disparities and their spatio-temporal evolution in China since 2000. Geographical Research, 34(2):234-246. (in Chinese)

[15]
Guan W H, Zhao Y, Lin Z S, 2004. Study on the evolution of regional spatial structure in Jiangsu Province since 1978. Geographical Research, 23(4):541-550. (in Chinese)

[16]
Guo F Y, Tong L J, Li P, 2016. Spatial-temporal differences and driving mechanism of the Songhua River ecological economic corridor basin economy. Economic Geography, 36(9):35-41. (in Chinese)

[17]
Han Y, Zhang Y, 2019. Spatiotemporal variations of county economies and influencing factors: A case study of Gansu Province. Journal of Geo-information Science, 21(11):1735-1744.(in Chinese)

[18]
Hu X F, Chen X P, Han J et al., 2017. Evaluation of environmental carrying capacity of the Han, Tibetan and Hui ethnic areas based on emery analysis. Journal of Lanzhou University, 53(2):206-212. (in Chinese)

[19]
Hu X Y, Zhang Z L, Chen X P et al., 2019. Geographic detection of spatial-temporal difference and its influencing factors on county economic development: A case study of Gansu Province. Geographical Research, 38(4):772-783. (in Chinese)

[20]
Jan G, 2002. Knowledge and urban economic development: An evolutionary perspective. Urban Studies. 39(5):1019-1035.

[21]
Ke W Q, Lu Y Q, 2011. Evolvement of spatial pattern of economy at county level in Fujian Province. Economic Geography, 31(1):1081-1087. (in Chinese)

[22]
Kuznets S, 1955. Economic growth and income inequality. The American Economic Review, 45:1-28.

[23]
Liu N, Xie Y S, Suo G D et al., 2014. Analysis on evolvement of spatial pattern of economy in Shaanxi Province at county level based on ESDA. Research of Soil and Water Conservation, 21(3):73-78. (in Chinese)

[24]
Liu Y, Zhou Y B, Wang G G et al., 2012. Study on spatial characteristics and evolution pattern of economic development at county-scale in the area along Bohai Rim in China. Areal Research and Development, 31(4):52-55. (in Chinese)

[25]
Li J T, Liu Y S, Yang Y Y et al., 2018. Spatial-temporal characteristics and driving factors of urban construction land in Beijing-Tianjin-Hebei region during 1985‒2015. Geographical Research, 37(1):37-52. (in Chinese)

[26]
Li X J, Qiao J J, 2001. County level economic disparities of China in the 1990s. Acta Geographica Sinica, 56(2):136-145. (in Chinese)

[27]
Li Z Z, Dou M, Shao D Q, 2019. Study on spatial difference and influencing factors of county level economic development in Shaanxi Province. Geomatics & Spatial Information Technology, 42(5):173-178. (in Chinese)

[28]
Long Z K, He L L, 2015. The temporal differentiation of tourism economic development in Hunan Province. Journal of Shaoyang University (Social Science Edition), 14(2):66-71. (in Chinese)

[29]
Mankiw G, Romer D, Weil N, 1992. A contribution to the empirics of economic growth. Quarterly Journal of Economics, 107(2):407-437

[30]
Pang J X, Chen X P, 2017. Temporal and spatial changes in coupling and coordinating degree of economic development and environmental pollution in Gansu Province. (Natural Sciences). Journal of Lanzhou University , 53(1):54-59.(in Chinese)

[31]
Qiu F D, Zhu C G, Tong L J et al., 2009. Spatial analysis of economic disparities of county level in Huaihai economic zone. Scientia Geographica Sinica, 29(1):56-63.(in Chinese)

[32]
Robert J, 1997. Determinants of Economic Growth: A Cross-country Empirical Study Cambridge, MA: MIT Press.

[33]
Rosenstein R, 1943. Problems of industrialization of eastern and south-eastern Europe. Economic Journal, 53:210-211.

[34]
Wang H, Sun J F, Yu J, 2014. Study on characteristic of spatio-temporal evolution of county economic difference in Shandong Province. Areal Research and Development, 33(5):16-20.(in Chinese)

[35]
Wang J F, Hu Y, 2012. Environmental health risk detection with GeoDetector. Environmental Modelling & Software, 33:114-115.

[36]
Wang J F, Li X H, Christakos G et al., 2010. Geographical detectors-based health risk assessment and its application in the neural tube defects study of the Heshun region, China. International Journal of Geographical Information Science, 24(1):107-127

DOI

[37]
Wang J F, Xu C D, 2017. Geodetector: Principle and prospective. Acta Geographica Sinica, 72(1):116-134. (in Chinese)

[38]
Wang J, Zhang X L, Du H R, 2011. Spatial pattern evolvement and characteristics of the economy in Xinjiang at the county level. Progress in Geography, 30(4):470-478. (in Chinese)

DOI

[39]
Wang X, 2010. Tempo-spatial variation of tourism development in Chongqing. Economic Geography, 30(3):519-523. (in Chinese)

[40]
Wen Q, Shi L N, Ma C H et al., 2018. Spatial heterogeneity of multidimensional poverty at the village level: Loess Plateau. Acta Geographica Sinica, 73(10):1850-1864. (in Chinese)

DOI

[41]
Wu A Z, Yang K Z, Li G P, 2011. Analysis of spatial-temporal evaluation of regional technology relatively efficiency in China. Economic Geography, 31(5):705-711. (in Chinese)

[42]
Yang F S, Yang X M, Wang Z H et al., 2018. Geographic detection of impact factors of economic differences among typical counties in Jiangxi Province. Journal of Geo-information Science, 20(1):79-88. (in Chinese)

[43]
Yang Z B, Zeng X F, 2010. Study on China’s regional economic disparities summary. Economic Geography, 30(6):899-905. (in Chinese)

[44]
Zhang G S, Ding Z W, Wang F Z, 2013. A study on spatial-temporal variation of economic density of central China. Economic Geography, 33(6):15-23. (in Chinese)

[45]
Zhang H F, Bai Y P, Chen Q et al., 2009. Regional economic disparities in Qinghai Province based on ESDA and GIS. Arid Land Geography, 32(3):454-461. (in Chinese)

[46]
Zhang J Q, Gong J, Liu D Q, 2018. Dynamics and driving factors of landscape fragmentation based on GeoDetector in the Bailongjiang Watershed of Gansu Province. Scientia Geographica Sinica, 38(8):1370-1378. (in Chinese)

[47]
Zhang W Z, Zhang Y L, 2018. A study of urbanization level,spatial and temporal differentiation of counties in Guangxi. Journal of Qinzhou University, 33(10):34-40. (in Chinese)

[48]
Zhou Y C, Qi Q W, Feng C R, 2002. Characteristics of dynamic variation of the inter-provincial economic difference in China in recent ten years. Geographical Research, 21(6):781-790. (in Chinese)

Outlines

/