
Journal of Geographical Sciences >
Development characteristics and construction prospects for a multi-integrated economic zone in the South China Sea Region
|
Jin Fengjun (1961–), PhD and Professor, specialized in economic geography and regional development. |
Received date: 2020-06-30
Accepted date: 2020-09-20
Online published: 2021-05-25
Supported by
Strategic Priority Research Program of the Chinese Academy of Sciences(XDA19040403)
National Natural Science Foundation of China(41771134)
Copyright
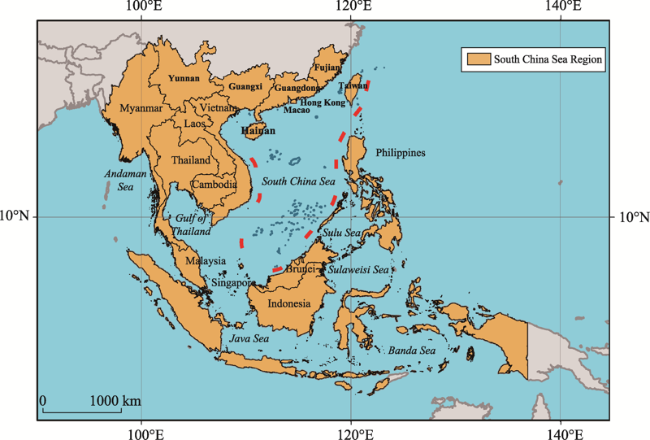
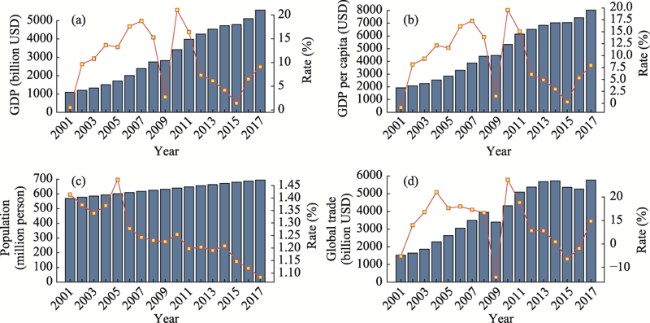
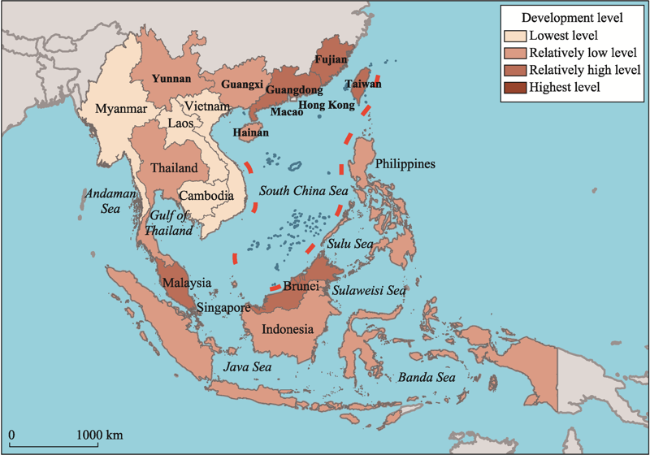
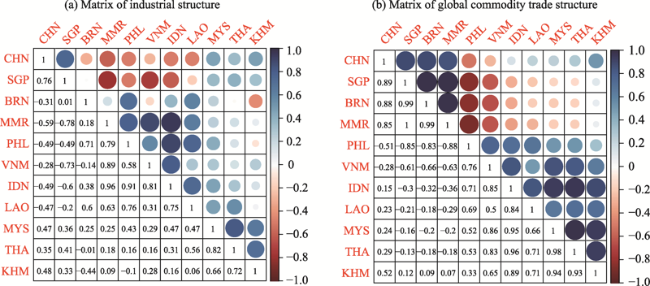
The Belt and Road Initiative (BRI) instigated by China is catalyzing the evolution of a new global economic landscape. To cope with the great changes in the economic landscape, China needs to view the South China Sea Region (SCSR) as a strategic focus and study carefully the characteristics of regional development and explore the possibility for construction of a strategic multi-integrated economic zone which includes China and ASEAN countries. Based on key indicators, this paper outlines the overall development characteristics of the SCSR and analyzes the regional structural characteristics of industry and global trade based on the indexes of industrial structure similarity and trade commodity structure coincidence; the paper also depicts the spatial characteristics of the nine core growth areas (CGAs) in the region and discusses the construction prospects for a multi-integrated economic zone in the SCSR. The results show that, first, from 2000 to 2017, the main economic indicators of the SCSR grew quite well, and the development trend was much better than the global average for the same period. Second, driven by the global industrial transfer stages and spatial paths, the level of comprehensive development in the SCSR has evolved into four categories. Third, the index values for industrial structure similarity and trade commodity structure coincidence for the 11 countries in the SCSR have remained at a high level, and reveal an integration trend not only from the horizontal and vertical perspective, but also from an upgrading and downgrading standpoint. Fourth, nine CGAs have been established in the SCSR and the advantaged industries and the export commodity types between different countries exhibited the characteristics of convergence and complementarity due to the polarization and diffusion effects of the CGAs. Finally, from a long-term perspective, the SCSR has already acquired the internal and external conditions such as the 5th global industrial transfer initiative, the reconstruction of the global value chain, regional production-consumption networks and spatial entities for building a multi-integrated economic zone in the SCSR.
JIN Fengjun , YAO Zuolin , CHEN Zhuo . Development characteristics and construction prospects for a multi-integrated economic zone in the South China Sea Region[J]. Journal of Geographical Sciences, 2021 , 31(3) : 403 -422 . DOI: 10.1007/s11442-021-1850-z
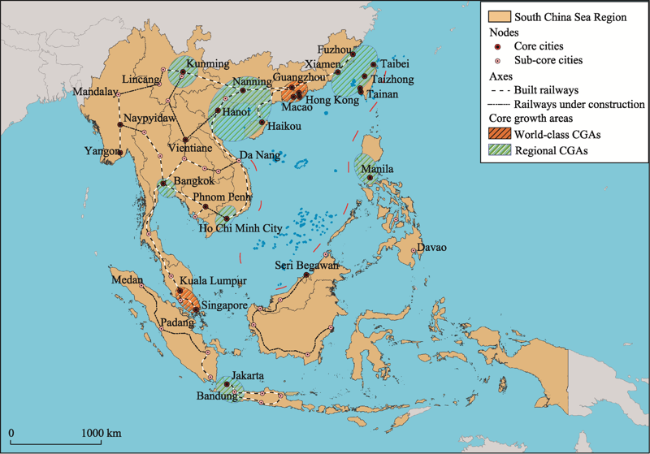
Figure 1 The study area (SCSR, South China Sea Region) |
Table 1 Multi-index evaluation system of the comprehensive development level of the South China Sea Region |
| Target layer | Criteria layers | Indexes | Units |
|---|---|---|---|
| Economies comprehensive development level | Economic development | GDP per capita | 1000 USD |
| GNI per capita | 1000 USD | ||
| GDP growth rate per capita | % | ||
| Industrial development | Proportion of GDP of non-agricultural industry | % | |
| Contribution rate of non-agricultural industry to GDP | % | ||
| Manufacturing production index | - | ||
| Social development | Unemployment rate | % | |
| Per capita consumption expenditure | 1,000 USD | ||
| Dependency ratio | % | ||
| Infrastructural construction | Internet penetration | % | |
| Density of newly registered enterprises | Per 1,000 persons | ||
| Density of class highway | km/100 km2 |
Figure 2 Evolution trends of the main development indicators of the South China Sea Region |
Figure 3 Spatial pattern of comprehensive development level of the South China Sea Region in 2017 |
Table 2 Industrial and global trade commodity structures for countries in the South China Sea Region |
| Types | Sectors | ISIC/ HS codes | Proportion (%) | ||||||||||
|---|---|---|---|---|---|---|---|---|---|---|---|---|---|
| CHN | BRN | KHM | IDN | LAO | MYS | MMR | PHL | SGP | THA | VNM | |||
| Industrial structure | Agriculture, hunting, forestry, fisheries | A—B | 8.4 | 1.0 | 21.3 | 11.3 | 16.9 | 7.3 | 19.2 | 8.1 | 0.0 | 6.8 | 14.6 |
| Mining, manufacturing, utilities | C—E | 34.4 | 50.0 | 16.6 | 24.9 | 25.8 | 28.1 | 24.1 | 19.6 | 17.2 | 25.6 | 26.3 | |
| Manufacturing | D | 0.0 | 11.1 | 14.6 | 17.3 | 7.8 | 18.4 | 19.1 | 16.3 | 16.1 | 21.3 | 14.6 | |
| Construction | F | 6.8 | 2.2 | 11.3 | 8.9 | 6.3 | 4.0 | 5.2 | 5.9 | 3.6 | 2.0 | 5.4 | |
| Wholesale, retail trade, restaurants and hotels | G—H | 11.3 | 5.5 | 12.7 | 13.6 | 14.6 | 15.9 | 16.7 | 17.0 | 16.6 | 16.5 | 13.8 | |
| Transport, storage and communication | I | 4.5 | 3.5 | 7.4 | 7.9 | 3.0 | 7.4 | 10.5 | 5.1 | 9.6 | 5.9 | 3.2 | |
| Other activities | J—P | 34.5 | 26.8 | 16.0 | 16.0 | 25.5 | 19.0 | 5.3 | 28.0 | 37.0 | 21.9 | 22.2 | |
| Global trade commodity structure | Chemical industry | 28-38 | 1.5 | 0.3 | 0.0 | 3.2 | 40.6 | 1.8 | 1.5 | 1.6 | 0.4 | 0.7 | 3.5 |
| Plastic and rubber | 39-40 | 6.9 | 0.6 | 27.6 | 9.4 | 0.6 | 15.1 | 3.9 | 4.8 | 14.0 | 15.4 | 10.7 | |
| Leather and gut | 41-43 | 0.1 | 0.1 | 0.6 | 0.3 | 0.0 | 0.1 | 0.6 | 0.0 | 0.1 | 0.8 | 1.5 | |
| Wooden product | 44-46 | 1.3 | 0.6 | 9.5 | 15.8 | 7.5 | 7.1 | 17.8 | 9.0 | 0.1 | 3.3 | 8.0 | |
| Cellulose and pulp | 47-49 | 0.0 | 0.5 | 0.0 | 9.6 | 0.2 | 0.0 | 0.2 | 0.7 | 0.4 | 0.2 | 0.0 | |
| Textile raw materials | 50-63 | 0.1 | 0.0 | 0.0 | 0.0 | 0.0 | 0.0 | 0.0 | 0.0 | 0.0 | 0.0 | 0.3 | |
| Shoes, hats, and feathers | 64-67 | 0.4 | 0.0 | 3.5 | 0.2 | 0.0 | 0.1 | 0.4 | 0.1 | 0.0 | 0.1 | 1.1 | |
| Stone and ceramics | 68-70 | 1.1 | 0.2 | 0.0 | 0.6 | 0.0 | 0.9 | 0.2 | 0.4 | 0.1 | 0.7 | 1.3 | |
| Natural metal | 71 | 1.8 | 4.9 | 47.5 | 22.1 | 42.7 | 6.1 | 30.6 | 8.7 | 16.3 | 19.3 | 2.2 | |
| Base metal | 72-83 | 4.2 | 4.5 | 0.0 | 13.2 | 1.0 | 4.7 | 27.6 | 0.7 | 1.5 | 1.3 | 10.8 | |
| Mechanical products | 84-85 | 37.8 | 27.2 | 10.5 | 23.1 | 4.1 | 48.2 | 12.0 | 58.1 | 50.1 | 50.4 | 36.4 | |
| Transportation equipment | 86-89 | 37.8 | 0.9 | 0.0 | 0.1 | 0.0 | 0.1 | 0.0 | 0.0 | 0.1 | 0.6 | 0.0 | |
| Precision instrument | 90-92 | 7.0 | 60.3 | 0.8 | 2.3 | 3.3 | 15.9 | 5.2 | 15.6 | 16.8 | 7.2 | 24.2 | |
| Weapons and ammunition | 93 | 0.0 | 0.0 | 0.0 | 0.0 | 0.0 | 0.0 | 0.0 | 0.3 | 0.0 | 0.0 | 0.0 | |
Table 3 Key development indicators of the CGAs in the South China Sea Region |
| NO. | CGAs | Area (km2) | Population (million) | GDP (USD billion) | Population density (person / km2) | GDP density (USD billion / km2) | GDP per capita (USD) |
|---|---|---|---|---|---|---|---|
| 1 | Guangdong-Hong Kong-Macao Greater Bay Area | 56,508.2 | 69.5 | 1,515.5 | 1230.2 | 26.8 | 21,801.3 |
| 2 | Singapore-Kuala Lumpur Economic Corridor | 36,333.9 | 27.7 | 594.4 | 763.4 | 16.4 | 21,429.9 |
| 3 | Gulf of Thailand Economic Belt | 22,962.0 | 13.3 | 254.9 | 581.2 | 11.1 | 19,099.0 |
| 4 | Taiwan Strait Economic Circle | 282,185.6 | 104.3 | 1,121.7 | 369.8 | 4.0 | 10,750.6 |
| 5 | Central Yunnan Economic Zone | 114,600.0 | 21.1 | 150.6 | 184.1 | 1.3 | 7,135.1 |
| 6 | Philippines Capital Economic Zone | 221,81.6 | 24.1 | 146.9 | 1086.3 | 6.6 | 6,098.5 |
| 7 | Beibu Gulf Rim Economic Circle | 140,764.0 | 66.5 | 386.9 | 472.5 | 2.5 | 5,817.5 |
| 8 | Jakarta-Bandung Economic Belt | 35,261.0 | 47.8 | 271.8 | 1356.1 | 7.7 | 5,683.1 |
| 9 | Vietnam Mekong Delta Economic Zone | 47,100.0 | 27.0 | 105.0 | 572.3 | 2.2 | 3,895.7 |
| Total | 757,896.3 | 401.4 | 4,547.7 | 529.6 | 6.0 | 11,329.2 | |
Figure 5 Spatial structure of multi-integrated economic zone in the South China Sea Region |
| [1] |
|
| [2] |
|
| [3] |
|
| [4] |
|
| [5] |
|
| [6] |
|
| [7] |
|
| [8] |
|
| [9] |
|
| [10] |
|
| [11] |
|
| [12] |
|
| [13] |
|
| [14] |
|
| [15] |
|
| [16] |
|
| [17] |
|
| [18] |
|
| [19] |
|
| [20] |
|
| [21] |
|
| [22] |
|
| [23] |
|
| [24] |
|
| [25] |
|
| [26] |
|
| [27] |
|
| [28] |
|
| [29] |
|
| [30] |
|
| [31] |
|
| [32] |
|
| [33] |
|
| [34] |
|
| [35] |
|
| [36] |
|
| [37] |
|
/
| 〈 |
|
〉 |