Effect of shipping activity on warming trends in the Canadian Arctic

  • Mian Sabir HUSSAIN , 1 ,
  • Inhye HEO 1 ,
  • Sujeong IM 2 ,
  • Seungho LEE , 2, *
Expand
  • 1. Climate Research Institute, Konkuk University, Seoul, Korea
  • 2. Department of Geography, Konkuk University, Seoul, Korea
*Seungho Lee (1961–), PhD and Professor, specialized in climate change impact. E-mail:

Mian Sabir Hussain (1975–), PhD, specialized in monsoon rainfall and polar climate. E-mail:

Received date: 2020-05-16

  Accepted date: 2020-09-08

  Online published: 2021-05-25

Supported by

Korea Polar Research Institute(PE19900)

Ministry of Education of the Republic of Korea and National Research Foundation of Korea(NRF-2016S1A3A2924243)

Copyright

Copyright reserved © 2021. Office of Journal of Geographical Sciences All articles published represent the opinions of the authors, and do not reflect the official policy of the Chinese Medical Association or the Editorial Board, unless this is clearly specified.

Abstract

This paper presents a detailed account of the effect of shipping activity on the increasing trends of air temperatures in the Canadian Arctic region for the period of 1980-2018. Increasing trend of temperature has gained significant attention with respect to shipping activities and sea ice area in the Canadian Arctic. Temperature, sea ice area and shipping traffic datasets were investigated, and simple linear regression analyses were conducted to predict the rate of change (per decade) of the average temperature, considering winter (January) and summer (July) seasons. The results indicate that temperature generally increased over the studied region. Significant warming trend was observed during July, with an increase of up to 1°C, for the Canadian Arctic region. Such increasing trend of temperature was observed during July from the lower to higher latitudes. The increase in temperature during July is speculated to increase the melting of ice. Results also show a decline in sea ice area has a significant positive effect on the shipping traffic, and the numbers of marine vessel continue to increase in the region. The increase in temperature causes the breaking of sea ice due to shipping activities over northern Arctic Canada.

Cite this article

Mian Sabir HUSSAIN , Inhye HEO , Sujeong IM , Seungho LEE . Effect of shipping activity on warming trends in the Canadian Arctic[J]. Journal of Geographical Sciences, 2021 , 31(3) : 369 -388 . DOI: 10.1007/s11442-021-1848-6

1 Introduction

The changes in Arctic temperatures are of major importance to global climate studies. Studies have reported increases in the surface air temperature in the Arctic (Przybylay et al., 2010; Vincent et al., 2018). Since the 1990s, this temperature has increased by 5℃ during winter and 2℃ during summer, which is more than twice the increase in the global mean temperature (Vincent et al., 2015; Pattyn et al., 2018). Since the early 19th century (Wijngaarden, 2015a), Arctic temperatures have exhibited increasing trends and have been the subject of ongoing scientific inquiry since the early 20th century (Wood and Overland, 2010).
Climate warming has been occurring more rapidly in the Arctic than over the interior regions of North Asia and North America (McBean et al., 2005; Anisimov et al., 2007). The average Arctic surface air temperatures during winter and summer have increased by 2.8 and 1.7 times the rates of the corresponding average temperatures in the Northern Hemisphere (Box et al., 2019). Post et al. (2019) presented an analysis of Arctic and Antarctic warming considering the annual (4℃ and 2℃) and winter (7℃ and 3℃) averages, respectively. You et al. (2013) described the regional mean temperature of the Tibetan Plateau and documented warming trends for all seasons and recorded the greatest increase of 0.40℃/decade during winter, which is less than that recorded for the Arctic region.
Previous temperature records are extremely useful for the estimation of any type of climate change in the Canadian Arctic region. Several researchers have investigated mean temperature trends in Canada and the Canadian Arctic region (Vincent et al., 2002; Vincent et al., 2018), reporting an increase of 1-2℃ in surface temperatures (Vincent et al., 2012; Wan et al., 2019). Vincent and Gullet (1999) retrieved daily temperature records from 2,000 stations and constructed a homogeneous temperature dataset of 210 stations for the period of 1895-1995. This time series of temperature over the span of 100 years was suitable for inclusion in the Canadian Historical Temperature Database (CHTD). Derksen et al. (2012) presented an integrated evaluation of changes in the Canadian cryosphere during the International Polar Year. Their key findings include an increasing trend of surface air temperatures during all the seasons over the last 40 years.
As in other Arctic regions, the mean temperature of the Canadian Arctic region is changing, with an increase in global warming of almost 1℃ per decade (Derksen et al., 2012). Some studies have presented long-term records of temperatures in the Canadian Arctic region (Przybylay, 2002; Messori et al., 2018). Other studies have also compiled records of significant increasing trends and variability in the surface air temperature. For instance, Przybylay and Vizi (2005) presented a detailed analysis of the air temperature in the Canadian Arctic region from the early instrumental period (1819-1859) to the modern era (1961-1990), reporting a moderate cooling approximately 0.3℃ lower than that of the present annual temperatures in the Arctic (Juan, 2004). Wijnagarden (2015b) examined long-term records of temperature for the months of January and July and noted increasing trends with amplitudes of 3.1℃ and 1.6℃, respectively.
Several other studies (Gachon and Dibike, 2007; Rapaic et al., 2015; Diro and Suhama, 2019) have adopted gridded products, presenting relatively reliable indicators of warming, especially in terms of greater temperature changes during winter than in summer. Way et al. (2017) compared the Berkeley Earth Surface Temperature gridded product with the homogenized temperature product of the Environment Canada station network (Vincent and Gullett, 1999) and highlighted the importance of national observatory datasets for the validation of global gridded products.
Increasing surface temperatures have been linked with regional physical effects, including a reduction in the surface area of sea ice (Howell et al., 2008; Stroeve et al., 2012; Mudryk et al., 2018) in the Canadian Arctic region. The Arctic ice cover has decreased considerably over the last few decades, with a clear trend of declining and thinner sea ice across the Canadian Arctic region. Current sea ice trends have revealed a significant reduction in sea ice in the Canadian Archipelago region and the Northwest Passage (Howell et al., 2008; Tivy et al., 2011); it has also been predicted that the Northwest Passage may be devoid of ice within the next few decades (Sou and Flato, 2009).
This reduction in sea ice, particularly during the summer, has extended the open-water season, making these regions more accessible to shipping traffic. For instance, from 2000 to 2009, the multi-year ice coverage of the Canadian Arctic Ocean was reduced by 83% (Maslanik et al., 2011). During the last few decades, the rapid decline of sea ice cover has opened the Arctic region of Canada (ACIA, 2005) and the number of voyages in Canada's waters has been increasing, particularly in the Northwestern Passage (Eguíluz et al., 2016; Pizzolato et al., 2016). Furthermore, this reduction in the sea ice cover has extended the shipping season during spring (early start) and fall (late end). These increased shipping activities and voyages are correlated with the reduction in sea ice in the Canadian Arctic region (Pizzolato et al., 2014, 2016). Across the Canadian Arctic region, most of the shipping traffic consists of goods transport, government and military ships, research vessels, oil and gas exploration, development projects, commercial fishing boats, pleasure crafts, and passenger ships. These all ship types have increased rapidly over the past two decades.
Over the past few decades, the sea ice in the Canadian Arctic region has been affected by this increase in shipping traffic (Pizzolato et al., 2016; Dawson et al., 2017); the resulting decline in sea ice is an important cause for the regional warming in recent decades (Pizzolato et al., 2014). Regardless of these concerns, the effect of sea traffic on warming of the Canadian Arctic region is a basic question which still remains unclear. Previous studies mostly examined temperature trends and effect of shipping traffic to the sea ice area of the region, however the effect of shipping traffic on the regional warming, particularly at higher latitude was not well described. To address this issue, we examined the trends of average temperature at 27 stations located in the Canadian territories of Nunavut, Northwest Territories, and northern Quebec with sea traffic. This study aims to determine the effect of shipping activities on the surface temperature in the Canadian Arctic region. In particular, it aim to examine warming trends for January and July, from the lower to higher latitudes.

2 Data and methodology

2.1 Datasets

The surface air temperature data used to evaluate temperature trends include datasets for the Canadian territories of Nunavut, the Northwest Territories, and northern Quebec; these datasets were compiled by the Climate Research Division of Environment Canada. The datasets comprise station-level observations, which were selected to compute the rate of change in temperature in the Canadian Arctic region during the period of 1980-2018.
Temperature datasets were obtained from the National Climate Data Archive (NCDA) of Environment Canada. The daily mean surface air temperature is the average of the daily maximum and minimum temperatures, while the monthly mean temperature is calculated as the average of the daily mean temperatures for a specific month. The NCDA of Environment Canada is responsible for maintaining the quality of climate data recorded at Canadian weather stations. The temperature records from 27 weather stations throughout the Canadian Arctic territories, Nunavut, the eastern Northwest Territory, and northern Quebec were investigated. Although this study focuses on the Nunavut territory of Canada, a few stations in the Northwest Territory and northern Quebec were also added to improve spatial coverage (Figure 1).
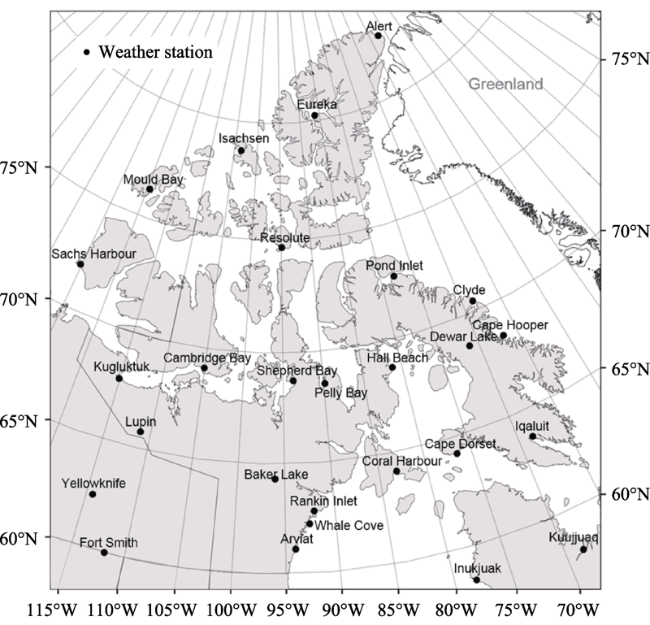
Figure 1 Locations of the weather stations in the Canadian Arctic region considered in this study
The weather observation network in the Canadian Arctic has undergone considerable changes, particularly since 1990, owing to the downsizing of traditional weather observatories; the network has since been replaced with a digital automated weather system. The resulting data-related issues include station relocation, changes in instruments, data observation practices, and aggregation of observations from neighboring sites, which introduce non-climate variations that interrupt climate trends.
Appropriate identification of “inhomogeneity” has been the focus of a major proportion of previous research. Gullett et al. (1990) proposed an approach to achieving homogeneity in a temperature series, based on the classic work of Mithell (1961). Subsequently, Vincent (1990) developed a novel assessment procedure, and Gullett et al. (1991)applied this method for assessing the homogeneity of a temperature series from Canada. Such efforts (Gullett et al., 1991) led to the founding of the Historical Canadian Climate Database (HCCD, Gullett et al., 1992), which includes temperature data from 131 stations in Canada. Thereafter, Vincent and Gullett (1999) developed a method that incorporated several significant historical improvements in the temperature data of the HCCD (Gullett et al., 1992), for inclusion in the CHTD. The CHTD is the largest homogenized and complete dataset of monthly mean maximum and minimum temperatures (Gullett et al., 1992) recorded at 210 weather stations.
In these datasets, which cover a long time period, station relocations, changes in data observation time, and the combining of temperature records from co-located stations contribute toward non-climate related variations. Vincent and Gullett (1999) applied two regression models for determining the homogeneous base of an individual station. After the application of these models, an auto-correlation procedure was also employed. To confirm data adjustments, high-confidence linear trends were subsequently calculated for all the stations (Vincent and Gullett, 1999). The considerable contribution of this work was the identification of a minimum bias temperature and its adjustment, particularly over eastern and northern Canada (Vincent and Gullett, 1999). In a following attempt (Vincent et al., 2002), a method was developed to homogenize daily temperature, which significantly improved the spatial patterns of temperature trends over Canada. The results of a few recent studies (Vincent et al., 2012; Vincent et al., 2018) have shown agreement with these adjustments of temperature data (Vincent and Gullett, 1999; Vincent et al., 2002).
Vincent et al. (2012) presented second-generation homogenized temperature datasets from 338 stations across Canada. The most important outcome of this work was the combination of data from two, three, or more co-located stations into a single series. This new procedure of monthly temperature data adjustment is based on a quantile matching algorithm (Vincent et al., 2012). The homogenized monthly time series of surface air temperature (Vincent et al., 2012) provides optimal datasets of temperature records in Canada, along with detailed documentation of the preparation procedures. This second-generation homogenized Canadian monthly surface air temperature dataset is available at http://www.ec.gc.ca/dccha-ahccd/, which is hosted by Environment Canada. The stations that were selected for the analyses in this study are listed in Table 1.
Table 1 Information regarding climate stations considered in this study
Stations Latitude (°N) Longitude (°W) Elevation (m)
Kuujjuaq 58.06 68.42 40
Inukjuak 58.28 78.10 24
Fort Smith 60.01 111.88 205
Arviat 61.11 94.06 10
Whale cove 62.17 92.58 12
Yellowknife 62.27 114.37 206
Rankin Inlet 62.81 92.09 32
Iqaluit 63.75 68.52 34
Coral Harbour 64.14 83.16 62
Cape Dorset 64.23 76.54 48
Baker Lake 64.32 96.02 19
Lupin 65.45 111.14 490
Kugluktuk 67.83 115.10 23
Dewar Lake 68.42 71.02 527
Cape Hooper 68.47 66.83 390
Pelly Bay 68.53 89.87 325
Hall Beach 68.77 81.22 9
Shepherd Bay 68.80 93.42 43
Cambridge Bay 69.12 105.06 31
Clyde 70.45 68.48 27
Sachs Harbour 71.59 125.20 86
Pond Inlet 72.70 77.96 62
Resolute 74.70 94.83 68
Mould Bay 76.14 119.58 12
Isachsen 78.47 103.50 25
Eureka 80.02 85.95 10
Alert 82.50 62.37 31
The regional monthly average data for the surface area of sea ice in July were obtained from the National Snow and Ice Data Center (NSIDC) of the Defense Meteorological Satellite Program (DMSP); these data are based on gridded sea-ice concentrations (Fettere et al., 2017). Detailed instructions on using these data can be found on the product page (https://nsidc.org/data/g02135). The Arctic dataset was divided into 14 regions, with regional boundaries defined by the Arctic Sea Ice News and Analysis (ASINA) and a regional index of sea ice concentration. The seas surrounding the Canadian Arctic region, namely the Baffin Sea, Beaufort Sea, Hudson Bay, and the Canadian Archipelago, were chosen as locations for examining the effect of the reduced sea ice concentration on temperature. The average sea ice area for the northern route of the Northwest Passage was obtained from the Sea ice in Canada website (https://www.canada.ca/en/environment-climate-change/services/environmental-indicators/sea-ice.html). The time period for this northern route was from June 25 to October 15 (Environment Canada, 2019).
Annual shipping traffic data were obtained from Transport Canada's Northern Canada Vessel Traffic Service Zone Regulations (NORDREG) of the Canadian Coast Guard for the period of 1983-2018; however, the shipping data for 1986 were not available. These data consisted of the total number of vessels and voyages for each year. Here, the number of voyages was used to establish associations between shipping traffic and the reduction in sea ice area in the Canadian Archipelago and the northern route of the Canadian Arctic. Geographically, a voyage refers to the entrance and exit of a vessel from the NORDREG zone. A vessel often makes several voyages a year. Only voyages operating with a gross tonnage of 300 tonnes or more are considered as “vessels” in the Arctic waters by the Canadian Coast Guard. The vast majority of shipping traffic in this region occurs during summer, specifically from June to the end of October.

2.2 Methodology

To compare the warming trends with sea traffic at 27 stations located in the Canadian territories of Nunavut, Northwest Territories, and northern Quebec, we computed the effect of shipping activity on the surface air temperature in the Canadian Arctic region. Statistical analyses of all datasets were conducted using two techniques: simple linear regression and the Spearman correlation method. Both these statistical tests are widely used in climatology and have been explained in numerous studies (Zhang et al., 2000; Field, 2005; Cuttko and Lamoureux, 2009; Candlish et al., 2015).
The simple linear regression technique is the most commonly used method for detecting climate trends by revealing changes in climate records. The magnitude/change in the surface air temperature, total sea ice area, and the annual number of voyages were calculated using the simple linear regression technique. The decadal changes in the temperature data series were calculated using the slope rate, which was obtained by applying the regression method to data from the study period. Regression coefficients, providing information regarding annual changes in the investigated data, were used to determine the magnitude of trends (Okereke, 2011). Trends that were significant with p≤0.05 were considered relevant for the discussion of warming trends at those specific stations.
Correlation coefficient values were obtained using the Spearman correlation technique. This statistical test is used to measure the degree of relationship between two variables, followed by their rank. This correlation test simplified the computations of data distribution (Wilks, 2006) and is a suitable method for analyzing the relationship between two elements. This test considers the associations among all possible matchings of the data ranks (Wilks, 2006). Correlation coefficients from the Spearman test with a significance level of 0.50 and above represent a statistically significant relationship. The correlation coefficients between sea ice concentration and shipping traffic were calculated to determine if there was any association with the temperature trends. This test was focused on examining the response of the sea ice area to shipping activity. The correlations were considered at a statistical significance level of 0.01. To evaluate the relationship between the time series of sea ice area and the number of voyages for a particular year, a trend line was fitted to a scatter plot of the data.
To analyze the coldest and warmest seasons of the Canadian Arctic region, temperature data for January and July, recorded at 27 stations, were examined. These months exhibit different trends in terms of temperature, providing an understanding of the seasonal climatology of the region (Wijngaarden 2015b). In the case of the Lupin and Isechen stations, temperature records were computed from 1982 and 1998, respectively, with the aim of improving the spatial coverage of the study region. Before computing these trends, an annual time series was plotted for each station to identify any evident outliers in the datasets. Changes in these trends were compared in terms of the mean, maximum, and minimum temperatures. The trend for mean temperature demonstrated compact statistical results throughout the Canadian Arctic records. Thus, this research primarily focuses on the trends of mean temperature; however, descriptions of maximum and minimum temperature have also been provided where necessary.

3 Results and discussion

3.1 Spatial trends and variability of temperature

The results indicate that mean temperature increased throughout the study region. This increase fluctuated between 1℃ and 2℃ for the entire study period of 1980-2018. The temperature in winter exhibited the largest positive change. This trend of increasing mean temperatures occurred throughout the study period (Figure 2a). In particular, three main areas with the most significant increases can be identified: Baffin Island, the northwestern part of the Canadian Arctic, and the northwestern bank of Hudson Bay. Figure 2a offer a systematic depiction of the results, including the change rate of mean temperature during January at various stations in the Arctic region of Canada.
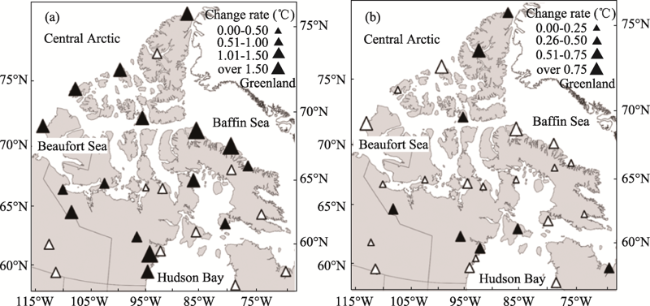
Figure 2 Change rate of mean temperature (per decade) in January (a) and July (b) over the Canadian Arctic, the solid triangles indicates the statistical significance of mean temperature trends (p≤0.05), and the blank triangles indicates non-significant trends (p≥0.05)
Although a majority of the stations exhibited differences that exceeded 1℃, according to a spatial examination of the investigated stations, there was a general increase in temperature over the Canadian Arctic region. Baffin Island, the northwestern region of Hudson Bay, and northwestern Canada exhibited most significant changes in mean temperature, as compared to other areas of the Canadian Arctic, during January (Figure 2a). This pronounced, stronger trend revealed more significant increases at the lower end of the daily temperature than at the higher end.
During January, mean temperature exhibited significant increases in the northern parts of Baffin Island and over the eastern Canadian Arctic. During the study period, the increasing trend exhibited by mean temperature was more evident at Baffin Island in the region of the Arctic Coridillera. At the Pond Inlet and Clyde stations, mean temperature increased by 1.7℃ per decade. This indicates an increase in the rate of winter warming, with initial increases of a few degrees to the present significant change near Baffin Bay. Przybylak et al. (2002) reported that the high winter temperature was influenced by atmospheric circulation, which varies from year to year.
Similarly, an increase in the winter temperature was also documented near northwestern Hudson Bay. However, on the eastern bank of Hudson Bay, the increase in mean temperature over northern Quebec was lower than that over Baffin Island. The important causes for the increasing winter temperatures are the rapid regional warming and anthropogenic activities over the eastern Canadian Arctic (Wan et al., 2018).
Over northwestern Canada, mean temperature exhibited an increase of 1-2℃ per decade, particularly at the Mould Bay, Saches, and Alert stations. The Beaufort Sea region exhibited warmer average winter temperatures than any other region in the area. Beaufort Sea is thought to moderate the air temperature during ice-covered winter months (Candlish et al., 2015). From June to July, the maximum temperatures generate sufficient solar heat, which enters the seawater through flaw leads and polynyas. The energy stored in the ocean water is combined with that in the surface water, which still exhibits a regional effect, resulting in the melting of sea ice (Stroeve et al., 2012). This warming flow of the Beaufort Sea affects the temperatures of the western Canadian Arctic. From 1980 to 2018, the western Canadian Arctic exhibited a strong warming trend, with mean temperature increasing by 2℃ per decade.
The analysis of mean temperature during summer is depicted in Figure 2b. The spatial results indicate an increasing trend across the study area. According to the observations for July, the increase in mean temperature fluctuated between 0.25℃ and 1.00℃. There was a characteristic increase of up to 1℃ in the temperatures during July, which is a historically significant increase. On average, July in the Canadian Arctic was colder than today by 1.5-2.2℃ during July (Przybylak and Vizi, 2005). A majority of the stations revealed frequent increases of as much as 1℃ in mean temperature during July. The increasing trend over the eastern Canadian Arctic during summer also creates a circulatory pattern of the mean zonal flow over the western Atlantic basin (Slonosky and Graham, 2005), with similar trends to those reported by Zhang et al. (2000). However, during July, the eastern Canadian Arctic and northwestern Canadian Arctic regions exhibited a higher increase than the remainder of the study area.
The temperatures from the southern Canadian Arctic region, near the mainland of Canada, including the southern part of the Northwest Territory, southern Nunavut, and northern Quebec, exhibited an increasing trend during July. Throughout this region, the change in temperature ranged from 0.25℃ to 0.50℃. A theory proposed by Assani et al. (2018) states that, compared to regional climate factors, local site characteristics and microclimate effects have a more significant influence on daytime temperatures. Consequently, local warming during July (the warmest period of summer) strengthens the convective movements that affect daytime temperatures. These local convective mechanisms result in conventional clouds, resulting in dispersed storms and increased temperatures at the local level (Assani et al., 2018). This increasing temperature over southern Quebec is also pronounced by the Atlantic Multidecadal Oscillation (Assani et al., 2019).
The mean temperature for July in the northwestern Canadian Arctic region also exhibited a significant increasing trend. Over the western Canadian Arctic, the change in temperature ranged between 0.50℃ and 1.00℃. In this region, the melting of sea ice is sensitive to increasing temperatures. The sea ice cover limits the effects of oceanic forces; owing to the decrease in this cover, warm Atlantic water enters the Arctic Ocean through the Fram Strait and moderates the surface water of the Arctic Ocean with fresher water (Schauer et al., 2004; Stroeve et al., 2012). Similarly, a few relationships between the Pacific Ocean and the Chukchi and Beaufort seas have been established. Shimade et al. (2006) noted an increase in the temperature of the Arctic Ocean and a sharp reduction in the sea ice in Beaufort Sea during summer. The energy stored during summer increases the temperature of the upper ocean through leads and polynyas. This warmer surface water results in the melting of sea ice and an increase in the heat gain (Jackson et al., 2010). This phenomenon has expanded northward, and the heat has been retained for a longer time; consequently, the ice has melted and reduced the ice thickness (Stroeve et al., 2012).
Spatial analyses are more relevant when the temperature is examined in terms of the latitudinal extent. Different latitudes exhibit varying trends for decadal changes. In particular, a large increase in temperature occurred northwards of 70°N. In January, mean temperature exhibited an increase throughout the Canadian Arctic. The magnitude of this change was not identical at all the investigated stations. However, the stations located inside the Arctic Circle recorded a significant change in temperature. In July, a pattern of increasing mean temperature was observed over the high latitudes of the Canadian Arctic, particularly from 70°N north. At the lower latitudes (58°N to 70°N), mean temperature exhibited a rate of change between 0.50℃ and 1℃. However, within the Arctic Circle, the Sachs Harbour, Pond Inlet, Isachsen, and Eureka stations exhibited a high increase of 1-2℃ in mean temperature.
The results indicate an increasing trend for temperature, from the lower to higher latitudes, particularly above the Arctic Circle over the Canadian Arctic (McBean et al., 2004; Hanna et al., 2012). Figure 3 depicts the decadal change in temperature for January and July, according to latitudinal extent. For example, in January, the change rate of mean temperature of investigated stations exhibited a gradual increasing trend (Figure 3a). In contrast, during July, the local stations between 58°N and 72°N show static trend (Figure 3b). Another significant observation was noted during July; a larger range of increase in mean temperature was observed above 72°N, whereas lower latitudes (58°N to 72°N) revealed a smaller range of increase in the temperature. The relationship between the rate of change for the mean temperature and the latitudes indicates that stations at higher latitudes indicate a more pronounced positive trend. However, the rate of change of the mean temperature is not statistically significant at several stations. The intensification of the warming trend over high latitudes, as compared with that at lower latitudes, indicates the necessity of investigating shipping activity in the region.
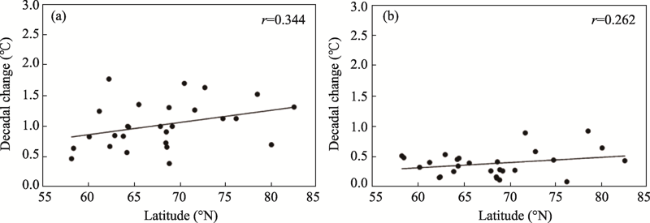
Figure 3 Decadal trend of mean temperature during January (a) and July (b). Mean temperatures in January showed a more pronounced increase with latitudinal extent, whereas those in July revealed increasing trend from 70°N

3.2 Shipping trends and variability

The Northwest Passage is a sea route that connects the Atlantic and Pacific oceans through the Canadian Arctic Archipelago region. This navigational path is a network of straits, sounds, channels, and local gulfs in the Canadian Arctic waters, connecting the Baffin Sea in the east and the Beaufort Sea in the west. This sea passage, running east to west in the Canadian Arctic waters, is defined by the NORDREG (Figure 4), and it extends from Lancaster Sound, through the eastern Parry Channel, and passes through the M'Clure Strait. Geographically, this sea route forms part of the Canadian Archipelago. The Arctic region of Canada is highly dependent on marine transportation. Consequently, shipping activities in this region have increased over the last three decades. Particularly, marine transportation in the Northwest Passage during the summer season has increased rapidly.
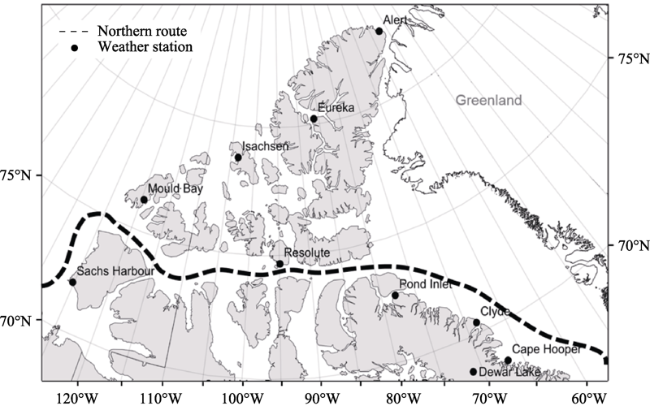
Figure 4 Northern route of the Northwest Passage in the Canadian Arctic region. This sea passage extends from Baffin Bay, through the Lancaster Sound and eastern Parry Channel, and passes through the M'Clure Strait to the Beaufort Sea
Arctic shipping traffic, as characterized by the total annual number of voyages, in this region has gradually increased during the period of 1983-2018. However, since 2007, there has been a significant and abrupt increase in the number of voyages each year (Figure 5). In the Canadian Arctic region, shipping traffic has increased significantly by 76% during the period of 1983-2018. From 1983 to 2018, among the various categories of voyages, general cargo increased by 36%, tankers by 37%, tugs by 67%, passenger vessels (cruise ships) by 81%, bulk carriers by 24%, and grain ships by 0.1%, while fishing boats and ships increased by 66%. Statistically, the rate of increase in the number of voyages was 7 voyages per year, which represents a significantly increasing rate of shipping traffic.
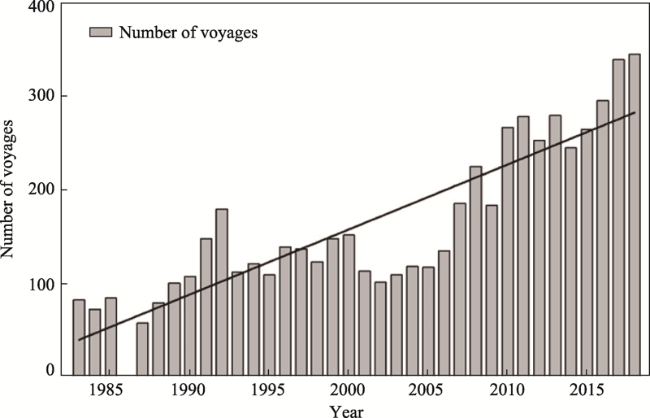
Figure 5 Total annual number of voyages in the Northwest Passage (1983-2018). The bars indicate a static number of voyages between 1993 and 2004 and a steep increase in shipping after 2005
This trend of increasing shipping traffic in the Canadian Arctic waters has previously been reported by several studies (Pizzolato et al., 2014, 2016; Dawson, 2018). In the time series of the annual total voyages, the lowest number of voyages (73) occurred in 1984, whereas the highest (348) occurred in 2018. The year of 2007 represents a regime shift (Pizzolato et al., 2014), as the sea ice area was at a minimum during this year (Strove et al., 2012). Through statistical examinations, an r2 value of 0.76 was reported, and the rate of increase in the annual number of voyages during the investigated period was defined by the line y = 7.01x - 13852.2. The analysis shows that the number of annual voyages began increasing from 1987. From 1993 to 2004, there was a relatively static period, with limited variation in the number of annual voyages. However, from 2006 onward, a steep increasing was observed (Figure 5).
Several types of unique vessels with a variety of cargo operate within the Canadian Arctic region. The types of vessels operating in this region have steadily increased, including government and private ice breakers, research ships, and general cargo ships. In particular, the tourism sector has expanded rapidly in recent years. Currently, pleasure- and passenger-vessel activities have shifted from the Hudson Bay region to the Northwest Passage. Thus, the proportion of private-sector pleasure vessels is growing rapidly, followed by tanker ships and fishing vessels. The numbers of other vessels such as bulk carriers and passenger ships have also increased. Fishing vessels are concentrated around the northeast of Baffin Island and are expanding further northwards.

3.3 Trends and variability in sea ice changes

July is the warmest month in the Canadian Arctic region; therefore, it is assumed that the characteristics of mean temperature during July are important for understanding the melting of ice and fresh snow in this region (Chutko and Lamoureux 2009). It is reasonable to speculate that the increased mean temperature during July results in the increased melting of ice. The decline in the sea ice area in the Arctic is a substantial contributor to the increase in temperature over recent decades (Pizzolato et al., 2014). Thus, the trend and variability in the sea ice area were measured in four sub-regional seas of the northern Canadian waters: Baffin Bay, Hudson Bay, Beaufort Sea, and the Canadian Archipelago.
Sea ice is a prominent feature in the Canadian Arctic region. The area of sea ice is significantly relevant to the increasing summer temperatures. Currently, the amount, area, and type of sea ice are notably at a minimum. Regional patterns of the reduction in sea ice during July are illustrative of this concern. The results show that the sea ice area of the northern Canadian waters decreased during the study period. Figure 6 presents the monthly trends of the sea ice area for the four sub-regions of the northern Canadian waters during July. It is evident that the sea ice area in all four sub-regions decreased substantially. In particular, the retreat rate of the sea ice area is the highest in Baffin Bay and the Beaufort Sea.
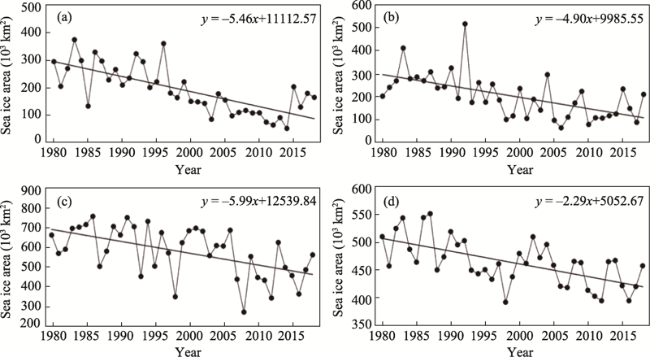
Figure 6 Average Arctic sea ice area from 1980 to 2018 for Baffin Bay (a), Hudson Bay (b), Beaufort Sea (c), and Canadian Archipelago (d)
According to the investigated data, the Baffin Bay, Beaufort Sea, Hudson Bay, and Canadian Archipelago have lost 200,000, 200,000, 175,000, and 75,000 km2 of sea ice, respectively, during the period of 1980-2018. The decline in the sea ice area in Baffin Bay and the Beaufort Sea is more significant to the increasing temperatures over the Canadian Arctic, as compared to the declines in other regions (Figure 6). The area of sea ice has reduced sharply in the eastern Canadian Arctic (Baffin Bay) and in the southwest (Beaufort Sea). A trend of declining sea ice is observed in all Canadian marine regions (Derksen et al., 2012; Mudryk et al., 2018). The loss of sea ice in the Canadian Archipelago is one of the reasons for the increasing temperatures in the Canadian Arctic (Pizzolato et al., 2014).
Similarly, over the study period, the sea ice area decreased over the northern route of the Northwest Passage. In the past, this route was covered by thick ice throughout the year. Currently, various types of marine vessels operate along this part of the Canadian Arctic region. This area has experienced considerable loss in the sea ice area during summer, particularly from 2007 to 2012, which was characterized by the consistently low amounts of ice, with the lowest ice area observed in 2011.
To confirm the reduction in the sea ice area along the northern route, the ratio of the sea ice area in the northern route was calculated and compared to that of the Canadian Archipelago (Figure 7). To calculate the ratio of sea ice area, the averages of the first 10 years of the dataset (1980-2018) were considered, due to the unavailability of datasets on the extent of sea ice. However, a simple method of percentage calculations was applied to the obtained values. The same method was applied to the sea ice areas of the northern route and those of the Canadian Archipelago. The melting rate of sea ice (in percentage) is described by regression lines y = -0.66x + 1410.55 and y = -0.46x + 1005.52 for the northern route and the Canadian Archipelago, respectively. Thus, it was observed that the melting of sea ice in the northern route (6.6% per decade) was faster than that in the Canadian Archipelago (4.6% per decade). This is indicative of the substantial effect of shipping traffic on the sea ice in the region. The sea ice area ratio of the northern route decreased from 2010 to 2012, and the annual shipping data indicated an increase from 2010. This declining sea ice has a significant effect on the sea traffic in the northern Canadian Arctic Waters (Pizzolato et al., 2016).
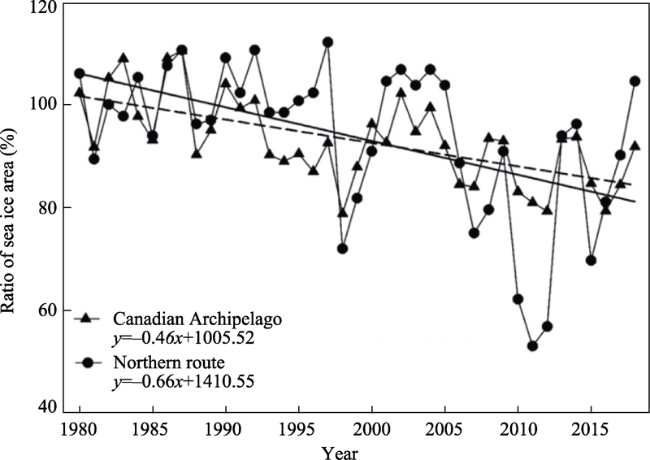
Figure 7 The ratio of sea ice area in the northern route (solid circle) and the Canadian Archipelago (solid triangle) in the Canadian Arctic. Regression lines for the northern route (solid line) and the Canadian Archipelago (dashed line) are indicated

3.4 Interactions between shipping traffic and sea ice

The correlation between the sea ice area along the northern route and the number of voyages clearly establishes the impact of shipping traffic on the Canadian Arctic region. This relationship supports the hypothesis that sea traffic has a negative effect on the sea ice in the region. The relationship between the annual number of voyages (of all vessel types) and sea ice area over the northern route has a strong negative correlation coefficient of r = -0.540, at a significance level of 0.01.
A scatter plot of the sea ice area in the northern route with respect to the number of voyages per year is presented in Figure 8. This scatter plot indicates a considerable association between sea ice and the number of voyages. Similar points are firmly grouped around the best-fit line, which implies a significant negative association (at a significance level of 0.01) between sea ice area and the number of voyages in the data series. However, the plots for 1998, 2011, and 2018 appear away from the fit line. According to the inter-annual variability of the sea ice area in the northern route, an extreme decline was observed in 1998 (Environment Canada, 2019). This historic decline in the sea ice is associated with a high pressure cell over Greenland, coupled with a low-pressure system over Hudson Bay during summer. These thermodynamics produce warm southerly flows over the Canadian Archipelago region and create an environment of warm temperatures, resulting in a prolonged melting season (Howell et al., 2010). Another documented reason for the sea ice reduction in 1998 is the inflow of warm water from the Beaufort Sea, through the McClure Strait, into the western Parry Channel (Atkinson et al., 2006). Examinations indicate that 2011 was also a year with low ice. The decline in sea ice over the Canadian Archipelago in 2011 was associated with positive surface air temperatures and net solar radiation, which increased the rapid melting period (Howell et al., 2013). The year 2018 appears at a distance from the fit line due to the rapid increase in the number of voyages.
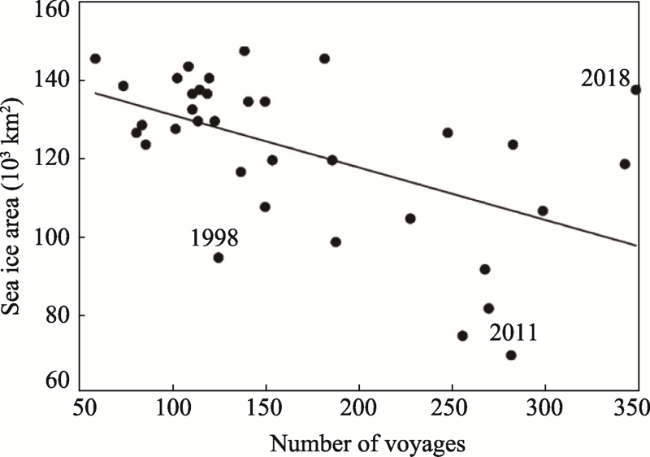
Figure 8 Relationship between annual number of voyages and sea ice area for the northern route in the Canadian Arctic. The solid regression line is indicated
As shown in Figure 8, the cluster of data points near the vertical axis of the graph is associated with a larger sea ice area and a lower number of voyages, particularly from 1983 to 1990. Since 2010, shipping traffic has exhibited a continuously increasing trend, which is consistent with the findings of other studies (Pizzolato et al., 2014, 2016; Carter et al., 2017; Dawson et al., 2018). Thus, the increased shipping traffic exhibits a significant negative correlation with the reduction of sea ice area over the last decade.
A comparison of the mean temperature for stations located along the northern route and those located above 70°N is presented in Figure 9. It can be seen that the rate of change of the mean temperature was higher in January and July at stations situated along the northern route, as compared to the stations in the northern Canadian Arctic. Five stations—Sachs Harbour, Mould Bay, Resolute, Pond Inlet, and Clyde—are located along the northern route.
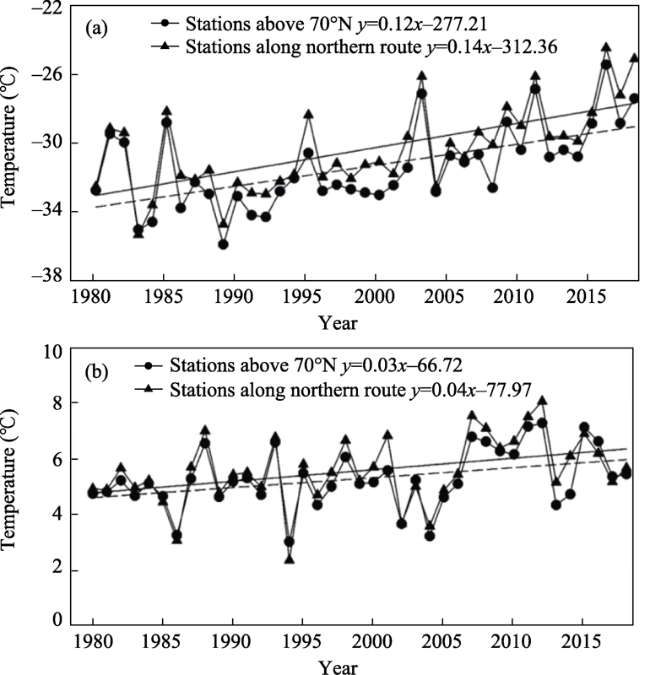
Figure 9 Mean temperature in January (a) and July (b) at stations located above 70°N (dashed line and circle) and stations located along the northern route (solid line and triangle)
Comparative analyses showed that, in January and July, stations along the northern route recorded a more rapid increase in the mean temperature than those in the remainder of the northern Canadian Arctic. Based on an analysis of the data for January, r2 values of 0.41 and 0.34 were determined for the stations along the northern route and those above 70°N, respectively. Similarly, based on the data for July, r2 values of 0.15 and 0.14 were determined for stations along the northern route and those situated above 70°N, respectively. The rate of increase in the mean temperature during January is expressed by the lines y = 0.14x - 312.36 and y = 0.12x - 277.21 for stations along the northern route and those located above 70°N, respectively. Moreover, the rate of increase of the temperature in July is described by y = 0.04x - 77.97 and y = 0.03x - 66.72 for stations along the northern route and those located above 70°N, respectively. Hence, the rate of increase in the mean temperature is higher in January, with average increments of 1.4℃ and 1.2℃ for stations located along the northern route and those located above 70°N, respectively.
The percentage differences in the rate of change in temperature during July for stations located along the northern route and the stations located above 70°N were found to be 17% and 33%, respectively. To calculate these percentage values, we first obtained the difference in the rate of change for the stations along the northern route and those located above 70°N;thereafter, a simple percentage was calculated to determine the differences in temperature. The greater difference in the change in temperature for stations along the northern route (33%) supports the hypothesis of increasing temperatures during July.
The discussion herein provides evidence of an extended shipping season and the corresponding length of the annual sea-ice melting season in the Canadian Arctic region. Sea traffic operations are continued beyond the traditional shipping season from June 25 to October 15. Recently, the sea traffic during November has increased due to the increasing duration of the sea-ice melting season (Pizzolato et al., 2014). This prolonged shipping season deteriorates the sea ice cover, creating leads and polynyas; these, in turn, trap solar heat and increase the temperature of the upper ocean. This effect on temperature can be observed up to a distance of 10-100 km (Candlish et al., 2015). Thus, this extended shipping season can be used to differentiate between the rate of change in the mean temperature for stations along the northern route and the stations in the northern Canadian Arctic. The stations situated along the northern route, particularly Pond Inlet and Clyde, indicated significant changes in temperature during the summer and also experienced the heaviest sea traffic among all the local stations (Dawson et al., 2017). This increase around the station of Pond Inlet is primarily related to increases in tourism vessels, tanker ships, and bulk carriers. Pleasure- and passenger-vessel activity has shifted from the Hudson Bay region to the Northwest Passage (Dawson et al., 2018). Fishing vessels at the northeast of Baffin Island have been increasing, and these fishing activities have been expanding further northwards. This physical activity leads to the amplification of polar warming in northern areas at high latitudes, as compared with that in the areas at lower latitudes in the Canadian Arctic region.
Figure 10 illustrates the relationships among increased shipping traffic, declining sea ice area, and increased temperature in the Canadian Arctic. This verifies that the spatial-temporal trends of temperature are affected by the reduction in sea ice area in the Canadian Arctic waters. Despite some speculation, the decline in sea ice is an important factor that is influenced by the shipping trend. A relationship between increasing temperatures in the Canadian Arctic and the increased shipping activity was established. This supports the hypothesis that the increasing temperature is a result of the reduced sea ice area and the increased shipping traffic in the region (Pizzolato et al., 2014). The Canadian Arctic region is undergoing considerable increments in the mean temperature during winter, as compared to that during summer. For the month of January, the mean temperature increased by 1.0-1.7℃ per decade from 1980 to 2018. Temperature is extremely sensitive to minor changes in the sea-ice cover during winter (Candlish et al., 2015). This rapid warming trend hinders the increase in the sea ice area during winter, which, in turn, accelerates the melting of sea ice during summer. For instance, increasing temperature limits the sea ice area during winter, which negatively affects the sea ice during summer. This negative feedback effect is a significant contributor to the increasing mean temperatures in the Canadian Arctic region.
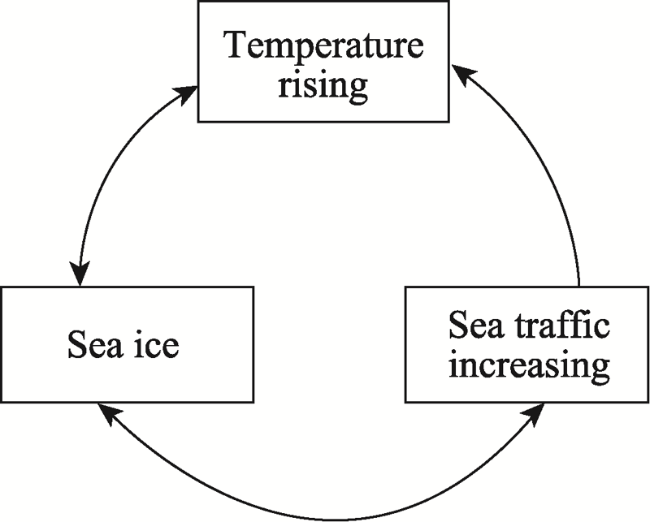
Figure 10 Feedback loop of sea traffic, sea ice and temperature in the Canadian Arctic region

4 Conclusion

This paper presents a detailed account of the effect of shipping activities on the increasing trends of surface temperatures in the Canadian Arctic region during January and July for the period of 1980-2018. The regions of Baffin Island, northwestern Hudson Bay, and northwestern Canada exhibited high increments of 1-2℃ per decade in the temperature during January. Considerable warming was observed during July, with an increase of up to 1℃ per decade, which is a historically considerable increasing trend for the Canadian Arctic region. Spatial analyses of the temperature in terms of latitudinal extent revealed a pattern of increasing temperatures from low latitudes to high latitudes, for the month of July.
For the study period, regional patterns of reduction in the sea ice area were observed during July. Moreover, the melting of sea ice in the northern route of the Northwestern Passage was faster than that in the remainder of the Canadian Archipelago. A comparative analysis of the sea ice areas in the Canadian Archipelago and the northern route indicates the significant detrimental effect of shipping traffic on the sea ice cover. This declining sea ice area, in turn, has a significant positive effect on the shipping traffic in the Canadian Arctic region.
Substantial differences in the mean temperature were recorded at stations located along the northern route, with a higher rate of increase in the northern Canadian Arctic. The greater change in the temperatures for stations along the northern route is supported the conclusion by the increasing temperatures in July. By verifying the relationship between increased shipping traffic and the declining sea ice area, we reveal that the increasing temperatures of the Canadian Arctic region, particularly at stations along the northern route, are associated with both these factors, i.e., the declining sea ice area and the increasing shipping activity.
This study provides the first schematic reflection of the relationship between increasing temperature in the Canadian Arctic region and the reducing sea ice concentration and increasing shipping traffic. The number of marine vessels and voyages in the Canadian Arctic waters continue to increase. Additionally, the southern Canadian Arctic region has experienced a reduction in shipping activity, and the Northwest Passage has received unprecedented international attention owing to Arctic tourism and commercial operations. We expect that this shipping traffic will continue to increase in future decades, with a corresponding decrease in the sea ice area in the northern Canadian Arctic region. This study can help understand the trends of warming in the Arctic region in relation to the shipping traffic; it also provides a strong basis for policy making and decisions regarding the development of the Arctic region of Canada.

Acknowledgements

The authors would like to thank IGSNRR, CAS, GSC as well as editors of the JGS and the anonymous reviewers for their helpful comments and suggestions that have improved the manuscript.
[1]
Anisimov O A, Vaughan D G, Callaghan T V, et al., 2007. Polar regions (Arctic and Antarctic). Climate Change 2007: Impacts, adaptation and vulnerability. In: Parry M L, Canziani O F, Palutikof J P et al. (eds.). Contribution of Working Group II to the Fourth Assessment Report of the Intergovernmental Panel on Climate Change. Cambridge: Cambridge University Press.

[2]
Assani A A, 2018. Comparison of the temporal variability of maximum daily temperatures for summer months in relation to El Niño events in southern Québec. Extreme weather, Philip John Sallis,IntechOpen, 1(74548):1-10.

[3]
Assani A A, Maloney-Dumont V, Pothier-Champagne A et al., 2019. Comparison of the temporal variability of summer temperature and rainfall as it relates to climate indices in southern Quebec (Canada). Theoretical and Applied Climatology, 137(3/4):2425-2435.

DOI

[4]
Atkinson D E, Brown R, Alt B et al., 2006. Canadian cryospheric response to an anomalous warm summer: A synthesis of the climate change action fund project “the state of the Arctic cryosphere during the extreme warm summer of 1998”. Atmosphere-Ocean, 44(4):347-375.

[5]
Box J E, Colgan W T, Christensen T R et al., 2019. Key indicators of Arctic climate change: 1971-2017. Environment Research Letters, 14(4):1-19.

[6]
Candlish L M, Iacozza J, Lukovich J V et al., 2015. Sea ice climatology in the Canadian Western Arctic: Thermodynamic versus dynamic controls. International Journal of Climatology, 35(8):1867-1880.

[7]
Carter N, Dawson J, Ogilvie A, 2017. Arctic Corridors and Northern Voices: Governing marine transportation in the Canadian Arctic (Cambridge Bay, Nunavut Community Report), Ottawa: University of Ottawa.

[8]
Chutko K J, Lamoureux S F, 2009. The influence of low-level thermal inversions on estimated melt-season characteristics in the central Canadian Arctic. International Journal of Climatology: A Journal of the Royal Meteorological Society, 29(2):259-268.

[9]
Dawson J, Mussells O, Copland L et al., 2017. Shipping trends in Nunavut 1990 to 2015. A Report Prepared for the Nunavut Central Monitoring Program. Ottawa, Canada and IqaluitNunavut.

[10]
Dawson J, Pizzolato L, Howell S E et al., 2018. Temporal and spatial patterns of ship traffic in the Canadian Arctic from 1990 to 2015. Arctic, 71(1):15-26.

[11]
Derksen C, Smith S L, Sharp M et al., 2012. Variability and change in the Canadian cryosphere. Climatic Change, 115(1):59-88.

[12]
Diro G T, Sushama L, 2019. Simulating Canadian Arctic climate at convection-permitting resolution. Atmosphere, 10(8):1-12.

DOI PMID

[13]
Environment and Climate Change Canada, 2019. Canadian sustainability indicators: Sea ice in Canada. Consulted on month day, year, www.canada.ca/en/environment-climate-change

[14]
Eguiluz V M, Gracia J F, Irigoien X et al., 2016. A quantitative assessment of Arctic shipping in 2010-2014. Scientific Reports, 6(30682):1-6.

[15]
Fetterer F, Knowles K, Meier W N et al., 2017. Updated daily Sea Ice Index, Version 3. [Indicate subset used]. Boulder, Colorado USA.NSIDC: National Snow and Ice Data Center. doi: https://doi.org/10.7265/N5K072F8.

[16]
Field A, 2005. Discovering Statistics Using SPSS. 2nd ed. London:SAGE Publication.

[17]
Gachon P, Dibike Y, 2007. Temperature change signals in northern Canada: convergence of statistical downscaling results using two driving GCMs. International Journal of Climatology, 27(12):1623-1641.

[18]
Gullett D, Skinner W, Vincent L A, 1992. Development of an historical Canadian climate database for temperature and other climate elements. Climatological Bulletin, 26(2):125-131.

[19]
Gullett D W, Vincent L A, Malone L H, 1991. Homogeneity testing of monthly temperature series: application of multiple-phase regression models with mathematical changepoints. National Hydrology Research Centre, Atmospheric Environment Service, Canadian Climate Centre, 47.

[20]
Gullett D W, Vincent L A, Sajecki P J F, 1990. Testing for homogeneity in temperature time series at Canadian climate stations. Atmospheric Environment Service,Canadian Climate Centre, 43.

[21]
Hanna E, Mernild S H, Cappelen J et al., 2012. Recent warming in Greenland in a long-term instrumental (1881-2012) climatic context: I. Evaluation of surface air temperature records. Environmental Research, 7(4):1-15.

[22]
Howell S E L, Wohlleben T, Komarov A et al., 2013. Recent extreme light sea ice years in the Canadian Arctic Archipelago: 2011 and 2012 eclipse 1998 and 2007. The Cryosphere: 7(6):1753-1768.

[23]
Howell S E L, Tivy A, Agnew T et al., 2010. Extreme low sea ice years in the Canadian Arctic Archipelago: 1998 versus 2007. Journal of Geophysical Research, 115(C10):1-16.

[24]
Howell S E, Tivy A, Yackel J J et al., 2008. Changing sea ice melt parameters in the Canadian Arctic Archipelago: Implications for the future presence of multiyear ice. Journal of Geophysical Research: Oceans, 113(C9):1-21.

[25]
Jackson J M, Carmack E C, McLaughlin F A et al., 2010. Identification, characterization, and change of the near surface temperature maximum in the Canada Basin, 1993-2008. Journal of Geophysical Research: Oceans, 115(5):1-16.

[26]
Juan X, 2004. A comparison of climate changes between Arctic and China in the last 600 years. Journal of Geographical Sciences, 14(3):289-295.

[27]
Maslanik J, Stroeve J, Fowler C et al., 2011. Distribution and trends in Arctic sea ice age through spring 2011. Geophysical Research Letters, 38(13):1-6.

[28]
McBean G, Alekseev G, Chen D et al., 2005. Arctic climate: Past and present. Arctic Climate Impacts Assessment (ACIA), International Scientific Symposium on Climate Change in the Arctic.

[29]
Messori G, Woods C, Caballero R, 2018. On the drivers of wintertime temperature extremes in the high Arctic. Journal of Climate, 31(4):1597-1618.

DOI

[30]
Mitchell J M, 1961. The measurement of secular temperature change in the eastern United States (No.43). US

[31]
Post E, Alley R B, Christensen T R et al., 2019. The polar regions in a 2℃ warmer world. Science Advances, 5(12):1-12.

[32]
Department of Commerce, Weather Bureau, Office of Climatology.

[33]
Mudryk L R, Derksen C, Howell S et al., 2018. Canadian snow and sea ice: Historical trends and projections. The Cryosphere, 12(4):1157-1176.

[34]
Okereke O E, 2011. Some consequences of adding a constant to at least one of the variables in the Simple Linear Regression Model. Asian Journal of Mathematics and Statistics, 4(4):181-185.

[35]
Pattyn F, Ritz C, Hanna E et al., 2018. The Greenland and Antarctic ice sheets under 1.5 C global warming. Nature Climate Change, 8(12):1053-1061.

[36]
Pizzolato L, Howell S E, Dawson J et al., 2016. The influence of declining sea ice on shipping activity in the Canadian Arctic. Geophysical Research Letters, 43(23):12-146.

[37]
Pizzolato L, Howell S E, Derksen C et al., 2014. Changing sea ice conditions and marine transportation activity in Canadian Arctic waters between 1990 and 2012. Climatic Change, 123(2):161-173.

[38]
Przybylak R, 2002. Changes in seasonal and annual high-frequency air temperature variability in the Arctic from 1951 to 1990. International Journal of Climatology, 22(9):1017-1032.

[39]
Przybylak R, Vizi Z, 2005. Air temperature changes in the Canadian Arctic from the early instrumental period to modern times. International Journal of Climatology, 25(11):1507-1522.

[40]
Przybylak R, Vízi Z, Wyszyński P, 2010. Air temperature changes in the Arctic from 1801 to 1920. International Journal of Climatology, 30(6):791-812.

[41]
Rapaić M, Brown R, Markovic M et al., 2015. An evaluation of temperature and precipitation surface-based and reanalysis datasets for the Canadian Arctic, 1950-2010. Atmosphere-Ocean, 53(3):283-303.

[42]
Schauer U, Fahrbach E, Osterhus S et al., 2004. Arctic warming through the Fram Strait: Oceanic heat transport from 3 years of measurements. Journal of Geophysical Research, 109(6):1-14.

[43]
Shimada K, Kamoshida T, Itoh M et al., 2006. Pacific Ocean inflow: Influence on catastrophic reduction of sea ice cover in the Arctic Ocean. Geophysical Research Letters, 33(8):1-4.

[44]
Slonosky V C, Graham E, 2005. Canadian pressure observations and circulation variability: Links to air temperature. International Journal of Climatology, 25(11):1473-1492.

DOI

[45]
Stroeve J C, Serreze M C, Holland M M et al., 2012. The Arctic’s rapidly shrinking sea ice cover: A research synthesis. Climatic change, 110(3/4):1005-1027.

[46]
Sou T, Flato G, 2009. Sea ice in the Canadian Arctic Archipelago: Modeling the past (1950-2004) and the future (2041-60). Journal of Climate, 22(8):2181-2198.

[47]
Tivy A, Howell S E L, Alt B et al., 2011. Trends and variability in summer sea ice cover in the Canadian Arctic based on the Canadian Ice Service Digital Archive, 1960-2008 and 1968-2008. Journal of Geophysical Research, 116(C3):C03007.

[48]
Van Wijngaarden W A, 2015a. Arctic temperature trends from the early nineteenth century to the present. Theoretical and Applied Climatology, 122(3/4):567-580.

[49]
Van Wijngaarden W A, 2015b. Temperature trends in the Canadian arctic during 1895-2014. Theoretical and Applied Climatology, 120(3/4):609-615.

[50]
Vincent L A, 1990. Time series analysis: Testing the homogeneity of monthly temperature series. Atmospheric Environment Service, Canadian Climate Centre and York University, 50.

[51]
Vincent L A, Gullett W D, 1999. Canadian historical and homogeneous temperature datasets for climate change analyses. International Journal of Climatology, 19(12):1375-1388.

[52]
Vincent L A, Wang X L, Milewska E J et al., 2012. A second generation of homogenized Canadian monthly surface air temperature for climate trend analysis. Journal of Geophysical Research: Atmospheres, 117(D18):1-13.

[53]
Vincent L A, Zhang X, Bonsal B R et al., 2002. Homogenization of daily temperatures over Canada. Journal of Climate, 15(11):1322-1334.

[54]
Vincent L A, Zhang X, Brown R D et al., 2015. Observed trends in Canada’s climate and influence of low-frequency variability modes. Journal of Climate, 28(11):4545-4560.

[55]
Vincent L A, Zhang X, Mekis E et al., 2018. Changes in Canada’s climate: Trends in indices based on daily temperature and precipitation data. Atmosphere-Ocean, 56(5):332-349.

[56]
Wan H, Zhang X, Zwiers F, 2019. Human influence on Canadian temperatures. Climate Dynamics, 52(1/2):479-494.

[57]
Way R G, Oliva F, Viau A E, 2017. Underestimated warming of northern Canada in the Berkeley Earth temperature product. International Journal of Climatology, 37(4):1746-1757.

[58]
Wilks D S, 2006. Statistical Methods in the Atmospheric Sciences. 2nd ed. Elsevier.

[59]
Wood K R, Overland J E, 2010. Early 20th century Arctic warming in retrospect. International Journal of Climatology, 30(9):1269-1279.

[60]
You Q, Fraedrich K, Ren G et al., 2013. Variability of temperature in the Tibetan Plateau based on homogenized surface stations and reanalysis data. International Journal of Climatology, 33(6):1337-1347.

[61]
Zhang X, Vincent L A, Hogg W D et al., 2000. Temperature and precipitation trends in Canada during the 20th century. Atmosphere-Ocean, 38(3):395-429.

Outlines

/