North-south vegetation transition in the eastern Qinling-Daba Mountains

  • ZHANG Xinghang , 1, 2 ,
  • ZHANG Baiping , 1, * ,
  • WANG Jing 1, 2 ,
  • YU Fuqin 1, 2 ,
  • ZHAO Chao 3 ,
  • YAO Yonghui 1
Expand
  • 1. State Key Laboratory of Resources and Environmental Information System, Institute of Geographic Sciences and Natural Resources Research, CAS, Beijing 100101, China
  • 2. University of Chinese Academy of Sciences, Beijing 100049, China
  • 3. Ministry of Civil Affairs of the People’s Republic of China, Beijing 100007, China
*Zhang Baiping (1963–), Professor, specialized in physical geography and applied GIS. E-mail:

Zhang Xinghang (1992–), PhD Candidate, specialized in mountain geography and ecological environment. E-mail:

Received date: 2020-10-15

  Accepted date: 2020-12-21

  Online published: 2021-05-25

Supported by

National Scientific and Technological Basic Resources Investigation Project(2017FY100900)

Copyright

Copyright reserved © 2021. Office of Journal of Geographical Sciences All articles published represent the opinions of the authors, and do not reflect the official policy of the Chinese Medical Association or the Editorial Board, unless this is clearly specified.

Abstract

The Qinling-Daba Mountains are the main body of China’s North-South Transitional Zone. Analysis of the north-south gradual variation of vegetation components is significant for understanding the structural diversity and complexity of this transitional zone. In this study, based on survey data of plant communities, the eastern Qinling-Daba Mountains is divided into four geographic units: the north flank of eastern Qinling Mts., south flank of eastern Qinling Mts., north flank of eastern Daba Mts. and south flank of eastern Daba Mts. We also explore division of regional climate according to areal differentiation of plant-species, community structure and species-richness, respectively. The results show that, (1) at plant-species level, there are mainly northern plants in north flank of eastern Qinling Mts. with evergreen species and fewer northern plants in south flank of eastern Qinling Mts.; there are mainly southern plants in eastern Daba Mts. (2) At community structure level, there are 4 formations (3 northern formations and 1 widespread formation) in north flank of eastern Qinling, 6 formations (3 northern formations, 1 southern formation, and 2 widespread formations) in south flank of eastern Qinling, 4 formations (2 southern formations and 2 widespread formations) in north flank of eastern Daba Mts., and 3 formations (3 southern formations) in south flank of eastern Daba Mts. In terms of the numbers and properties of formations, there is a mixture of northern and southern formations only in the south flank of eastern Qinling Mts. (3) At species-richness level, the diversity of families, genera and species decreased with increasing latitude, but the mixing of northern plants and the southern plants began to occur in south flank of eastern Qinling Mts. This means that the south flank of the eastern Qinling Mts. serves more suitably as the dividing line between China’s warm temperate and subtropical zones.

Cite this article

ZHANG Xinghang , ZHANG Baiping , WANG Jing , YU Fuqin , ZHAO Chao , YAO Yonghui . North-south vegetation transition in the eastern Qinling-Daba Mountains[J]. Journal of Geographical Sciences, 2021 , 31(3) : 350 -368 . DOI: 10.1007/s11442-021-1840-1

1 Introduction

The Qinling-Daba Mountains, as the main area of China's north-south transitional zone, are the natural north-south dividing line of China's geography and climate, with multidimensional zonal structures and a high degree of regional transitivity, environmental complexity, and biological diversity (Zhang, 2019). Vegetation, as a “mirror” reflecting the natural world, can play an irreplaceable role in measuring the environmental structure of mountains (Zhao, 1983; Zhang et al., 2009). Studying the plant populations, plant community dominance and biological diversity in the Qinling-Daba Mountains can deepen the understanding of variation in China's north-south vegetation transect series. In addition, it could help locate scientifically the specific but controversy position of China's north-south dividing line and even recognize the spatial pattern of biodiversity and ecological security in these critical areas (Zhao, 1983; Shen, 2010; Song, 2016).
The Qinling range, north of the Hanshui River (Figure 1), relatively high and immense, blocks warm and wet air flows from moving north in warm seasons and dry and cold air flows from moving south in cold seasons, leading to quite different climates on its two flanks. As a result, high-degree biological diversity and obvious transitional characteristics occur in this region (Zhu, 1958; Ying, 1994; Zhang, 2019). It has been generally recognized that the Qinling Mountains are the climatic division between the north and south of China and the northern boundary of evergreen broad-leaved forests in China; however, as for the specific location of the line or boundary, there are three opinions, namely, the main ridge, the northern piedmont and the southern piedmont of the Qinling Mountains. It has been even argued that the Daba Mountains, other than the Qinling Mountains, are more suitable as the climatic dividing line (Fang, 1991; Song, 1999; Zhao et al., 2019). The Qinling-Daba Mountains are a complete geographical and geomorphologic unit and we should consider all of them so as to attain a clear understanding of the transect series in the transitional zone and the specific location of the north-south dividing line.
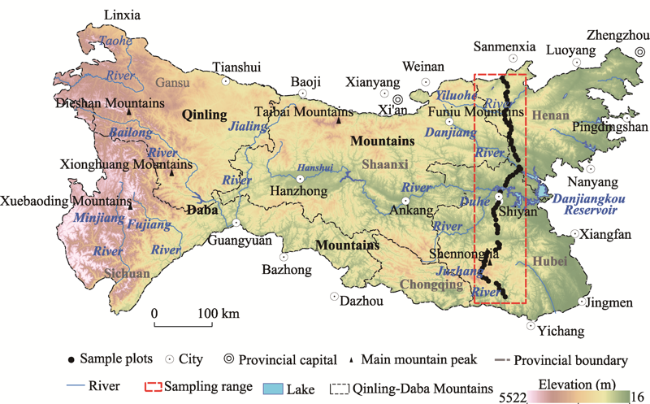
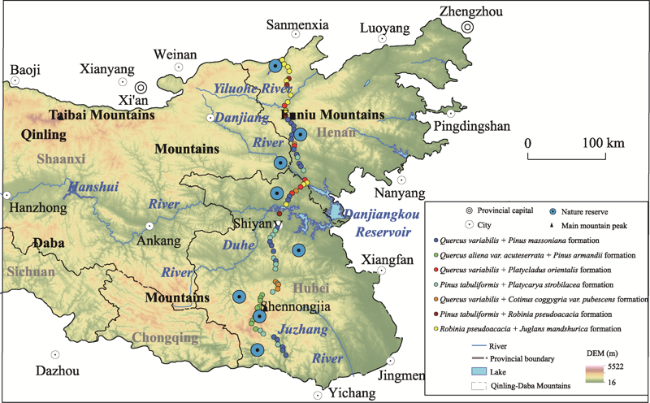
Figure 1 Sketch map of the Qinling-Daba Mountains and sampling sites
Continuous investigations and studies have been carried out from the eastern Daba Mountains (EBM) to the eastern Qinling Mountains (EQM) to explore the location of the north-south dividing line in the eastern Qinling-Daba Mountains (EQBM), including topography, climate, plant, and soil (Zhou and Liu, 1956; Yu, 1958; Zhang and Yuan, 1989; Fang, 2001; Huang, 2004; Kang and Zhu, 2007). These factors all take on complex transition in this critical transitional zone.
Considering that spatial variation in plant populations and species composition determines vegetation transect transition and the intrinsic nature of plant communities (Wang et al., 2001; Zhang, 2004; Song, 2016), north-south changes in plant species abundance and vegetation properties can quantitatively reflect the transitional pattern of plants along latitudinal gradients in the Qinling-Daba Mts. (Jiang et al., 1990; Zhang and Li, 1998; Shi et al., 2000; Zhang, 2004). In addition, plant species composition, mainly denoting dominant community components and species diversity (Li and Chen, 2011), also matters for understanding vegetation pattern in the north-south direction (Hugh, 1989; Wu and Cai, 2004). A dominant community component is generally expressed as the importance value of a species that is measured by the sum of its relative abundance, relative saliency and relative frequency (Zhou and Yu, 2008; Ma, 2009; Song, 2016). Species diversity is generally expressed by richness. North-south vegetation transect variation can be quantitatively reflected by latitudinal differentiation of population and species richness (Rohde, 1992; Kerkhoff et al., 2014; Weiser et al., 2018).
Many scholars have studied the vegetation transition characteristics in the EQBM but mainly in a small area. Ye et al. (1992) considered Jigong Mountain to be one of the natural northern-southern plant distribution boundaries based on flora distribution in southern Henan Province. However, this boundary has only been compared with the adjacent Shennongjia areas, and there is no additional regional vegetation transect series comparisons in the south-north direction. Yang et al. (2001) found that plant composition and forest vegetation types in Jiugong Mountains Nature Reserve had obvious zonal transition characteristics in terms of vegetation types and formations, but they did not involve the so-called north-south dividing line. Qin et al. (2011) used the relief method to investigate and analyze the flora and species diversity in the Funiu Mountains and found that the northern and southern plants obviously intersected and the highest plant diversity occurs in the eastern Qinling Mountains. However, this article did not describe the specific investigation method but simply summarized the data obtained from the investigation. Ye et al. (2002) and Hu et al. (2017) found that all plant elements were compatible and coexisted and that the floristic composition was rich in the Liankang Mountain, Henan Province, a natural transition from warm temperate zone to subtropical zone, but they did not address north-south vegetation transition sequences.
Remote sensing data have been used to classify vegetation types (Yao et al., 2020), quantitatively analyze mass elevation effect (Liu et al., 2020), and determine highly complex phenological phenomena in the Qinling-Daba Mountains (Li et al., 2020). It was concluded that there are abundant plant species in the study region thanks to northern-southern plant convergence and geographically transitional location (Wang, 1985; Cai, 1990; Song, 1994; Hu, 2004; Wang, 2004; Ding and Lu, 2006; Li, 2006). Although the distribution of plant communities in the EQBM has been determined to some extent, the research scope is only limited to small local areas, and continuous sampling is lacking along the whole north-south transect of the Qinling-Daba Mountains.
This study analyzes differentiation in species composition along the north-south transect of the EQBM by using a quantitative ecological method, and discusses the north-south vegetation transition series from three aspects, namely, the spatial distribution of plant population, community structure and species diversity. Based on this analysis, we also manage to identify the specific location of China's north-south dividing line and intend to promote progress in the theoretical study of physical geography in China.

2 Data and methods

2.1 Data

In this study, plant community data were obtained through a north-south transect survey. The transect was designed according to the basic principles of accessibility, strong plant representation and low human disturbance. (1) Accessibility was determined by the distance to the road; (2) representativeness was determined by the texture of remote sensing images and distance from the nature reserve; and (3) interference was determined by the terrain. According to the requirements of north-south continuous sampling, the preliminary design of the transect was determined, which represented the relatively complete zonal forest vegetation of the EQBM. The pre-investigation was carried out according to the preliminary transect design (May 2017), and adjustments were carried out according to the accessibility, representativeness and interference of the field pre-survey. In the field plant-community sampling survey, the following principles were used: “the species composition, community structure and habitat within the community are relatively uniform, the community area is sufficient to provide a buffer zone of 10-20 m around the sample plot. In addition to the community depending on the specific habitat, a relatively uniform slope on flat (platform) land or a gentle slope is generally selected to avoid slope crest, gully or complex terrain”. From south to north, samples were obtained in the following order: Badong County-Xingshan County-Shennongjia Forestry District-Fangxian County-Shiyan city-Xunxian County-Xichuan County-Xixia County-Lushi County-Lingbao city. From June to October of 2017, we conducted the field surveys to collect data.
The survey quadrat was established in the eastern Qinling-Daba Mountains (31°-34.5°N, 110.3°-111.3°E). This area has a typical forest community that is minimally affected by human activities (210-1840 m). The sampling interval was set at 5-8 km north-south intervals, and the sample area was 20 m × 20 m. There were 71 sample plots from which plant data was obtained and constituted the north-south transect along the EQBM (Figure 1). These data included all tree and shrub species with diameter at breast height (DBH) greater than 2 cm in the forest quadrat. Survey indicators included species, number of individuals, height, crown width, DBH, coverage, elevation, slope, aspect, and slope position. The dataset included 315 species, including 191 tree species. Topographic data were obtained from the USGS 1:250,000 digital elevation model (DEM).

2.2 Analysis methods

Principal component analysis (PCA) was used to analyze the variation in the plant species composition of the EQBM along a north-south transect. A group of correlated variables were transformed into several uncorrelated variables by dimension reduction technology. After the transformation, several main variables were used as the main components. PCA is a statistical method to separate the correlation among multidimensional variables and uses several main components to determine the influence of multidimensional variables on the target. In the case that substantial original variable information is retained, the data dimension is compressed, and the amount of data is reduced.
This paper used the dissimilarity coefficient method to discuss the spatial variability in the species between the north and south sample points in the eastern Qinling-Daba Mountains and to divide the community structure. In terms of species data analysis, common coefficients include Bray-Curtis, chord and Hellinger. These coefficients consider not only the presence or absence of species in a sample but also the relative abundance of different species. The chord distance refers to the Euclidean distance of the sample square pair calculated after standardizing the norm of the sample direction (the sum of squares is 1). The Hellinger distance is the Euclidean distance calculated by dividing the multiplicity value by the sum of the multiplicity of the sample and then taking the square root. The Bray-Curtis dissimilarity matrix (Equation 1) can be directly calculated from original data based on the absolute quantity difference in multiple degrees, and this matrix is widely used in practice. Therefore, the Bray-Curtis dissimilarity matrix method was selected to calculate the dissimilarity coefficient in this paper.
$d(i,j)=\frac{\mathop{\sum }_{i=1}^{k}|{{y}_{i,k}}-{{y}_{j,k}}|}{\mathop{\sum }_{i=1}^{k}({{y}_{i,k}}+{{y}_{j,k}})}$
where d(i, j) is the coefficient of the species difference between sample i and sample j, k is the number of species (the number of species in the sample plot species matrix), y is the number of species, and i and j are the numbers of the two samples compared.
Ward's minimum variance clustering method mainly includes the following: 1) select the dissimilarity index and calculate the dissimilarity between different squares (in this study, the Bray-Curtis dissimilarity coefficient was used to evaluate the dissimilarity between samples), 2) combine the quadrats with the least difference into a new quadrat group, 3) calculate the difference in the new quadrats, and 4) repeat steps 2) and 3) until all quadrats are clustered into one group.
The importance value is an important quantitative index of a community and is often used to compare the importance of a species among different communities in a community. The importance value is calculated by a direct measurement index, not a direct measurement. The general calculation equation (Song, 2016) (Equation 5) is expressed by the sum of relative abundance (Equation 2), relative frequency (Equation 3) and relative advantage (Equation 4). However, in forest communities, the relative dominance of the tree layer (relative chest height sectional area) is often used to express the importance value (Fang, 2009) (Equation 6). Therefore, the relative breast height sectional area of tree species was used to represent the importance value.
Relative abundance (Dr)= $\frac{D\left( \text{the number of individuals in a species} \right)}{\mathop{\sum }^{D}\left( \text{the number of individuals in all species} \right)}*100(\%)$
Relative frequency (Pr)=$\frac{P\left( \text{frequency of a species} \right)}{\mathop{\sum }^{P}\left( \text{frequency of all species} \right)}*100(\%)$
Relative advantage (Fr)=$\frac{F\left( \text{the DBH sectional area of a species} \right)}{\mathop{\sum }^{F}\left( \text{the DBH sectional area of all species} \right)}*100(\%)$
Importance value (Iv1)=(Dr+ Pr + Fr)/3
Importance value (Iv2)=Fr
Thus, according to the plant species composition, community structure and species diversity the following steps were conducted: 1) systematically display the change sequence of the vegetation in the north-south direction in the EQBM to determine the transition, complexity and diversity of the vegetation distribution in the EQBM and 2) provide new evidence for China's north-south climate dividing line.

3 Results

3.1 Variation in the common tree species in the north-south transect series

In this paper, we used the data from 71 quadrats to filter the tree species. According to the abundance index of tree species in a quadrat (the number of trees that appeared ≥ 8), the principal component method was used to rank the common tree plants, and the first two principal components had the largest amount of information. The first (I) and second (II) components accounted for 35.66% and 23.84% of the total information, respectively, and represented the regional differentiation characteristics of the plant populations. Therefore, the first and second principal components constituted the ranking plan (Figure 2).
Figure 2 Sequence of plant species along the north-south transect in the eastern Qinling-Daba Mountains
To more clearly show the spatial distribution of the three groups of plant species on the ordination map (Figure 2), bubble maps were made for the tree species in groups 1 and 2 and common tree species abundance in group 3 in the north-south direction, as shown in Figures 3a, 3b and 3c.
Different groups of plants are bounded generally by the south flank of the eastern Qinling Mountains (EQMS) in the ordination plot (Figure 3), which shows different spatial distributions. Statistical analysis of each group of plant properties (Table 1) shows the following:
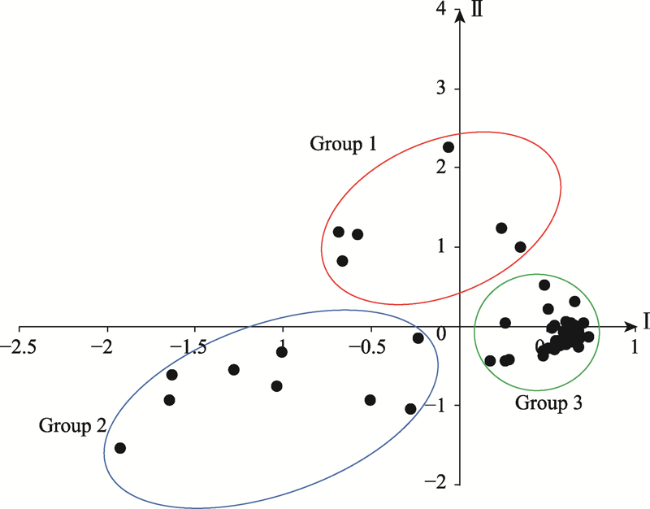
Table 1 Composition of plant properties based on the sorting results
Type Feature
Group Transitional species Widespread
species
Concentrated
distribution section
Northern plant type Southern plant type
Tree plants 1 83% 17% 0 Northern section
2 0 78% 22% Southern section
3 13% 0 87% Northern and southern sections
The plants in group 1 are mainly distributed to the north of the EQMS (north of 32.5°-33.0°N) (Figure 3a), in an area with strong drought conditions (Table 1), and this group is referred to as the northern group of plants and includes plants such as Platycladus orientalis.
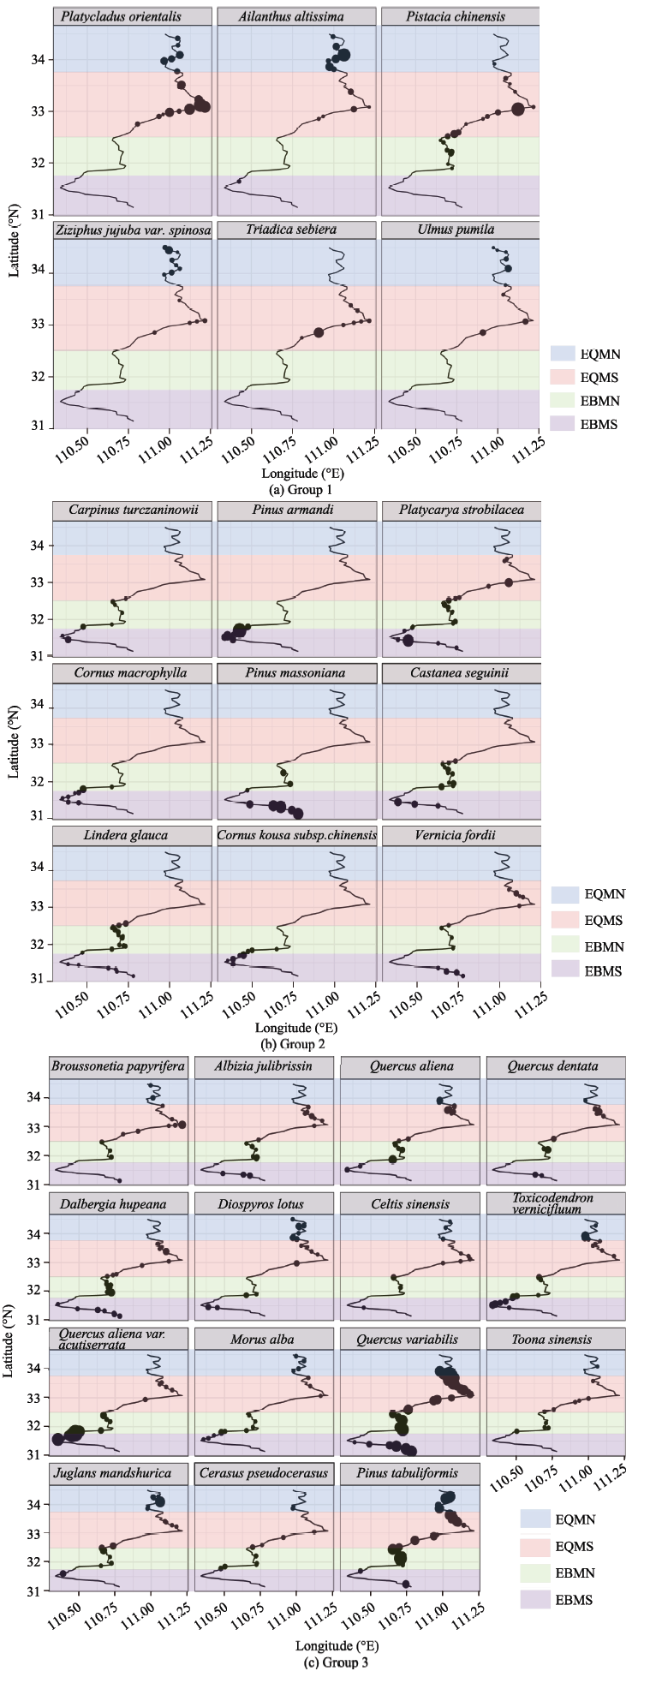
Figure 3 Bubble maps showing species abundance in the north-south direction. The bubble size is proportional to the current species abundance.
The plants in group 2 are mainly distributed to the south of the EQMS (south of 32.5°-33.0°N) (Figure 3b). The climate in the area of group 2 is damp and hot (Table 1). This group is referred to as the southern group of plants and includes plants such as Pinus massoniana.
The plants in group 3 are distributed in the north and south of the EQBM (Figure 3c). This group is referred to as widespread species and includes plants that have strong adaptability to the local eco-environment.
According to the statistics of the number of tree species in the north and south in Figure 2, there were 25 tree species in the northern part of the EQBM, of which 4 species only appeared in the north and 21 species appeared sporadically in the south (Table 2). There were 28 tree species in the southern part of the EQBM, of which 10 species were only found in the south and 18 species sporadically occurred in the north. According to the percentage calculation (Table 2), 84% of the plants in the northern part of the EQBM were also found in the southern part. Only 64% of the plants in the southern part were also found in the northern part. This result may be because plants more favorably move from a cold region (north) to a humid temperate region (south). However, the hot and humid plants in the south (such as Lindera glauca, Platycarya strobilacea, and Pinus massoniana) cannot cross to the north flank.
Table 2 Distribution proportion of plant species in the north and south of the transect
Species in the north (25 species) Species in the south (28 species)
Species found only
in the north
Species found and distributed only in the south Species found only in
the south
Species found and
distributed only in the north
4 21 10 18
16% 84% 26% 64%

3.2 Variation in common tree communities in the north-south transect series

3.2.1 Tree community types in the north-south transect
According to the Chinese vegetation classification system, the classification units of plant communities are generally clumps, formations and vegetation types (Wang, 1987). The communities with the same lamellar structure and dominant species are merged into clusters. Plant communities with the same dominant species are merged into formations (Zhang et al., 1983). According to this classification system, the tree communities in the north-south transect of the EQBM were analyzed by the Ward minimum variance clustering method. The clustering results were obtained by programming in R language (R Development Core Team, 2017) (Figure 4). When the Euclidean distance d = 1.5, the tree plant communities in the north-south transect of the EQBM were divided into 7 formations; when the Euclidean distance d = 1, they were divided into 16 communities.
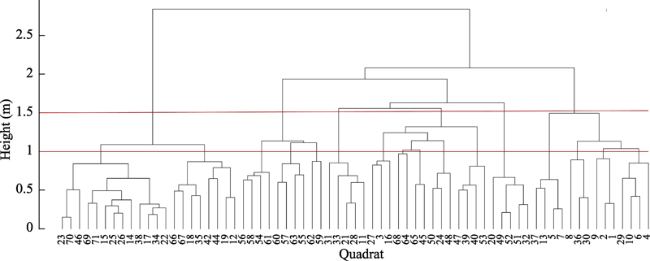
Figure 4 Ward cluster map of tree flora in the north-south transect in the eastern Qinling-Daba Mountains
As a comprehensive index, the importance value can measure the relative importance of plant species in a community. The dominant species were obtained by calculating the importance value of each group. The seven formations were named according to the dominant species.
(1) Quercus variabilis + Pinus massoniana formation {23, 70, 46, 69, 71, 15, 25, 26, 14, 38, 17, 34, 22, 66, 67, 18, 35, 42, 44, and 19} (Note: the numbers in brackets are quadrat numbers, the same as the below)
(2) Quercus aliena var. acuteserrata + Pinus armandii formation {56, 58, 54, 61, 60, 57, 63, 55, 62, and 59}
(3) Quercus variabilis + Platycladus orientalis formation {31, 33, 21, 28, and 11}
(4) Pinus tabuliformis + Platycarya strobilacea formation {27, 16, 68, 64, 65, 45, 50, 24, 48, 47, 39, 40, and 53}
(5) Quercus variabilis + Cotinus coggygria var. pubescens formation {20, 49, 52, 51, and 32}
(6) Pinus tabuliformis + Robinia pseudoacacia formation {37, 13, 5, and 7}
(7) Robinia pseudoacacia + Juglans mandshurica formation {8, 36, 30, 9, 2, 1, 29, 10, 6, 4, 3, and 12}
The 16 associations are as follows:
(1) Quercus variabilis + Pinus massoniana + Pinus tabuliformis {23, 70, 46, 69, 71, 15, 25, 26, 14, 38, 17, 34, and 22}
(2) Quercus variabilis + Pinus massoniana {66, 67, 18, 35, 42, 44, 19, and 12}
(3) Quercus aliena var. acutiserrata + Pinus armandii {56, 58, 54, and 61}
(4) Quercus aliena var. acutiserrata + Pinus armandii + Cornus kousa subsp. chinensis {60, 57, 63, and 55}
(5) Fagus engleriana + Malus hupehensis {62, and 59}
(6) Quercus variabilis + Platycladus orientalis + Pistacia chinensis {31, 33, 21, 28, and 11}
(7) Platycladus orientalis + Cotinus coggygria var. pubescens {27, 3, and 16}
(8) Platycarya strobilacea + Cyclobalanopsis glauca {68, and 64}
(9) Quercus serrata var. brevipetiolata + Cunninghamia lanceolata {65, and 45}
(10) Pinus tabuliformis + Dalbergia hupeana {50, 24 and 48}
(11) Quercus aliena + Lindera glauca {47, 39, 40, and 53}
(12) Quercus variabilis + Cotinus coggygria var. pubescens {20, 49, 52, 51, and 32}
(13) Pinus tabuliformis + Robinia pseudoacacia {37, 13, 5, and 7}
(14) Koelreuteria paniculata + Robinia pseudoacacia {8, 36, and 30}
(15) Juglans mandshurica + Ailanthus altissima {9, 2, and 1}
(16) Robinia pseudoacacia + Platycladus orientalis + Broussonetia papyrifera {29, 10, 6, and 4}
3.2.2 Characteristics of tree communities in the north-south transect
The spatial distribution results of the 7 formations along the north-south transect of the EQBM are shown in Figure 5. The main formations in the survey area were the Quercus variabilis + Pinus massoniana formation, Quercus aliena var. acuteserrata + Pinus armandii formation and Robinia pseudoacacia + Juglans mandshurica formation. The Quercus variabilis + Pinus massoniana formation was the northernmost formation distributed in Funiu Mountains, the investigated community in the northern part of the Funiu Mountains was mainly the Robinia pseudoacacia + Juglans mandshurica formation, and the Quercus aliena var. acuteserrata + Pinus armandii formation was only distributed in the southern part of the north-south transect.
Figure 5 Spatial distribution of plant formations along the north-south transect of the eastern Qinling-Daba Mountains
The specific distribution characteristics of each formation are as follows:
Quercus variabilis + Pinus massoniana formation: this formation is the northernmost formation in the Funiu Mountains, with rich species diversity (74 tree species), and the dominant species are Quercus variabilis and Pinus massoniana. The dominant species are Quercus variabilis in the EQM, but Pinus massoniana in the EBM. The formation is represented as Quercus variabilis + Pinus massoniana in the EQM and as Pinus massoniana + Quercus variabilis in the EBM.
Quercus aliena var. acuteserrata + Pinus armandii formation: the formation is only centrally distributed in the southern part of the north-south transect (31.3°-31.5°N), namely, the south flank of the eastern Daba Mountains (EBMS), with rich species diversity (92 tree species).
Quercus variabilis + Platycladus orientalis formation: the formation is distributed sporadically only in the northern part of the transect, namely, the EQM.
Pinus tabuliformis + Platycarya strobilacea formation: the formation is distributed in the south flank of the EQMS and EBM.
Quercus variabilis + Cotinus coggygria var. pubescens formation: the formation is distributed in the northern Quercus acuteserrata + Pinus armandii formation, mainly in the EQMS and the north flank of the eastern Daba Mountains (EBMN).
Pinus tabuliformis + Robinia pseudoacacia formation: the formation is mainly distributed in the EQM, with simple tree species.
Robinia pseudoacacia + Juglans mandshurica formation: the formation is mainly distributed in the north flank of the eastern Qinling Mountains (EQMN) relatively concentrated, with rich species diversity (34 tree species).

3.3 Variation in tree species diversity along the north-south transect

This study selected species richness to quantify plant species diversity, and richness variation characteristics in the north-south transect were analyzed. Species richness is the number of species in each quadrat. The more species there are, the more richness there is. Analyzing the changes in the families, genera and species of tree plants in the south-north transect showed that their taxa have similar variation characteristics (Figure 6). Xingshan County (south of 31.5°N) has sufficient heat, but its species diversity is obviously low. Due to the low altitude there, this area may be affected by human disturbance. Northward to the Shennongjia Forestry District, the altitude increased, the climate became wet, and the diversity increased significantly. Northern Shennongjia (approximately 1800 m above sea level, 31.5°-32.0°N) reached a diversity peak rapidly. Then, with decreasing altitude, the transect entered Fangxian County (32.0°N), and the diversity decreased sharply toward the valley bottom. However, from the north of Fangxian County (near 32.3°N) to the north, there was another pattern of species diversity with it increasing and decreasing until the EQBM boundary (near 32.8°N). Farther north, namely, the EQM, the diversity decreased gently and a peak appeared in the Funiu Mountains (near 34.0°N), with the highest value of the EQM species diversity. Figure 6 shows that the diversity of the EQM families, genera and species was lower than that of the EBM and maintained a relatively stable trend.
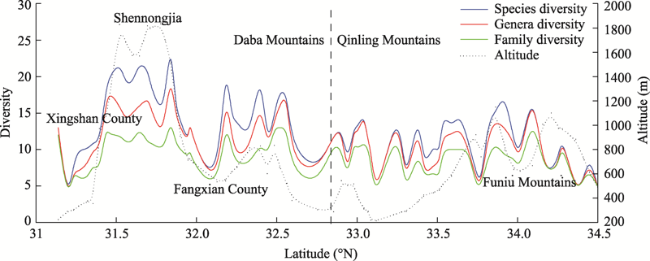
Figure 6 Latitudinal gradient changes in species richness along the north-south transect in the eastern Qinling-Daba Mountains

4 Discussion and conclusions

4.1 Discussion

4.1.1 Regional distribution of common tree species and species diversity
The common tree populations and species diversity in the north-south transect of the EQBM had north-south differentiation characteristics, reflecting the complex eco-environmental conditions in this area.
According to the north-south variation in the common tree populations, plants in the northern part of the EQBM are strongly drought resistant and mainly affected by dry and cold air flow. Toward the south, which is less affected by dry and cold air flow, the eco-environment is relatively warm and humid, and the plant population is more complex and diverse than that in the north. In the southernmost section, dry and cold air does not occur, the subtropical climate is remarkable, the climate is suitable, and the plant population is the most abundant (Gentry, 1988).
According to the sequence of tree species diversity from north to south, species richness decreases with increasing altitude and in the northward direction. The highest species diversity is approximately 1800 m in the EBM, and the lowest species diversity in the EQM is 200-400 m.
4.1.2 Spatial distribution characteristics of tree communities
The tree communities in the north-south transect of the EQBM are divided into 7 formations, of which the Quercus variabilis + Pinus massoniana formation, Pinus tabuliformis + Platycarya strobilacea formation, Pinus tabuliformis + Robinia pseudoacacia formation and Quercus variabilis + Platycladus orientalis formation are the four main community types; while the Quercus variabilis + Cotinus coggygria var. pubescens formation, Robinia pseudoacacia + Juglans mandshurica formation and Quercus aliena var. acuteserrata + Pinus armandii formation are only distributed in local areas. The clustering results mainly reflect the similarity in the ecological environments of the communities, and the communities with the greatest habitat similarity merged first. The Pinus tabuliformis + Platycarya strobilacea formation is distributed in the central and southern part of the north-south transect, which contains southern plants that prefer hot and humid conditions. The Quercus variabilis + Platycladus orientalis formation is distributed sporadically along the north-south transect, mainly in the northern part of the transect, which contains northern arid plants. The Quercus variabilis + Pinus massoniana formation has a wide distribution, and its species are complex and diverse, and this formation is the final combination in the cluster, indicating that the eco-environment of this formation is significantly different from that of the other formations.
Based on the tree community structure of the north-south transect, it is clear that the tree plant communities, such as the Quercus variabilis + Platycladus orientalis formation and other scattered small communities, in this area have been greatly damaged from human activities, and this damage may be related to habitat fragmentation caused by these human activities.
4.1.3 North-south dividing line in the eastern Qinling-Daba Mountains
The results of this study indicate that the EQMS is more likely the north-south dividing line of the EQBM. First, according to the variation in the common tree populations in the north-south transects, the EQMN and EQMS are dominated by northern xerophytes, but the EQMS contains southern evergreen trees and is also most obvious mixing zone of southern and northern plants. The EBMN and EBMS are dominated by southern plants that prefer humid conditions, and there are almost no northern xerophytes. This indicates that the EQMS is more suitable for use as the EQBM climate north-south dividing line.
Second, according to the change sequence of the tree community types in the north-south transect, there are 4 formations (3 northern formations and 1 widespread formation) in the EQMN: Quercus variabilis + Pinus massoniana formation, Robinia pseudoacacia + Juglans mandshurica formation, Quercus variabilis + Platycladus orientalis formation, and Pinus tabuliformis + Robinia pseudoacacia formation, which are mainly northern plants. There are 6 formations (3 northern formations, 1 southern formation, and 2 widespread formations) in the EQMS: Quercus variabilis + Platycladus orientalis formation, Robinia pseudoacacia + Juglans mandshurica formation, Quercus variabilis + Cotinus coggygria var. pubescens formation, Pinus tabuliformis + Robinia pseudoacacia formation, Quercus variabilis + Pinus massoniana formation, and Pinus tabuliformis + Platycarya strobilacea formation. Some of the formations are consistent with those in the EQMN, and the others occur to the south, which means that the transition from north to south begins. There are 4 formations (2 southern formations and 2 widespread formation) in the EBMN: Quercus variabilis + Cotinus coggygria var. pubescens formation, Pinus tabuliformis + Robinia pseudoacacia formation, Quercus variabilis + Pinus massoniana formation, and Pinus tabuliformis + Platycarya strobilacea formation, which are consistent with the formation of southern plants in the EQMS. There are 3 formations (3 southern formations) in the EBMS: Pinus tabuliformis + Platycarya strobilacea formation, Quercus variabilis + Pinus massoniana formation, and Quercus aliena var. acuteserrata + Pinus armandii formation. The first two formations are consistent with those in the EBMN formation, while the Quercus aliena var. acuteserrata + Pinus armandii formation only exists in the EBMS. There is a mixture of northern and southern formations in the EQMS. In terms of the numbers and properties of the formations, the EQMS is considered the EQBM's climate north-south dividing line.
Furthermore, the diversity of the families, genera and species in the EQM is relatively stable, and the diversity in the EBM is higher than that in the EQM. These results further confirmed that the climate conditions in the EBM are more suitable for more plant survival than those in the EQM (which can be cross verified with the results in Section 3.1), making it feasible to use the location of the first appearance of southern plants, namely, the emergence of evergreen trees (Lei, 1999) rather than the location of the disappearance of northern plants. To more directly reflect the location of the north-south dividing line of climate in the EQBM, the plants in the quadrats were divided into two types: southern species and northern species. The proportions of the southern species and the northern species in each quadrat were calculated, as shown in Figure 7. As seen from Figure 7, the proportion of species in the north is the highest in the EQMN, gradually decreasing from the south to the EQMS and gradually disappearing in the EBM area. However, the proportion of species in the south is the highest in the EBMS, slightly decreasing in the EBMN to the north, decreasing to zero in the EQMS northward, and disappearing in the EQMN. The north-south mixed plants of the EQMS are the most obvious, and of the areas, the EQMS is more suitable as the EQBM's climate north-south dividing line.
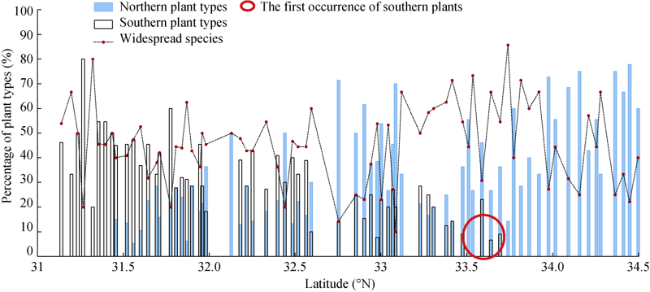
Figure 7 Latitudinal gradient changes in the species richness of different plant types along the north-south transect of the eastern Qinling-Daba Mountains
Finally, according to the field survey data from the two regions (Baotianman and Shennongjia) with the highest species richness in the transect and the data from the 8 nature reserves (Xiaoqinling in the EQMN; the Xinkailing and Hualongshan nature reserves in the EQMS; the Wudaoxia and Shibalichangxia nature reserves in the EBMN; and the Wulipo nature reserve in the EBMS) (as shown in Figure 5), the average annual rainfall from the EQMN to the EQMS is approximately 800 mm, which is higher than that in the north where the water requirements of plants are similar.
From the EQMS to the EBMS, the average annual precipitation is more than 1100 mm, which meets the water demand of the plants in southern China.
Therefore, it is reasonable to regard the EQMS as the EQBM climate north-south dividing line according to dry and wet conditions.
The boundary between climate type and mountain base vegetation type is in the EQMS, as shown in Table 3. From the EQMN to the EQMS, the climate type changes from warm temperate monsoon to subtropical warm temperate monsoon climate, and the mountain-base vegetation type changes from deciduous broad-leaved forest to evergreen deciduous broad-leaved mixed forest.
This result also indicates that EQMS is more suitable as the EQBM's climate north-south dividing line.
Table 3 Basic data of some nature reserves along the north-south transect in the eastern Qinling-Daba Mountains
Natural
Reserve
Position Latitude (N) Longitude (E) Annual precipitation (mm) Climate type Belt types of mountain
vegetation
Xiaoqinling EQMN 34°27′ 110°33′ 719.2 Temperate and monsoonal climate Low-mountain shrub meadow crop belt, deciduous oak forest belt
Baotianman 33°30′ 111°48′ 885.6 Temperate and monsoonal climate Deciduous oak forest belt
Xinkailing EQMS 33°16′ 110°38′ 803 Subtropical and warm temperate monsoon climate Evergreen and deciduous broad-leaved forest
Hualongshan 33°07′ 109°20′ 1015 Humid mountain climate
in subtropical warm
temperate zone
Broad-leaved evergreen forests
Wudaoxia EBMN 32°05′ 111°07′ 1100 North subtropical monsoon climate Evergreen broad-leaved forest and deciduous broad-leaved mixed forest
Shibalichangxia 31°31′ 109°50′ 1250 North subtropical humid monsoon climate Evergreen deciduous broad-leaved mixed forest
Shennongjia EBMS 31°36′ 110°27′ 1200 North subtropical monsoon climate Broad-leaved evergreen forests
Wulipo 31°22′ 110°3′ 1400 Warm and moist monsoon climate in the middle
subtropics
Evergreen broad-leaved forest and evergreen coniferous forest belt
At present, the location of the north-south boundary has mainly been studied in terms of vegetation at the macroscale (such as vegetation type and NDVI). Based on the survey data of the continuous plant community transect from south to north in the EQBM, by combining qualitative and quantitative analysis, we can determine the variation in the transitional zone from small-scale vegetation (plant species and community), which can provide new ideas for scientific research on the north-south climate dividing line. Field sampling ensures the data are more accurate. The qualitative method involved dividing the plants into southern and northern plants and using the mixed occurrence of northern-southern plants to illustrate the EQBM's climate north-south dividing line. The quantitative method involved quantifying the sampled plant community data, such as the abundance of common plant populations, the number of formations and species richness.
This paper considers that the EQMS is more suitable as the EQBM's north-south climate dividing line. This conclusion is the same as that by Zhang and Zhang (1979) and Kang et al. (2007). However, it is different from that by Zhao et al. (2019), and the main reasons for the difference are as follows: first, the studies are at different scales. This paper focuses on the plant-community and population scales (evergreen tree), but the others focus on the vegetation-type scale (evergreen broad-leaved forest); second, the studies have different research angles. This paper focuses on the horizontal sequence change, while the other studies focus on the vertical vegetation change law; the final difference is that the studies have different data distributions. This paper uses continuous horizontal transect survey data and discrete mountain vertical belt spectral data. At present, we are collecting data on families, genera and species of plants in the Qinling-Daba Mountain nature reserves, namely, flora data. In the future, we will study the vertical response and quantification of north-south flora in the Qinling-Daba Mountains (especially under the background of climate change) and comprehensively analyze the spatio-temporal characteristics of climate, topography and soil in the Qinling-Daba Mountains.

4.2 Conclusions

Based on the survey data of plant communities, this paper analyzes the variation in plant population, community structure and species diversity along the north-south transect in the eastern Qinling-Daba Mountains, and the results are as follows:
(1) Plant population has the transitional characteristics from north to south in the EQBM. Northern plants are drought-resistant; while southern plants are heat-resistant. Evergreen tree species appear in the EQMS.
(2) We used Ward's minimum variance method to cluster the tree communities in the north-south transect of the EQBM into 7 formations and 16 associations. There are 4 formations (3 northern formations and 1 widespread formation) in the EQMN, 6 formations (3 northern formations, 1 southern formation, and 2 widespread formations) in the EQMS, 4 formations (2 southern formations and 2 widespread formations) in the EBMN, and 3 formations (3 southern formations) in the EBMS. There is a mixture of northern and southern formations only in the EQMS.
(3) The diversity of plant families, genera and species decreases with increasing latitude, and the diversity of the EQM families, genera and species is lower than that of the EBM; however, the mixing of northern and southern plants has started to occur in the EQMS.
This study on the variation of vegetation in the transitional zone increases the scientific validity of China's north-south climate dividing line, indicating that in comparison to other parts, the EQMS is more suitable as the north-south dividing line of the EQBM. The results can provide a basic reference for vegetation protection, planning and management and even for the establishment of rational national protected area systems in the EQBM.
[1]
Cai H J, 1990. Study on the floristic spermatophyte of Xiaoqinling Natural Reserve in Henan. Journal of Henan Agricultural University, (2):261-268. (in Chinese)

[2]
Ding S Y, Lu X L, 2006. Comparison of plant flora of Funiu Mountain and Jigong Mountain Natural Reserves. Geographical Research, 25(1):62-70. (in Chinese)

[3]
Fang J Y, 1991. Eco-climatological analysis of the forest zones in China. Acta Ecologica Sinica, 11(4):377-387. (in Chinese)

[4]
Fang J Y, 2001. Re-discussion about the forest vegetation zonation in eastern China. Chinese Bulletin of Botany, 43(5):522-533. (in Chinese)

[5]
Fang J Y, Wang X P, Shen Z H et al., 2009. Methods and protocols for plant community inventory. Biodiversity Science, 17(6):533-548. (in Chinese)

[6]
Gentry A H, 1988. Changes in plant community diversity and floristic composition on environmental and geographical gradients. Annals of the Missouri Botanical Garden, 75(1):1-34.

DOI

[7]
Shen Z H, Hu H F, Zhou Y et al., 2004. Altitudinal patterns of plant species diversity on the southern slope of Mt. Shennongjia, Hubei, China. Biodiversity Science, 12(1):99-107. (in Chinese)

[8]
Hu X Y, Yang H, Li N, et al., 2017. Research on the plant diversity and its conversation in Henan Liankang Mountain National Nature Reserve. Modern Horticulture, (4):133-134. (in Chinese)

[9]
Huang B W, 2004. Modern Physical Geography. Beijing: Science Press. (in Chinese)

[10]
Gauch H G, 1989. Yang C, Yang Z Z trans. Multivariate Analysis in Community Ecology. Beijing: Science Press. (in Chinese)

[11]
Jiang Y, Tian L S, Lei M, et al., 1990. Analysis of the regional differences of floristic composition and the nature of vegetation in the lower zone on the eastern slope of the Helan Mountain range. Acta Phytoecologica et Geobotanica Sinica, 14(1):46-54. (in Chinese)

[12]
Kang M Y, Zhu Y, 2007. Discussion and analysis on the geo-ecological boundary in Qinling range. Acta Ecologica Sinica, 27(7):2774-2784. (in Chinese)

[13]
Kerkhoff A J, Moriarty P E, Weiser M D, 2014. The latitudinal species richness gradient in New World woody angiosperms is consistent with the tropical conservatism hypothesis. Proceedings of the National Academy of Sciences, 111(22):8125-8130.

[14]
Lei M, 1999. Vegetation of Shaanxi. Beijing: Science Press. (in Chinese)

[15]
Li C N, 2006. Biodiversity and protection of biodiversity in Niubeiliang National Nature Reserve in Shaanxi Province [D]. Xianyang: Northwest A&F University, (in Chinese)

[16]
Li J Y, Feng X, Yin J B, et al., 2020. Change analysis of spring vegetation green-up date in Qinba Mountains under the support of spatiotemporal data cube. Journal of Sensors, (2):1-12.

[17]
Li Z J, Chen S B, 2011. Community Ecology. Beijing: China Meteorological Press. (in Chinese)

[18]
Liu J J, Pan Z W, Qin F et al., 2020. Estimation of air temperature based on MODIS and analysis of mass elevation effect in the Qinling-Daba Mountains. Geographical Research, 39(3):735-748. (in Chinese)

[19]
Ma D W, 2009. Experimental and Practice Course Phytogeography. Beijing: Science Press. (in Chinese)

[20]
Qin Y F, 2011. The plant communities’ vertical distribution and the species’ diversity in Funiu Mountain Nature Reserve. Chinese Horticulture Abstracts, 27(1):186-187. (in Chinese)

[21]
R Development Core Team, 2017. R: A Language and Environment for Statistical Computing. Vienna: R Foundation for Statistical Computing.

[22]
Rohde K, 1992. Latitudinal gradients in species diversity: The search for the primary cause. Oikos, 65(3):514-527.

[23]
Shen M C, 2010. Biodiversity Research and Conservation on Qinling Mountains in China. Beijing: Science Press. (in Chinese)

[24]
Shi P L, Li W H, Wang J X, et al., 2000. Species-abundance relation of herb communities in subalpine timber-line ecotone of Wolong Natural Reserve, Sichuan province, China. Acta Ecologica Sinica, 20(3):384-389. (in Chinese)

[25]
Song C S, 1994. Scientific Survey of the Jigong Mountain National Nature Reserve, Beijing: China Forestry Publishing House. (in Chinese)

[26]
Song Y C, 1999. Perspective of the vegetation zonation of forest region in eastern China. Acta Botanica Sinica, 41(5):541-552. (in Chinese)

[27]
Song Y C, 2016. Vegetation Ecology. 2nd ed. Beijing: Higher Education Press. (in Chinese)

[28]
Wang B S, 1987. hytocoenology. Beijing: Higher Education Press. (in Chinese)

[29]
Wang D B, Ji S Y, Chen F P, 2001. A review on the species diversity of plant community. Chinese Journal of Ecology, 20(4):55-60. (in Chinese)

[30]
Wang J, 1985. A preliminary study on the flora of the spermatophyta in the Dabie Mountain in Henan. Acta Agriculturae Universitatis Henanensis, (3):117-131. (in Chinese)

[31]
Wang L S, 2004. Study on plant resource of nature preserve in Funiu Mountain of Henan Province Ⅱ. Shaanxi Forestry Science and Technology, (3):10-13. (in Chinese)

[32]
Weiser M D, Swenson N G, Enquist B J, et al., 2018. Taxonomic decomposition of the latitudinal gradient in species diversity of North American floras. Journal of Biogeography, 45(2):418-428.

[33]
Wu G H, Cai Y L, 2004. Integrated Physical Geography. 2nd ed. Beijing: Higher Education Press. (in Chinese)

[34]
Yang C F, Sun S G, Liu X, et al., 2001. A preliminary study on the vegetation of Jiugong Mountain Nature Reserve and its characteristics. Journal of Wuhan Botanical Research, 19(6):475-482. (in Chinese)

[35]
Yao Y H, Suonan D Z, Zhang J Y, 2020. Compilation of 1:50,000 vegetation type map with remote sensing images based on mountain altitudinal belts of Taibai Mountain in the North-South transitional zone of China. Journal of Geographical Sciences, 30(2):267-280.

[36]
Ye Y Z, Qu W Y, Huang Y C, 2002. Scientific Survey of the Liankang Mountain National Nature Reserve. Beijing: Science Press. (in Chinese)

[37]
Ye Y Z, Wang S Y, Li P X, 1992. A study on the spermatophyta flora in the Jigong Mountain natural sanctuary in south Henan. Plant Science Journal, 10(1):25-34. (in Chinese)

[38]
Ying J S, 1994. An analysis of the flora of Qinling Mountain range: Its nature, characteristics and origins. Acta Phytotaxonomica Sinica, 32(5):389-410. (in Chinese)

[39]
Yu X F, 1958. Physical geography in Qinling Mountain. Journal of South China Normal University (Social Science Edition), (3):157-175. (in Chinese)

[40]
Zhang B P, 2019. Ten major scientific issues concerning the study of China’s north-south transitional zone. Progress in Geography, 38(3):305-311. (in Chinese)

[41]
Zhang B P, Tan J, Yao Y H, et al., 2009. The Geo-info-spectrum of Montane Altitudinal Belts. Beijing: China Environmental Science Press. (in Chinese)

[42]
Zhang H D, Wang B S, Hu Y J, et al., 1983. The plant communities on the north slope of Dawu Mountain, Kowloon. Ecological Science, 2(1):1-10. (in Chinese)

[43]
Zhang J T, 2004. Numerical Ecology. Beijing: Science Press. (in Chinese)

[44]
Zhang L X, Li S F, 1998. Characters of seed plants flora and vegetation from Yixing Forest Nature Reserve in Jiangsu Province. Journal of Plant Resources and Environment, 7(4):1-7. (in Chinese)

[45]
Zhang X Z, Zhang Z Y, 1979. A preliminary discussion on the northern boundary of subtropical zone in China: based on the distribution of broadleaf woody evergreens on the Qinling Mountain. Acta Geographica Sinica, 34(4):342-352. (in Chinese)

[46]
Zhang Z Y, Yuan Y M, 1989. The geographical distribution and floristic characteristics of genera endemic spermatophytes to China in Qinling. Acta Botanica Boreali-Occidentalia Sinica, 9(1):32-39. (in Chinese)

[47]
Zhao F, Zhang B P, Zhu L Q, et al., 2019. Spectra structures of altitudinal belts and their significance for determining the boundary between warm temperate and subtropical zones in the Qinling-Daba Mountains. Acta Geographica Sinica, 74(5):889-901. (in Chinese)

[48]
Zhao S Q, 1983. A new scheme for comprehensive physical regionalization in China. Acta Geographica Sinica, 38(1):1-10. (in Chinese)

[49]
Zhou B H, Yu S J, 2008. Characteristics and environmental functions evaluation of the Pinus taiwanesis community in Tianzhu Mountain. Geographical Research, 27(2):257-265. (in Chinese)

[50]
Zhou T R, Liu P T, 1956. Topography and Soil in China. Beijing: The Commercial Press. (in Chinese)

[51]
Zhu K Z, 1958. Subtropics of China. Chinese Science Bulletin, 9(17):524-528. (in Chinese)

Outlines

/