Interaction between urbanization and eco-environment in the Tibetan Plateau

  • FENG Yuxue , 1, 2 ,
  • LI Guangdong , 1, 2, *
Expand
  • 1. Key Laboratory of Regional Sustainable Development Modeling, Institute of Geographic Sciences and Natural Resources Research, CAS, Beijing 100101, China
  • 2. College of Resources and Environment, University of Chinese Academy of Sciences, Beijing 100049, China
*Li Guangdong (1986-), PhD and Associate Professor, specialized in urban geography and the coupling relationship between urbanization and the environment. E-mail:

Feng Yuxue (1996-), Master, specialized in coupling relationship between urbanization and eco-environment. E-mail:

Received date: 2020-09-01

  Accepted date: 2020-11-10

  Online published: 2021-04-25

Supported by

The Second Tibetan Plateau Scientific Expedition and Research Program (STEP)(2019QZKK1005)

National Natural Science Foundation of China(41971207)

Copyright

Copyright reserved © 2021. Office of Journal of Geographical Sciences All articles published represent the opinions of the authors, and do not reflect the official policy of the Chinese Medical Association or the Editorial Board, unless this is clearly specified.

Abstract

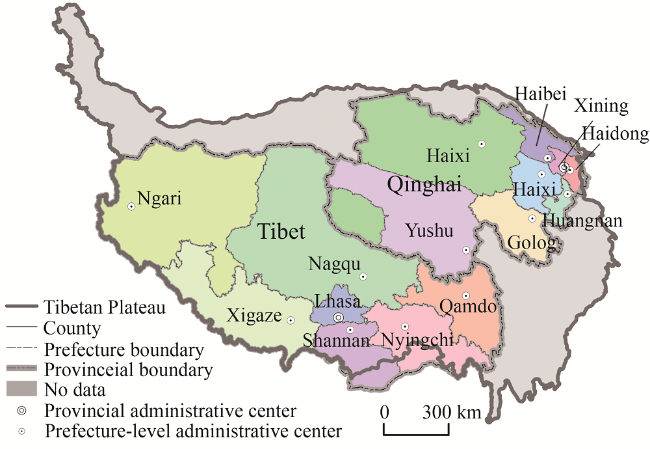
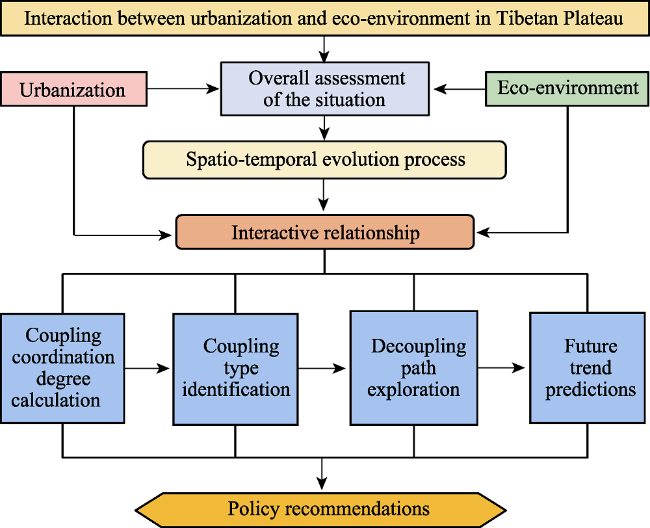
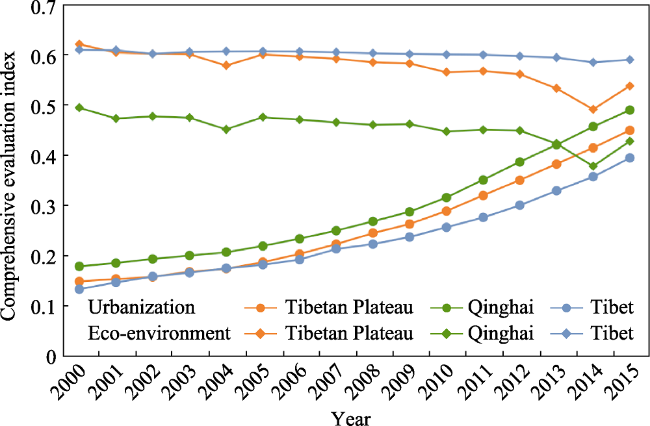
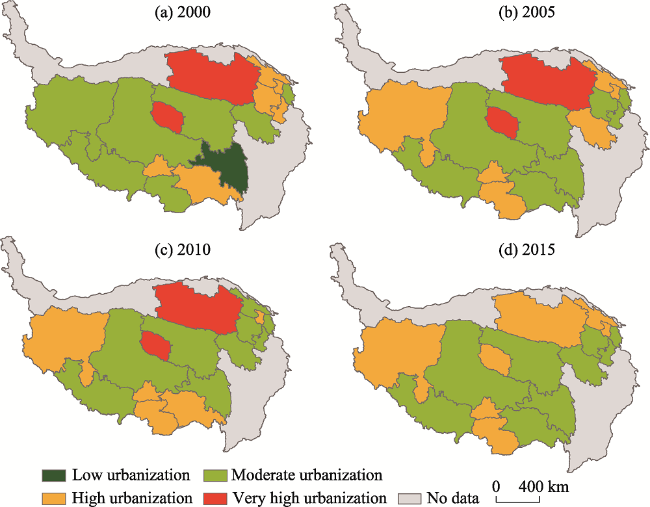
A scientific evaluation of the broad reciprocal influences between urbanization and the eco-environment in the Tibetan Plateau region is of great significance for increasing the speed and quality of urbanization as well as restoring and improving the eco-environment. Based on a thorough look at the progress made by research on interactions between urbanization and the eco-environment in the Tibetan Plateau region, this article attempts to construct a complete analytical model of the reciprocal influences that can achieve the whole process of analyzing evaluation indexes, quantifying coupling coordination, identifying coupling types, exploring decoupling paths, and predicting future trends. Using multi-scale analysis of the Tibetan Plateau and its provinces and prefecture-level units as a means of comparison, we attempt to clarify differences at different scales, identify problem areas and propose targeted improvement measures. The result shows that the urbanization evaluation indexes for the Tibetan Plateau at different scales rise in stages and that the urbanization index for Qinghai is higher than for Tibet; the changes in the eco-environment index of the two regions are also different, with a downward trend in Qinghai and a trend toward stability in Tibet, and with stratification in the eco-environment indexes of prefecture-level units; the degree of coupling coordination between urbanization and the eco-environment at different scales in the Tibetan Plateau region is increasing overall, with the type of coordination changing from uncoordinated deterioration to borderline uncoordinated deterioration, and ultimately changing into scarcely coordinated development, which basically puts the region into the logging urbanization category; and the urbanization and eco-environment indexes display a dynamic trend of alternating between strong decoupling and weak decoupling, indicating that there is a negative reciprocal influence between urbanization and eco-environment at different scales and that the phenomenon of passive urbanization is prominent. We predict that in the next 10 years, the system coupling coordination of prefecture-level units in the Tibetan Plateau region will steadily increase, but there will be significant discrepancies in the growth rates of different regions.

Cite this article

FENG Yuxue , LI Guangdong . Interaction between urbanization and eco-environment in the Tibetan Plateau[J]. Journal of Geographical Sciences, 2021 , 31(2) : 298 -324 . DOI: 10.1007/s11442-021-1838-8

1 Introduction

Ecologically fragile areas usually refer to areas with weak resistance and elasticity to external disturbances of varying intensity. Ecosystem fragility is often rooted in natural background conditions, such as topography, climate and vegetation structure. Intense interference from human activities is a key factor in increasing ecosystem fragility. Chinese and foreign scholars are currently interested in topics such as the relationship between urbanization and the environment in ecologically fragile areas and the relationship between ecosystem fragility and poverty in decoupled areas. The typical fragile frigid high-altitude area of the Tibetan Plateau is known as the “Roof of the World” and the “Third Pole”. It is the source of many major rivers and an “ecological source” (Liu, 2009), giving it a special environmental status. It has been calculated that the economic values of products from the various ecosystems of the Tibetan Plateau are worth about 17 billion yuan per year and that the region has an annual water conservation capacity of 261.2 billion m3, with an economic value of 174.4 billion yuan (Lu et al., 2004). On the other hand, the majority of the Tibetan Plateau suffers from severe or moderate ecosystem fragility (Tuan et al., 2018), with fragility scores of 0.8329 for the Tibet Autonomous Region and 0.8045 for Qinghai Province (which make up the plateau region), making them extremely vulnerable areas (Zhao et al., 1998). In addition, environmental changes on the Tibetan Plateau have had an impact on sensitive surface processes, which are having long-term and widespread effects on the entire Northern Hemisphere and even the global climate and environmental system (Yan et al., 2006). Given the region’s special ecological status, ecosystem fragility, and significant spatial transfer effects, as well as increasingly frequent human activities, the relationship between human activities and eco-environment on the Tibetan Plateau has received increasing attention in recent years.
Chinese and foreign scholars have conducted a series of studies on this topic, which can be divided into the following three main categories. The first category of the studies focuses on the impact of human activities (mainly changing land use) and global warming on the ecological processes of the Tibetan Plateau. For example, it has been noted that humankind’s ecological footprint is increasing and that human activities pose a serious threat to the Tibetan Plateau (Li et al., 2018a). A study on the interactive relationship between the intensity of human activities and the value of ecosystem services of the Tibetan Plateau found that areas with high values of ecosystem services had a higher intensity of human activities (Li et al., 2018b). Based on this, the impact of human activities and global warming on the biochemical cycle of the Tibetan Plateau (Chen et al., 2013), the energy cycle (Yang et al., 2014), forest ecosystems (Lamsal et al., 2017), local climates (Cui et al., 2006), etc., have been explored. The second category of the studies focuses on the impact of remote human activities on the changing environment of the Tibetan Plateau and the responses of other regions to environmental change on the Tibetan Plateau. For example, the accelerated melting of glaciers on the Tibetan Plateau due to regional air pollutants (Kang et al., 2019); the weakening of the East Asian monsoon due to a decrease in the spring sensible heat flux in the Tibetan Plateau region caused by human activities (Ma et al., 2017); and the significant impact the climate change in the Tibetan Plateau region has on heavy summer rainfall in East Asia (Ge et al., 2019). The third category of the studies focuses on the analysis and attribution of the effects of human activities on climate change in the Tibetan Plateau region. For example, improper logging practices degrade forests and cause severe soil erosion, increasing the frequency of natural disasters (Niu, 1999); large-scale anthropogenic changes in land use in pursuit of economic benefits that change land cover influences climate change on the plateau (Wang et al., 2008); and long-term overgrazing can lead to grassland degradation and even desertification, so intensive human activities can cause changes in surface temperatures and precipitation, which in turn lead to permafrost degradation on the plateau (Cui et al., 2009).
Current rapid urbanization, rapid population growth, and irrational development and utilization of resources on the Tibetan Plateau have resulted in a recent regional trend of environmental degradation (Niu, 2019). This coupled with the impact of global warming, has resulted in destabilizing climate change in the region. From the perspective of maintaining the sustainable development of the Tibetan Plateau, practical coordination mechanisms between humans and nature as well as environmental protection policies must be implemented to alleviate severe ecological degradation and respond to environmental threats (Liu et al., 2018). Effects of urbanization—the most irreversible human activity in the socio-economic system—on the eco-environment of the Tibetan Plateau are inevitable; however, there is still a debate regarding developing urbanization on the Tibetan Plateau. The key points of the debate are whether urbanization is needed on the Tibetan Plateau, which urbanization development model should be selected based on the characteristics of the plateau, and how the relationship between urbanization and the region’s environment should be handled (Fang et al., 2015). As a result, it is necessary to study coupling between urbanization and eco-environment in this region.
Indeed, scholars have already conducted specific calculations at the provincial level regarding the degree of coupling coordination and coordination between urbanization and the eco-environment in the region. The results of these studies show an improvement in coupling coordination in Qinghai Province between 1978 and 2016, gradually approaching a state of coordination (Xue et al., 2007; Yang et al., 2013; Zhang et al., 2018), while Tibet had a low degree of coordination, though its deterioration has been contained in recent years (Fan et al., 2015; Wang et al., 2015; Cao et al., 2016). Nevertheless, the existing research neither sheds light on the relationship between urbanization and the environment on the Tibetan Plateau nor the stage and extent of the impact of urbanization on the eco-environment. In terms of indicator selection, the existing research does not look at the particularities of the Tibetan Plateau, and most of the eco-environmental data used is statistical. The time scale of the available literature tends to be historical, and no predictions are made for the future. The research method has always involved focusing on the coupling relationship between urbanization and eco-environment, without analysis of the decoupling relationship between the two. In terms of spatial scale, there have been no studies looking at the overall regional scale or prefectural administrative units, and there have been no comparisons of provincial-level areas.
Based on the above analysis, this article takes the Tibetan Plateau region as its research target and attempts to conduct a comprehensive and systematic study of the interactions between urbanization and eco-environment of the plateau by conducting multi-scale research, from the Tibetan Plateau as a whole, to provincial and prefectural administrative units. This study uses a distance coordination and coupling model and Tapio’s decoupling model to study the complex relationship between urbanization and eco-environment and its dynamic evolution characteristics from the two dimensions of coupling and decoupling. A grey system prediction model is also used to couple urbanization and the environment of the Tibetan Plateau in the future. It is hoped that this study will serve as a reference for developing China’s new type of urbanization on the Tibetan Plateau and for balancing and coordinating the development of urbanization and the environment. It is also hoped that it will provide ideas and methods for studying the relationship between urbanization and the environment in other ecologically fragile areas in China and abroad.

2 Research method and data sources

2.1 Overview of the study area and data sources

2.1.1 Overview of the study area
The Tibetan Plateau has an average altitude of more than 4000 m. In China’s national plan of major function-oriented zones, the Tibetan Plateau is an ecological barrier zone and is classified as a key eco-function zone and a zone in which development is prohibited. The study area of this paper is the core area of the Tibetan Plateau, which includes the Tibet Autonomous Region and Qinghai Province, with a total area of 1,898,900 km2 (Figure 1).
Figure 1 Map of the Tibetan Plateau
The level of urbanization on the Tibetan Plateau is low. In 2015, the level of urbanization of the study area was 42%, lower than the national level by 14.10%. The regional economic development level is also relatively low. In 2015, the gross regional product of Qinghai stood at 241.7 billion yuan and that of Tibet 102.6 billion yuan, accounting for 0.33% and 0.14% of China’s GDP, respectively. Between the 1970s and the beginning of this century, the area of land covered by glaciers and wetlands on the Tibetan Plateau shrank severely. Desertified land accounted for 19.5% of the total area of the Tibetan Plateau, with the most severely desertified land growing at a rate of 311.5%. Grassland degradation was also severe, reducing at a rate of 24.3% (Niu, 1999). The “Plan for Regional Ecological Construction and Environmental Protection on the Tibetan Plateau (2011-2030)” was promulgated and implemented in 2011, which curbed the trend of ecosystem degradation in some areas to a certain extent (SCIO, 2018). Gradual improvements in the eco-environment do not mean, however, that it is acceptable to recommence the old pattern of urbanization. It is vital to pay attention to the environment of the plateau and formulate a rational urbanization strategy.
2.1.2 Spatial scale and basic administrative units
This article seeks to study the interactive and influential relationship between urbanization and eco-environment of the Tibetan Plateau at three spatial scales, namely, the overall Tibetan Plateau scale, the provincial scale and the prefectural administrative unit scale. At the overall Tibetan Plateau level, the study area comprises Qinghai Province and the Tibet Autonomous Region. The provincial scale includes the two individual provincial units of Qinghai Province and the Tibet Autonomous Region. The prefectural administrative unit scale includes 15 units under the jurisdiction of Qinghai Province and the Tibet Autonomous Region, including 8 prefecture-level cities, 6 autonomous prefectures, and 1 prefecture.
2.1.3 Data sources
The research period of this study is 2000-2015. Socio-economic data was taken from the Qinghai Province Statistical Yearbook (2001-2016), the Tibet Statistical Yearbook (2001-2016) and the China Statistical Yearbook (2001-2016). Land cover data came from the European Space Agency (ESA CCI: http://maps.elie.ucl.ac.be/CCI/viewer/download.php), at a resolution of 300 m × 300 m. Ecosystem service values were calculated using the ecosystem service value evaluation method based on unit area value equivalent factors created by Xie Gaodi (Xie et al., 2015). Vegetation coverage data came from NASA (MODIS data: https://modis.gsfc.nasa.gov/data/dataprod/mod13.php). Relevant landscape indicators were calculated using Fragstats V4.2 based on land cover data. CO2 emission data was calculated based on relevant literature (Wang et al., 2016), and PM2.5 data from the Atmospheric Composition Analysis Group at Dalhousie University (http://fizz.phys.dal.ca/~atmos/martin/?page_id= 140).
2.1.4 Research framework
The research ideas relating to this article are shown in Figure 2. This article attempts to construct a complete analytical model of the interactions between urbanization and eco-environment that can achieve the whole process of analyzing evaluation indexes, quantifying coupling coordination, identifying coupling types, exploring decoupling paths and predicting future trends, to ultimately provide policy recommendations based on the research results.
Figure 2 Framework showing the analysis of the relationship between urbanization and eco-environment on the Tibetan Plateau

2.2 Constructing comprehensive evaluation indexes for urbanization and eco-environment

2.2.1 Urbanization comprehensive evaluation index system
Based on a combination of the real-life circumstances of the region and the availability of data, urbanization is divided into four primary indicators: population urbanization, economic urbanization, spatial urbanization, and social urbanization. Ten basic indicators, including urban population density and urban population proportion, constitute the urbanization comprehensive evaluation index system in the study area. The entropy method and the analytic hierarchical process are used to calculate the weights of the various indicators to comprehensively evaluate the urbanization level of the Tibetan Plateau (Table 1).
Table 1 Urbanization comprehensive evaluation indicators and their weightings
Entropy weight Analytical hierarchical process weight Overall weight Indicator Entropy weight Analytic hierarchical process weight Overall weight
Population urbanization 0.1991 0.1238 0.1582 Urban population density (people/ km2) 0.5461 0.3333 0.4130
Urban population (%) 0.5518 0.6667 0.5870
Economic
urbanization
0.4027 0.3875 0.3981 Per capita GDP (10,000 yuan) 0.2689 0.4704 0.3558
Secondary and tertiary industry output value as a proportion of GDP (%) 0.2725 0.2797 0.2762
Fiscal revenue as a proportion
of GRP (%)
0.2721 0.1142 0.1764
Total fixed-asset investment
(10,000 yuan)
0.2699 0.1358 0.1916
Spatial
urbanization
0.1050 0.1011 0.1038 Urban built-up area per 10,000
people (km2)
1.0000 1.0000 1.0000
Social
urbanization
0.2996 0.3875 0.3398 Per capita disposable income of urban residents (yuan) 0.3695 0.5499 0.4369
Number of health institutions per 10,000 people 0.3797 0.2098 0.2735
Total retail sales of consumer goods (10,000 yuan) 0.3719 0.2402 0.2896
2.2.2 Eco-nvironment comprehensive evaluation index system
The eco-environment of the Tibetan Plateau is unique. When constructing an evaluation index system to measure the region’s eco-environment, it is necessary to consider the changing special land types of the plateau, such as glaciers, unused land and grassland. With this in mind, this paper divides the environment into four level-one indicators: ecosystem structure, eco-environmental function, eco-environmental pressure, and eco-environmental pattern. We also use 13 basic indicators, including Patch Density, Shannon’s Diversity Index, Connectance Index and forest coverage, to create a comprehensive evaluation index system for the eco-environment of the Tibetan Plateau (Table 2).
Table 2 Eco-environment comprehensive evaluation indicators and their weightings
Criterion Entropy weight Analytic hierarchical process weight Overall weight Indicator Entropy weight Analytic hierarchical process weight Overall weight
Ecosystem
structure
0.3709 0.3145 0.3464 Grassland coverage (%) (+) 0.2182 0.2234 0.2209
Wetland (%) (+) 0.2019 0.1829 0.1923
Forest coverage (%) (+) 0.1677 0.1688 0.1684
Glacier (%) (+) 0.1968 0.1829 0.1898
Vegetation coverage index (+) 0.2155 0.2420 0.2285
Eco-environmental function 0.1480 0.2845 0.2081 Ecological space (%) (+) 0.5412 0.4013 0.4707
Ecosystem service value (yuan) (+) 0.4588 0.5987 0.5293
Eco-environmental pressure 0.2470 0.2005 0.2257 Average PM2.5 concentration (μg) (-) 0.3317 0.2702 0.3001
CO2 emissions (10,000 t) (-) 0.3339 0.3528 0.3440
Encroachment on biological habitats (hm2) (-) 0.3345 0.3771 0.3560
Eco-environmental pattern 0.2341 0.2005 0.2197 Landscape fragmentation (-) 0.3446 0.3548 0.3502
Landscape connectivity (+) 0.3166 0.3548 0.3356
Landscape diversity (+) 0.3388 0.2905 0.3142
2.2.3 Index preprocessing and weighting
To remove the influence of different magnitudes and dimensions of the various indicators from the calculation results, the indicators are standardized to reduce the interference of random factors. The different environment indicators can be divided into positive effect indicators and negative effect indicators using the following standardized processing formula (Liang et al., 2019):
${{A}_{ij}}=\left\{ \begin{align} & {{X}_{ij}}-\min \left( {{X}_{ij}} \right)/\max \left( {{X}_{ij}} \right)-\min \left( {{X}_{ij}} \right) \\ & \max \left( {{X}_{ij}} \right)-{{X}_{ij}}/\max \left( {{X}_{ij}} \right)-\min \left( {{X}_{ij}} \right) \\ \end{align} \right\}$
where i is the indicator number, j is the year, Xij is the actual calculated value, and max (Xij) and min (Xij) are the maximum and minimum values of indicator i after standardization. The higher the all index values, the better.
The indicator weight reflects the relative importance of the indicator, and it has an important influence on the accuracy and reliability of the evaluation results. This study combines subjective and objective weighting methods. Subjective weightings use the analytic hierarchical process, with experts invited to evaluate and score the indicators in the comprehensive evaluation index system. Objective weightings use the entropy method. Finally, the principle of minimum information entropy is used to synthesize the subjective and objective weights to reduce deviation. w1i and w2i are the weights calculated using the entropy method and analytic hierarchy process, respectively. The specific equation is as follows (Liang et al., 2019):
${{w}_{i}}=\frac{{{\left( {{w}_{1i}}\times {{w}_{2i}} \right)}^{1/2}}}{\sum\nolimits_{i=1}^{n}{{{\left( {{w}_{1i}}\times {{w}_{2i}} \right)}^{1/2}}}}$
2.2.4 Determining urbanization and eco-environment comprehensive evaluation values
With the system index evaluation model, the linear weighting method is used to first calculate the evaluation index value of the population, economic, social and spatial urbanization subsystems and the ecosystem structure, eco-environmental function, eco-environmental pressure and eco-environmental pattern subsystems, and then obtain urbanization and the eco-environment comprehensive evaluation values. The formulas are as follows (Liang et al., 2019):
$f\left( x \right)=\sum\nolimits_{i=1}^{n}{{{w}_{i}}\times {{x}_{i}},g\left( y \right)=\sum\nolimits_{j=1}^{m}{{{w}_{j}}\times {{y}_{j}}}}$
$F\left( x \right)=\sum\nolimits_{i=1}^{n}{{{W}_{i}}\times f\left( x \right),G\left( y \right)=\sum\nolimits_{j=1}^{m}{{{W}_{j}}\times g\left( y \right)}}$
where f(x) and g(y) represent the comprehensive evaluation values of urbanization and environment subsystems, respectively; F(x) and G(y) are the comprehensive evaluation values of urbanization and eco-environment systems; xi and yi are the standardized values of urbanization and eco-environmental evaluation indicators, respectively; wi and wj represent the overall weightings of urbanization and eco-environmental evaluation indicators, respectively; and Wi and Wj are the weightings of urbanization and eco-environment subsystems, respectively.

2.3 Model for calculating the degree of coupling coordination of urbanization and eco-environment

A coupling coordination degree model can quantitatively evaluate the degree of coordination in the interactive coupling between urbanization and eco-environment systems, which helps us understand problems in the development process more detailedly and more clearly. This study uses the system coordination development model, which is based on the degree of distance coordination. To calculate the degree of coordination, the model uses the Euclidean distance to measure the distance between the real-life state and the ideal state of the system, that is, the deviation between the real-life value and the ideal value of the evaluation variable (Tang et al., 2010). It emphasizes the definition of the ideal state, does not use fixed variables and ideal values, and reduces the interference of subjective factors.
Assuming that the ideal state of coordination of urbanization and eco-environment systems is A´, when the system is in an ideal state of coordination, the two systems drive each other on and are in the same development state. According to the ideal state of coordination, wherein the degree of development of the two systems is the evaluation variable, the ideal value is equal to the real-life value of the development of the other system. If x1t and x1t as well as x2t and x2t represent the real-life values and ideal values of the degree of development of the urbanization system and eco-environment system in year t, then the formula for calculating the distance coordination degree is as follows (Tang et al., 2010):
${{c}_{t}}={{\left( \sqrt{1-\sqrt{\frac{\sum\nolimits_{i=1}^{2}{\left( {{x}_{it}}-{{{{x}'}}_{it}} \right)}}{\sum\nolimits_{i=1}^{2}{s_{i}^{2}}}}} \right)}^{k}}$
Assuming that the two systems are equally important, so that s1=s2=1 and k is the adjustment coefficient, so k=2, then the degree of coordination between urbanization and eco-environment systems is as follows (Tang et al., 2010):
${{c}_{t}}={{\left( \sqrt{1-\sqrt{\frac{\left( {{x}_{1t}}-{{{{x}'}}_{2t}} \right)-\left( {{x}_{2t}}-{{{{x}'}}_{1t}} \right)}{2}}} \right)}^{2}}=1-\left| \left( {{x}_{1t}}-{{x}_{2t}} \right) \right|$
where ct represents the degree of coordination between the systems in year t. The larger the value of ct, the closer the actual coordination of the systems to the ideal coordination state and the higher the level of coordination between the urbanization and environment systems.
The degree of coordinated development between the systems reflects the level of coordinated development of the systems. The formula to calculate the coordinated development degree of the systems based on the distance coordination degree is as follows (Tang et al., 2010):
${{d}_{t}}=D\left( {{x}_{t}},{{c}_{t}} \right)=\sqrt{{{x}_{t}}{{c}_{t}}}$
where dt represents the coordinated development degree of the systems in year t. The higher the value of dt, the higher the level of coordinated development between the systems.
With reference to existing research, we divided the coordinated development of the urbanization and eco-environment systems into three categories: coordinated development, transitional and uncoordinated. Based on specific values, the transitional category is further divided into scarcely coordinated development and borderline uncoordinated deterioration, giving a total of four sub-categories. According to the differences in the development levels of urbanization and the environment and the real-life situation in the study area, the sub-categories are further divided into 12 basic types (Liao, 1999) (Table 3).
Table 3 Classification standards of coordinated development types for urbanization and eco-environment
Main category Degree of coordinated development Sub-category Comparison of
F(x) and G(y)
Basic type
Coordinated development 0.60-1.00 Coordinated development (Ⅳ) F(x)-G(y) > 0.1 Coordinated development with lagging environment (Ⅳ-1)
|F(x)-G(y)|≤0.1 Coordinated development with simultaneous urbanization and environment (Ⅳ-2)
G(y)-F(x) > 0.1 Coordinated development with lagging urbanization (Ⅳ-3)
Transitional 0.50-0.59 Scarcely
coordinated development (Ⅲ)
F(x)-G(y) >0.1 Scarcely coordinated development with lagging environment (Ⅲ-1)
|F(x)-G(y)|≤0.1 Scarcely coordinated development (Ⅲ-2)
G(y)-F(x) > 0.1 Scarcely coordinated development with lagging urbanization (Ⅲ-3)
0.40-0.49 Borderline uncoordinated deterioration (Ⅱ) F(x)-G(y) > 0.1 Borderline uncoordinated deterioration with lagging environment (Ⅱ-1)
|F(x)-G(y)|≤0.1 Borderline uncoordinated deterioration (Ⅱ-2)
G(y)-F(x) > 0.1 Borderline uncoordinated deterioration with lagging urbanization (Ⅱ-3)
Uncoordinated 0.00-0.39 Uncoordinated deterioration (Ⅰ) F(x)-G(y) > 0.1 Uncoordinated deterioration with lagging environment (Ⅰ-1)
|F(x)-G(y)|≤0.1 Uncoordinated deterioration with common losses to urbanization and environment (Ⅰ-2)
G(y)-F(x) > 0.1 Uncoordinated deterioration with lagging urbanization (Ⅰ-3)

2.4 Constructing a decoupling model for the reciprocally influential relationship between urbanization and eco-environment

Decoupling was originally a concept in physics, referring to when an interactive relationship between two objects reduces or no longer exists. The Organization for Economic Cooperation and Development (OECD) introduced the concept of decoupling theory to the field of environmental economy and used it widely to describe the relationship between economic growth and environmental pollution. The interaction between urbanization and eco-environment is similar to that between economic growth and environmental pollution. Previous studies have used Tapio’s decoupling model to study the relationship between urbanization and the resource environment (Guo et al., 2018). Tapio’s decoupling model focuses on the relative size of the growth rate, which is conducive to characterizing the relative development of the research target. This study, using this method and combined with the aforementioned method for evaluating system coordinated development based on distance coordination, can better depict the complex relationship between urbanization and the eco-environment in each stage of coordinated development. The specific formula is as follows:
$D{{I}_{t}}=\frac{\left( {{E}_{t}}-{{E}_{t-1}} \right)/{{E}_{t-1}}}{\left( {{U}_{t}}-{{U}_{t-1}} \right)/{{U}_{t-1}}}$
where Et and Et-1 are the environmental level indexes in year t and t-1, respectively, and Ut and Ut-1 are the urbanization level indexes in year t and t-1, respectively, and DIt is the decoupling index in year t. Taking 0, 0.8, and 1.2 as critical values, and with reference to the positive and negative conditions of the environment index growth rate and the urbanization index growth rate, Tapio’s model subdivides decoupling into the following eight categories: recessive decoupling, strong decoupling, weak decoupling, expansive connection, recessive coupling, expansive negative decoupling, strong negative decoupling, and weak negative decoupling (Tapio, 2005) (Table 4).
Table 4 Standards for classifying decoupling states (Li et al., 2019)
State Environment index growth rate Urbanization index growth rate Decoupling
index (DI)
Decoupling Recessive decoupling - - DI>1.2
Strong decoupling - + DI<0
Weak decoupling + + 0<DI<0.8
Connection Expansive coupling + + 0.8<DI<1.2
Recessive coupling - - 0.8<DI<1.2
Negative decoupling Expansive negative decoupling + + DI>1.2
Strong negative decoupling + - DI<0
Weak negative decoupling - - 0<DI<0.8

2.5 Grey forecasting model of future evolution trends

Grey system theory takes uncertain systems with small samples and deficient information as its target. By generating and developing the known information, valuable information is extracted to achieve a correct description and effective monitoring of a system’s operational behavior and evolution principles. In this study, a grey forecasting model GM (1, 1) is used to quantitatively predict the evolution of the coupling coordination degree over time and obtain future index values (Zhou et al., 2016).
First, the original time series is as follows:
${{A}_{0}}=\left[ {{a}_{0}}\left( 1 \right)\text{-}\delta /\beta \right]_{e}^{-\beta k}+\delta /\beta \ \ \ \ \ \ \ k=(1,2,...,n)$
Next, we apply accumulation to A0 to generate a sequence:
${{A}_{1}}\text{=}\left[ {{a}_{1}}\left( 1 \right),{{a}_{1}}\left( 2 \right),\cdots ,{{a}_{1}}\left( n \right) \right]$
Then, we construct matrix B, Yn, with the corresponding differential equation:
$\frac{d{{A}_{1}}}{dt}+\beta {{A}_{1}}=\delta$
where β is the development grey number and δ is the endogenous control grey number. With the parameter vector set to be estimated, the least square method is used to solve the equation and ultimately obtain the prediction model:
$a_{1}^{T}{{\hat{A}}_{1}}\left( k+1 \right)=\left[ {{a}_{0}}(1)-\delta /\beta \right]_{e}^{(-\beta k)}+\delta /\beta \begin{matrix} {} & {} \\\end{matrix}k=\left( 1,2,\cdots ,n \right)$
Finally, the prediction model is tested for accuracy, and the test ratio of relative accuracy to the post-test deviation is calculated. Once the model passes the test, a reasonable and effective predicted value is obtained.

3 Results

3.1 Analysis of the urbanization and eco-environment comprehensive evaluation indexes

3.1.1 Spatio-temporal evolution in the urbanization comprehensive evaluation index
(1) The Tibetan Plateau and provincial scales. As shown in Figure 3, from 2000 to 2015, the overall urbanization indexes of the Tibetan Plateau, and of Qinghai and Tibet individually, had low starting points and rose steadily. The urbanization evaluation index of Qinghai remained the highest throughout the period, and the value for the Tibetan Plateau region was between the values of Qinghai and Tibet. The main reason for this is that, in recent years, Qinghai has seized development opportunities presented by the Western Development Strategy by developing salt lakes, oil and gas, and other local resources, as well as developing competitive industries, which helped it enter a phase of rapid urbanization. Currently, most cities with high levels of urbanization in the Tibetan Plateau region are located in Qinghai, such as Xining, Golmud and Delingha. However, Tibet had a lower starting point and a more fragile eco-environment than Qinghai, which has placed stronger constraints on urbanization. It also suffers from poor transport links, with weak external connections, and low urbanization efficiency, leaving it lagging behind Qinghai.
Figure 3 Temporal changes in the comprehensive evaluation indexes for the Tibetan Plateau, Qinghai Province and the Tibet Autonomous Region
(2) The prefectural scale. As shown in Figure 4, the urbanization evaluation indexes of prefectural units display a clear upward trend. The top three evaluation indexes in 2015 were Haixi, Xining and Lhasa. Haixi and Xining have always held leading positions. The reasons can be summarized in the following two aspects. First, they both have sound urbanization development bases. Urbanization in Haixi is industry-driven, built around the utilization of lakeside resources, from which a complete industrial system has been constructed. Xining is a provincial capital and has locational advantages. The development of the Xining (national-level) Economic and Technological Development Zone has also effectively promoted urbanization. Second, both Haixi and Xining have urbanization levels of between 60% and 70%, which is higher than the national average, which indicates that they are in the middle or latter stages of urbanization development and the quality of their urbanization is gradually improving. Haixi and Xining have some of the highest levels of per capita GDP, fixed-asset investment and social urbanization, indicating that both have relatively high urban economic development and urban infrastructure construction capabilities as well as relatively good social public service facilities.
Figure 4 Temporal changes in the urbanization comprehensive evaluation index of each prefecture-level city in the Tibetan Plateau from 2000 to 2015
By contrast, Qamdo has consistently had a low level of urbanization and experienced a low growth rate during the study period. This is because the economic development of Qamdo is mainly driven by state and autonomous region investment, with low retail sales of consumer goods, a limited consumption-driven economy, low level of production development and underdeveloped industrial development. Although the city’s tourism industry has developed to some extent, yet the lagging infrastructure construction and service capabilities mean that the industry is still unable to act as the primary driver of urbanization. Qamdo needs to set a course for its future urbanization and select appropriate leading industries to move onto a rational and effective urban development path.
We selected the urbanization evaluation indexes of the Tibetan Plateau for 2000, 2005, 2010 and 2015 to conduct spatial visualization analysis. To reflect the standardization and comparability of the urbanization evaluation indexes under different time scales, 0.5 times, 1.0 times and 1.5 times the average value of urbanization indexes for each local level unit in those years were selected as the standards of division. The four corresponding types of urbanization are identified as very high urbanization (>1.5 times), high urbanization (1.0-1.5 times), moderate urbanization (0.5-1.0 times), and low urbanization (≤0.5 times).
Figure 5 shows that the spatial patterns of high urbanization areas and moderate urbanization areas of the Tibetan Plateau are relatively stable, mainly along the Qinghai-Tibet Railway, but there are almost no low urbanization areas. Xining and Lhasa were both high urbanization areas between 2000 and 2015, while Haixi was a high urbanization area from 2000 to 2010 but became just a high urbanization area in 2015. Lhasa, Xining and Haixi, as areas with high levels of urbanization on the Tibetan Plateau, constitute three core urbanization areas in the region, and they drive the development of surrounding cities. This kind of driving effect is illustrated by the development of Haibei and Shannan, both of which receive a radial effect from core areas and have developed into high urbanization areas. Haibei is close to both Haixi and Xining, and can cooperate directly with both places, giving it closer ties to accelerate its own development. Shannan is close to Lhasa and complements Lhasa’s industrial structure, allowing it to use Lhasa to drive its own urbanization. This also shows that the Lhasa-Shannan integrated development strategy is practical and feasible. In the future, the two cities can deepen their cooperation and further expand the scope of radial effects. In addition, the Ngari is another high urbanization area, but Ngari is sparsely populated and its overall economic output is poor. It still relies on assistance from other regions and central fiscal transfer payments to support regional development, which means it does well in some per capita indicators. There is still a gap between its urbanization level and those of Lhasa and Shannan, which are both also high urbanization areas.
Figure 5 Spatial evolution of urbanization evaluation indexes for each prefecture-level city in the Tibetan Plateau from 2000 to 2015
Nyingchi fluctuates between a moderate urbanization area and a high urbanization area. This is because its urbanization mainly relies on ecological tourism, but it has weak infrastructure construction, a limited international tourism market and it has encountered bottlenecks in developing tourism, giving it insufficient momentum for urbanization.
The three prefectures of Hainan, Huangnan and Golog receded from high urbanization areas to moderate urbanization areas. These three places are located in agro-pastoral areas, where the land use type is mainly grassland and the industrial structure is dominated by agriculture and animal husbandry, so they face the problems of animal husbandry’s extensive mode of economic growth and short industry chain as well as the low added value of agricultural and livestock products, all of which means that urbanization lacks effective motivation.
The five prefecture-level units of Nagqu, Xigaze (Shigatse), Qamdo, Yushu, and Haidong have long been medium urbanization areas, with urbanization evaluation index values similar to the overall average. In the future, they need to make full use of local resources and rationally locate urban functions to achieve a more effective path to urbanization.
3.1.2 Spatio-temporal evolution in the eco-environment comprehensive evaluation index
(1) The Tibetan Plateau and provincial scales. As can be seen from Figure 3, overall, the eco-environment indexes of the Tibetan Plateau and Qinghai Province have declined. Their lowest points were in 2014 but they rebounded slightly in 2015. The Tibet Autonomous Region remained basically stable throughout the study period, with a slight decline. It shows that fluctuations in the eco-environment of the Tibetan Plateau region as a whole were mainly driven by Qinghai. The concentration of PM2.5 in Qinghai Province increased sharply in 2014, causing a sharp drop in the environment evaluation index, but it rebounded slightly in 2015. This trend of change shows that Qinghai realized the negative impact its extensive urbanization model was having on the environment and began to control pollution from high-energy-consuming enterprises. Although ecological improvements have been made, they are still behind the pace of urbanization.
(2) The prefectural scale. Looking at the prefectural scale, the development trend of prefecture-level units displays obvious phases and heterogeneity (Figure 6). The period from 2000 to 2013 was largely stable, whereas, the period from 2013 to 2015 saw many fluctuations. Heterogeneity is manifested, first of all, in the numerical stratification of the eco-environment comprehensive evaluation index values, with Nyingchi having the highest and Haidong, Haixi and Xining having the lowest. It is also manifested in the different fluctuations. The five prefectures and prefectural cities of Haixi, Shannan, Yushu, Nyingchi and Lhasa showed a downward trend, while Huangnan and Xining displayed an upward trend. The remaining cities (and prefectures) were relatively stable. Among them, Huangnan and Xining had the highest growth rates of the ecological structure subsystems. Huangnan benefited from an increase in its landscape diversity indicator, and Xining benefited from a decline in its landscape fragmentation indicator, suggesting that both places have begun to attach importance to integrating uses of land resources, diversifying their regional landscapes and reducing the number of fragmented patches of land, which has protected the environment and improved the efficiency of urbanization.
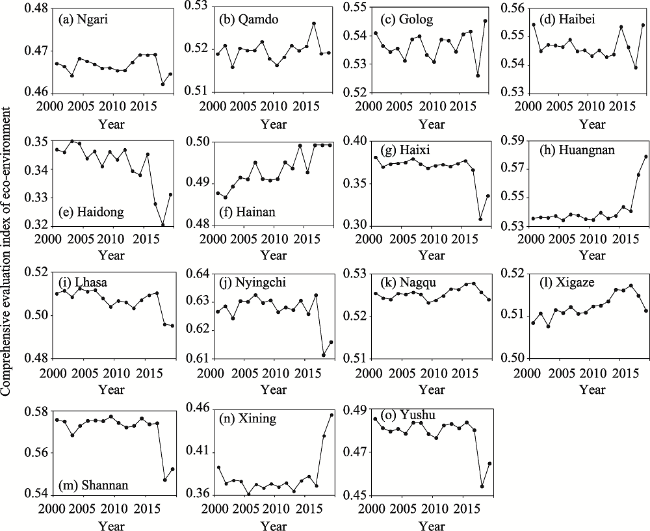
Figure 6 Temporal changes in the environment comprehensive evaluation index of each prefecture-level city in the Tibetan Plateau from 2000 to 2015
To visually display the spatiotemporal evolution of the eco-environment of the Tibetan Plateau, spatial visualization analysis of eco-environment evaluation index for the plateau region was carried out. Based on the eco-environment comprehensive evaluation index values of each prefectural unit, and in order to highlight differences to the greatest extent, eco-environment types are divided into four groups: optimal environment (>0.6), preferential environment (0.5-0.6), moderate environment (0.4-0.5) and inferior environment (≤0.4).
Figure 7 shows that the spatial pattern of the environment comprehensive evaluation index was relatively stable and that the low-value areas are mainly in Qinghai and the high-value areas are mainly in Tibet. The spatial pattern of eco-environment was stable between 2000 and 2005. Tibet was more balanced, and the overall level was that of a preferential environment. Nyingchi was an optimal environment area, and Ngari was a moderate environment area. Xining, Haidong, and Haixi in Qinghai Province were all inferior environment areas in 2000, 2005 and 2015. The three were also core areas of urbanization as well as major industrial cities in Qinghai. The adjacent non-industrial area of Hainan has been a moderate environment area for a long time, indicating that Qinghai’s model of relying on industry to drive urbanization has significant negative effects and that it impacts surrounding areas. In 2010, Xining and Haixi became moderate eco-environment areas. In 2015, Lhasa in Tibet changed from a preferential environment area to a moderate environment area. Lhasa, as the capital of Tibet, has continued to promote urbanization, but its extensive economic growth has resulted in low efficiency of resource utilization and serious environmental pollution, which resulted in a fall in its environment evaluation index.
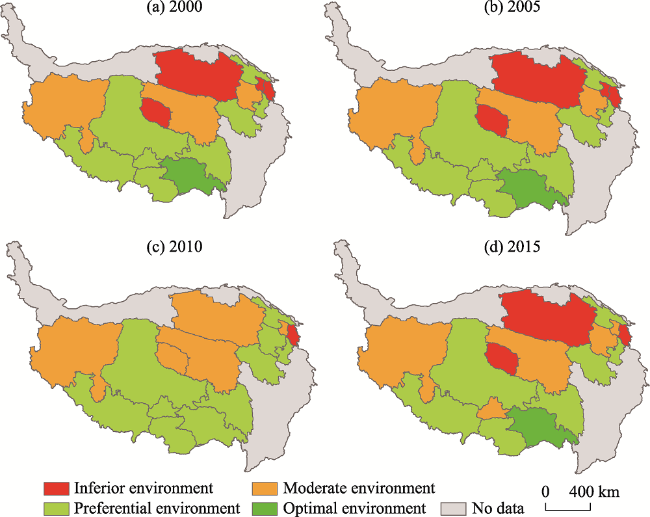
Figure 7 Spatial evolution of eco-environment evaluation indexes for each prefecture-level city in the Tibetan Plateau from 2000 to 2015

3.2 Analysis of urbanization and eco-environment coupling coordination degree at different scales

3.2.1 The Tibetan Plateau and provincial scales
As can be seen from Figure 8, the Tibetan Plateau and the Tibet Autonomous Region’s urbanization and eco-environment coupling coordination degree shows an upward trend between 2000 and 2015 and that the two had similar values. Qinghai displays a rising-falling-rising trend. It shows that the overall development of the Tibetan Plateau is still within the tolerance of eco-environment and that, overall, urbanization and eco-environment are in harmony. However, the level of coordinated development between urbanization and the environment within the region is not balanced. For example, the level of urbanization in Tibet is low. It has not yet reached its ecological carrying capacity threshold, and its degree of coupling is low. Qinghai has promoted urbanization, but development of its environment is lagging, so the degree of coupling coordination first rose and then fell. Since the 2011 “The Plan for Regional Ecological Construction and Environmental Protection on the Tibetan Plateau (2011-2030)” was promulgated and implemented, Qinghai Province has launched a series of environmental protection projects, causing the degree of coupling coordination to rebound.
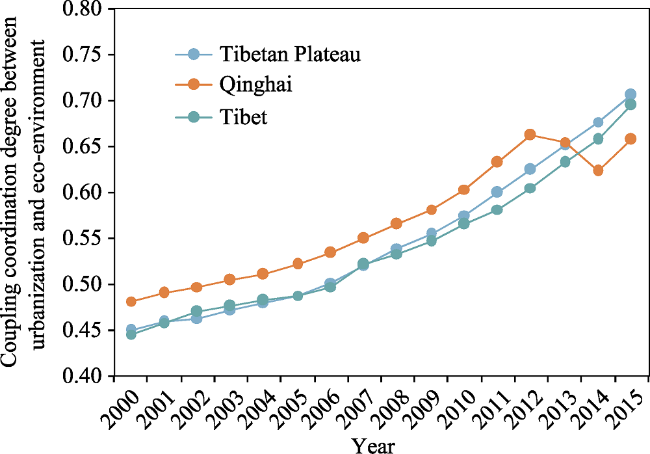
Figure 8 Temporal changes in the coupling coordination of the Tibetan Plateau, Qinghai Province and the Tibet Autonomous Region from 2000 to 2015
3.2.2 The prefectural scale
As can be seen from Figure 9, the degree of coordination between urbanization and eco-environment systems in the Tibetan Plateau region is clearly heterogeneous. The degree of coordination steadily increased for most cities and prefectures, albeit those in Qinghai fluctuated more notably. The reason for this is that most cities and prefectures on the Tibetan Plateau had a high environmental starting point and remained stable for many years. In addition, their level of urbanization has continued to increase, so the degree of coupling has risen accordingly. Haidong, Haixi and Lhasa have shown a relatively unusual upward-then-downward trend, indicating that the urbanization of the three places has reached the environmental carrying capacity threshold and that there are issues with their current development model. Of these places, Haixi has an industry-driven urbanization model, and it has more prominent structural pollution. It still has some way to go to be fully compliant with regulations on the treatment of industrial pollution sources, but the treatment of pollution sources in some areas has improved the environment. The overall trend of environmental pollution, however, has not been fundamentally reversed. Haixi’s urbanization has deviated from the environmental development trend, so its degree of coupling has decreased.
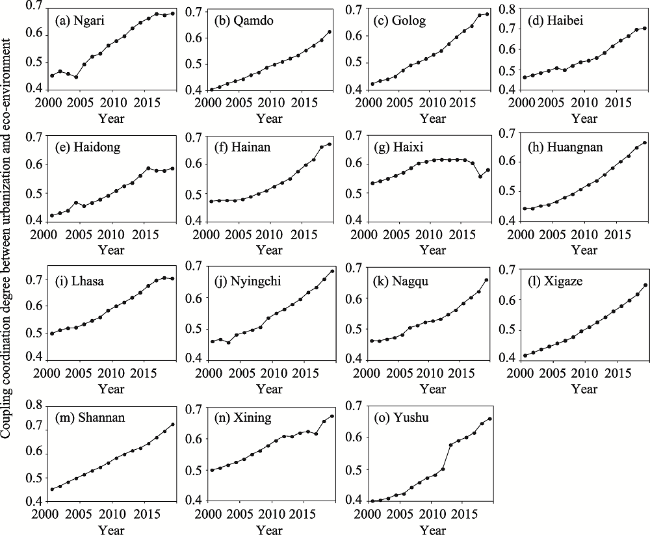
Figure 9 Temporal changes in coupling coordination degree of prefecture-level cities in the Tibetan Plateau from 2000 to 2015
The environment evaluation index of Haidong is low, as it suffers from many ecological problems such as drought, soil erosion and sparse vegetation. Its eco-environment is highly fragile, its carrying capacity is weak, and its urbanization development is limited. It needs to take more targeted measures to rectify these issues. While protecting the local environment, it needs to take advantage of its resources and carry out urbanization based on its own unique characteristics. As the provincial capital of Tibet, urbanization occurred early and quickly in Lhasa. Following the proposal of major function-oriented zones in China, key eco-function zones in the Tibet Autonomous Region were given effective protection and the impact of urbanization was curtailed, so the decline in the coupling degree was minor.

3.3 Identifying types of reciprocal influences between urbanization and eco-environment at different scales

3.3.1 Tibetan Plateau and provincial scales
The overall degree of coordination between urbanization and eco-environment on the Tibetan Plateau has continually increased over time, but the region has remained in the lagging urbanization stage for a long time. In 2014, there was a breakthrough when it became synchronized (Table 5). There are considerable differences between Qinghai and Tibet, however. Qinghai entered the stage of coordinated development earlier than Tibet, and it has gradually transformed from the classification of lagging urbanization to lagging environment. Tibet has always been in the lagging urbanization classification. The synchronization of urbanization and the environment on the Tibetan Plateau is the outcome of averaging the results for Qinghai and Tibet. Qinghai’s environment continues to decline, and the urbanization index has caught up with and gradually exceeded the environment index. The two have gone from being decoupled to being coupled, but they may become decoupled again in the future. The environmental trend in Tibet has been of stability, and its urbanization has not yet reached the environmental carrying capacity threshold. The key to future coupling coordination is still urbanization. The main reason for this is the slow pace of urbanization in Tibet due to its poor transportation and weak external economic relations. Most of Tibet belongs to the Qinghai-Tibet Plateau ecological barrier zone or prohibited development zones, which means that the environment is the focus and urbanization is restricted.
Table 5 Coupling classification results for urbanization and eco-environment in the Tibetan Plateau, Qinghai Province and the Tibet Autonomous Region (Tibet)
2000 2001 2002 2003 2004 2005 2006 2007
Tibetan Plateau Ⅱ-3 Ⅱ-3 Ⅱ-3 Ⅱ-3 Ⅱ-3 Ⅱ-3 Ⅲ-3 Ⅲ-3
Qinghai Ⅱ-3 Ⅱ-3 Ⅱ-3 Ⅲ-3 Ⅲ-3 Ⅲ-3 Ⅲ-3 Ⅲ-3
Tibet Ⅱ-3 Ⅱ-3 Ⅱ-3 Ⅱ-3 Ⅱ-3 Ⅱ-3 Ⅱ-3 Ⅲ-3
2008 2009 2010 2011 2012 2013 2014 2015
Tibetan Plateau Ⅲ-3 Ⅲ-3 Ⅲ-3 Ⅲ-3 Ⅳ-3 Ⅳ-3 Ⅳ-2 Ⅳ-2
Qinghai Ⅲ-3 Ⅲ-3 Ⅳ-2 Ⅳ-2 Ⅳ-2 Ⅳ-2 Ⅳ-1 Ⅳ-1
Tibet Ⅲ-3 Ⅲ-3 Ⅲ-3 Ⅲ-3 Ⅳ-3 Ⅳ-3 Ⅳ-3 Ⅳ-3
3.3.2 The prefectural scale
As shown in Figure 10, the overall trend of coupling coordination between urbanization and the environment in 15 prefecture-level locations on the Qinghai-Tibet Plateau was good, with most cities changing from transitional to coordinated development, but the basic types were different. Lhasa and Xining were the lagging environment type; Huangnan and Nyingchi were the lagging urbanization type; and the rest were the synchronized urbanization and environment type. With the exception of Huangnan and Nyingchi, which still have scope for urbanization, and Lhasa and Xining, where the environment began to lag and environmental problems began to emerge, the remaining cities or prefectures were in the synchronized stage, with similar development of urbanization and the environment. Determining whether this state of synchronization is optimal requires further research. In addition, in 2015, only Qamdo, Haidong and Haixi still belonged to the category of scarcely coordinated development. Of them, Qamdo had lagging urbanization and a good eco-environment, but its level of regional urbanization was growing slowly, which resulted in a low degree of coupling. Haixi and Haidong, meanwhile, had lagging eco-environments. Haixi changed to the coordinated development category in 2006, and then fell into the scarcely coordinated development category, and changed from the synchronized urbanization and eco-environment type to the lagging environment type. Haixi’s urbanization process has been greatly affected, indicating that its development in the period 2006-2015 was not coordinated. Haidong is in the zone between the Loess Plateau and the Tibetan Plateau, which suffers from serious soil erosion. As a result, its eco-environment evaluation index has always been at a low level, which has directly restricted the development of its regional urbanization.
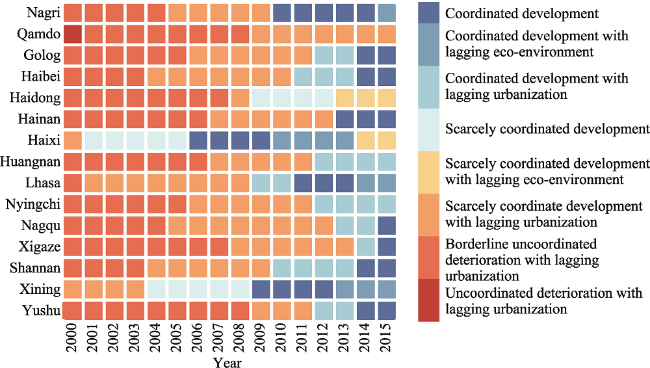
Figure 10 Urbanization and environment coupling classifications for prefecture-level cities on the Tibetan Plateau

3.4 Decoupling paths of the reciprocally influential relationship between urbanization and eco-environment at different scales

3.4.1 The Tibetan Plateau and the provincial scales
Table 6 shows that the decoupling of urbanization and eco-environment indexes in the Tibetan Plateau region from 2000 to 2015 involved three states: strong decoupling, weak decoupling and expanding connection. It shows that although the degree of coupling coordination between urbanization and eco-environment on the Tibetan Plateau kept increasing, this was the result of the eco-environment index continuously falling and the urbanization index continuously rising. This relationship was constantly strengthened from 2000 to 2014. This also shows that urbanization on the Tibetan Plateau has had an impact on the eco-environment. Although the limit of the ecological carrying capacity has not yet been reached and urbanization still has room for growth, the negative effects of urbanization also require attention.
Table 6 The environment index growth rate, urbanization index growth rate, and their decoupling relationship for the Tibetan Plateau
Year ΔE ΔU DI Degree of Decoupling
2001 -0.02 0.01 -0.35 Strong decoupling
2002 0.00 0.01 -0.06 Weak decoupling
2003 0.00 0.01 -0.02 Weak decoupling
2004 -0.02 0.01 -0.44 Strong decoupling
2005 0.02 0.01 0.38 Weak decoupling
2006 0.00 0.02 -0.06 Weak decoupling
2007 0.00 0.02 -0.05 Weak decoupling
2008 -0.01 0.02 -0.09 Strong decoupling
2009 0.00 0.02 -0.04 Weak decoupling
2010 -0.02 0.03 -0.23 Strong decoupling
2011 0.00 0.03 0.03 Weak decoupling
2012 -0.01 0.04 -0.08 Strong decoupling
2013 -0.03 0.04 -0.39 Strong decoupling
2014 -0.04 0.04 -0.69 Strong decoupling
2015 0.05 0.04 0.86 Expanding connection
The decoupling status of the urbanization index and the eco-environment index in Qinghai from 2001 to 2015 fluctuated strongly (Table 7). From 2001 to 2014, the decoupling status flipped back and forth between strong decoupling and weak decoupling, with a high strong decoupling index. In 2015, it changed to an expanding negative decoupling status. This shows that the negative effects of Qinghai’s urbanization have been significant, and it is in an unsustainable and temporary state of coordination. Qinghai needs to strengthen protection of the environment and should not blindly pursue urbanization growth.
Table 7 Eco-environment index growth rate, urbanization index growth rate and the decoupling relationship of the Tibet Autonomous Region and Qinghai Province
Year Area ΔE ΔU DI Status Area ΔE ΔU DI Status
2001 Qinghai -0.0214 0.0134 -0.5817 Strong decoupling Tibet -0.0009 0.0172 -0.0118 Strong decoupling
2002 Qinghai 0.0041 0.0095 0.1747 Weak
decoupling
Tibet -0.0073 0.0144 -0.1317 Strong decoupling
2003 Qinghai -0.0024 0.0101 -0.0997 Strong decoupling Tibet 0.0041 0.0100 0.1176 Weak
decoupling
2004 Qinghai -0.0234 0.0089 -1.1814 Strong decoupling Tibet 0.0009 0.0094 0.0275 Weak
decoupling
2005 Qinghai 0.0243 0.0152 0.7844 Weak
decoupling
Tibet 0.0003 0.0072 0.0142 Weak
decoupling
2006 Qinghai -0.0049 0.0178 -0.1381 Strong decoupling Tibet -0.0006 0.0129 -0.0159 Strong decoupling
2007 Qinghai -0.0054 0.0214 -0.1362 Strong decoupling Tibet -0.0016 0.0330 -0.0167 Strong decoupling
2008 Qinghai -0.0049 0.0231 -0.1254 Strong decoupling Tibet -0.0018 0.0167 -0.0437 Strong decoupling
2009 Qinghai 0.0013 0.0229 0.0356 Weak
decoupling
Tibet -0.0017 0.0188 -0.0383 Strong decoupling
2010 Qinghai -0.0146 0.0319 -0.3197 Strong decoupling Tibet -0.0009 0.0251 -0.0168 Strong decoupling
2011 Qinghai 0.0034 0.0408 0.0662 Weak
decoupling
Tibet -0.0004 0.0238 -0.0094 Strong decoupling
2012 Qinghai -0.0014 0.0421 -0.0280 Strong decoupling Tibet -0.0028 0.0322 -0.0481 Strong decoupling
2013 Qinghai -0.0260 0.0400 -0.6294 Strong decoupling Tibet -0.0029 0.0374 -0.0463 Strong decoupling
2014 Qinghai -0.0454 0.0414 -1.2288 Strong decoupling Tibet -0.0096 0.0345 -0.1862 Strong decoupling
2015 Qinghai 0.0500 0.0404 1.6851 Expanding negative decoupling Tibet 0.0053 0.0536 0.0730 Weak
decoupling
The Tibet Autonomous Region was similar to Qinghai, but it displayed less volatility. It maintained strong decoupling from 2006 to 2014, but the decoupling index was low. Although the development trends of urbanization and eco-environment in Tibet have differed, the urbanization process does not currently exert great pressure on eco-environment, so there is potential to develop urbanization further. The urbanization process should, therefore, be promoted, but steady urbanization plans must be formulated.
3.4.2 The prefectural scale
The decoupling status of the urbanization index and the eco-environment index of the Tibetan Plateau has consisted primarily of strong decoupling and weak decoupling (Figure 11). Specifically, it has consisted primarily of either positive growth in the urbanization index and negative growth in the eco-environment index, or the growth rate of the urbanization index being higher than the growth rate of the eco-environment index. This shows that the current urbanization process of prefecture-level units on the Tibetan Plateau is putting pressure on the regional environment, and the coupling degree of the two systems is increasing. The decoupling index, however, shows that there is a negative interaction between urbanization and the eco-environment, and this negative effect is fluctuating over time.
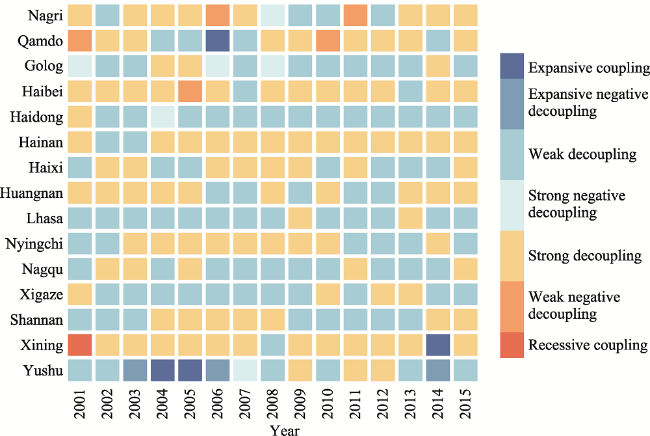
Figure 11 The decoupling relationship between urbanization and eco-environment indexes of prefecture-level units in the Tibetan Plateau region
With reference to the meaning of strong decoupling and weak decoupling, based on a comparison of the instances of strong decoupling and instances of weak decoupling from 2001 to 2015 in prefecture-level units, areas can be divided into three groups based on the following classifications: (1) Active urbanization: places with fewer instances of strong decoupling than weak decoupling, a higher urbanization index growth rate than eco-environment index growth rate, and a gradually improving environment, such as Qamdo, Haixi, Nyingchi, Xigaze and Shannan; (2) Neutral urbanization: places with the equal instances of strong decoupling and of weak decoupling and synchronized environments, such as Ngari and Nagqu; (3) Passive urbanization: places with more instances of strong decoupling than weak decoupling, with mainly positive growth of the urbanization index and negative growth of the eco-environment index, and a lagging environment, such as Golong, Haibei, Haidong, Hainan, Huangnan, Lhasa, Xining and Yushu.
Most prefecture-level units in Tibet fell under the active urbanization category, while prefecture-level units in Qinghai mostly belonged to the passive urbanization category, having displayed strong decoupling for a long time. However, this classification result is based only on a comparison of the instances of strong and weak decoupling, with no reference to comparisons of decoupling intensity, and there are special circumstances in the classification results. Although Haixi is classified as having active urbanization, the intensity of its strong decoupling is much higher than the intensity of its weak decoupling. The absolute value of its weak decoupling index was only 0.2, but the absolute value of its strong decoupling index was as high as 3, which corresponds to the small increase and then large decrease in its eco-environment index. Huangnan was classified as having passive urbanization, but the intensity of its strong decoupling was low and the negative growth rate of its eco-environment was low, with its highest inter-annual decline value being only 0.003 and its highest growth value being 0.025.
Combining the changing trends in coupling and decoupling, it can be seen that although Golog, Haibei, Hainan and Yushu were in the coordinated development category and had synchronized urbanization and environments, they were classified as having passive urbanization in terms of their decoupling category. This indicates that the coordinated status of these four cities and prefectures was short-lived and unsustainable. It was only their urbanization and environment evaluation index values that were synchronized, but their actual growth trends differed.

3.5 Future trends in the interactively influential relationship between urbanization and eco-environment in the Tibetan Plateau region

The data on the coupling coordination degree of urbanization and eco-environment of each unit in the Tibetan Plateau region from 2000 to 2015 was applied to the Gray system GM (1, 1) model, and the numerical value of the coupling coordination degree obtained from the simulation for 2000-2015 is compared with the actual value to calculate the average relative error, relative accuracy and the c-statistic value. If the c-statistic value is less than 0.35 and the relative accuracy is greater than 95%, the model prediction level is excellent. The results are shown in Table 8. The c-statistic value (residual variance) of each predicted unit is less than 0.35, and the average relative error between all calculated values and actual values is in the range of 0.55%-3.41%, so future trend predictions and analysis can be performed. The forecast period is 2016-2025, and the forecast is premised on there being no major fluctuations over the next decade.
Table 8 Prediction accuracy of future changes in the coupling coordination degree between urbanization and eco-environment for prefecture-level units in the Tibetan Plateau region
Forecasted unit Tibetan
Plateau
Qinghai Tibet Ngari Qamdo Golog Haibei Haidong Hainan
Average relative error (%) 1.76 1.97 1.97 2.57 0.83 0.94 2.32 1.56 2.47
Relative accuracy (%) 98.24 98.02 98.04 97.42 99.16 99.06 97.67 98.44 97.53
c-statistic value 0.07 0.17 0.09 0.12 0.06 0.06 0.08 0.13 0.14
Forecasted unit Haixi Huangnan Lhasa Nyingchi Nagqu Xigaze Shannan Xining Yushu
Average relative error (%) 3.41 1.22 1.07 1.05 1.42 0.90 0.55 1.02 2.54
Relative accuracy (%) 96.58 98.77 98.93 98.95 98.57 99.10 99.45 98.98 97.47
c-statistic value 0.43 0.06 0.07 0.07 0.12 0.05 0.04 0.12 0.10
According to the results of the GM (1, 1) model (Table 9), there is a clear coupling coordination trend at various scales for the Tibetan Plateau. In 2020, only Qamdo, Haidong and Haixi have values below 0.7, and only Haixi will be below that level in 2025. Given the plans for the Lanxi Urban Agglomeration, Xining Metropolitan Area and Lhasa Metropolitan Area, the urbanization level of prefecture-level units in the Tibetan Plateau region is set to increase further in the future, which will make environmental constraints more prominent. Judging from the forecast results, Haixi needs to implement measures to promote an increase in the level and quality of its urbanization process, to improve the quality and efficiency of its urbanization. However, this result only predicts overall changes in the degree of coupling coordination, and it is necessary to consider trends in urbanization and eco-environment indexes to adjust development strategies in time.
Table 9 Predictions of future changes in the coupling coordination degree between urbanization and eco-environment for prefecture-level units in the Tibetan Plateau region
Predicted unit Tibetan Plateau Qinghai Tibet Ngari Qamdo Golog Haibei Haidong Hainan
2020 predicted value 0.81 0.76 0.78 0.84 0.69 0.81 0.81 0.68 0.75
2025 predicted value 0.96 0.85 0.90 0.98 0.80 0.96 0.95 0.76 0.86
Predicted unit Haixi Huangnan Lhasa Nyingchi Nagqu Xigaze Shannan Xining Yushu
2020 predicted value 0.63 0.88 0.82 0.78 0.72 0.74 0.83 0.73 0.81
2025 predicted value 0.64 0.90 0.93 0.90 0..81 0.86 0.97 0.81 0.99

4 Conclusions

This study attempted to construct a complete analytical model of the reciprocal influences between urbanization and eco-environment that can achieve the whole process of analyzing evaluation indexes, quantifying coupling coordination, identifying coupling types, exploring decoupling paths and predicting future trends. By analyzing and comparing multiple scales (the Tibetan Plateau region, provinces and prefecture-level units), we were able to elucidate differences between scales, identify problem areas and propose targeted improvement measures. The main conclusions are as follows:
First, the urbanization comprehensive evaluation indexes for different scales of the Tibetan Plateau displayed an upward trend, and the overall urbanization index for Qinghai was higher than for Tibet, with extremely high growth rates in Haixi and Xining, while the urbanization level in Tibet was low, but Lhasa was the growth point. The eco-environment index trends differed, with Qinghai displaying a downward trend, while Tibet was stable. In addition, the environment indexes of prefecture-level units were stratified, with the highest being Nyingchi.
Second, the overall coupling coordination degree for urbanization and eco-environment at different scales in the Tibetan Plateau region showed an upward trend. Haixi, Haidong and Lhasa displayed an increasing-then-decreasing trend. Looking at types of coordination, the uncoordinated deterioration category and borderline uncoordinated deterioration category shifted to the coordinated development category. Only Qamdo, Haidong and Haixi prefectures were in the scarcely coordinated development category. Improving the quality of urbanization development should be the focus of urbanization development in the near term.
Third, urbanization and eco-environment indexes primarily fluctuated between strong decoupling and weak decoupling, indicating a negative effect between urbanization and the environment at the different scales and that there is a problem with negative urbanization development. Actively promoting urbanization while improving its quality is both necessary and urgent to create a positive and harmonious relationship between urbanization and eco-environment.
Fourth, using predictive analysis, we found that the degree of system coupling coordination of each prefecture-level unit in the Tibetan Plateau region will steadily increase in the next 10 years, indicating that the relationship between urbanization and the environment in the region will gradually become more coordinated in the future. However, there will be discrepancies in the growth rates of various areas, with Haixi being the slowest. It is necessary to make up for shortcomings by taking measures as soon as possible to promote the coordinated development of urbanization and the environment.
[1]
Cao S S, Wang Y H, Duan F Z et al., 2016. Coupling between ecological vulnerability and economic poverty in contiguous destitute areas, China: Empirical analysis of 714 poverty-stricken countries. Chinese Journal of Applied Ecology, 27(8):2614-2622. (in Chinese)

[2]
Chen H, Zhu Q A, Peng C H et al., 2013. The impacts of climate change and human activities on biogeochemical cycles on the Qinghai-Tibetan Plateau. Global Chang Biology, 19(10):2940-2955.

DOI

[3]
Cui X F, Graf H, 2009. Recent land cover changes on the Tibetan Plateau: A review. Climatic Change, 94(1/2):47-61.

DOI

[4]
Cui X F, Graf H, Langmann B et al., 2006. Climate impacts of anthropogenic land use changes on the Tibetan Plateau. Global and Planetary Change, 54(1/2):33-56.

DOI

[5]
Fan J, Xu Y, Wang C S et al., 2015. The effects of human activities on the ecological environment of Tibet over the past half century. Chinese Science Bulletin, 60(32):3057-3066. (in Chinese)

[6]
Fang C L, Li G D, 2015. Particularities, gradual patterns and countermeasures of new-type urbanization in Tibet, China. Bulletin of Chinese Academy of Sciences, 30(3):294-305. (in Chinese)

[7]
Ge J, You Q L, Zhang Y Q, 2019. Effect of Tibetan Plateau heating on summer extreme precipitation in eastern China. Atmospheric Research, 218:364-371.

DOI

[8]
Guo S S, Chen M X, Liu H, 2018. Coupling procedure and decoupling analysis of urbanization and resource environment: The study of Beijing. Geographical Research, 37(8):1599-1608. (in Chinese)

[9]
Kang S C, Zhang Q G, Qian Y et al., 2019. Linking atmospheric pollution to cryospheric change in the Third Pole region: Current progress and future prospects. National Science Review, 6(4):796-809.

DOI

[10]
Lamsal P, Kumar L, Shabani F et al., 2017. The greening of the Himalayas and Tibetan Plateau under climate change. Global and Planetary Change, 159:77-92.

DOI

[11]
Li S C, Wu J S, Gong J et al., 2018a. Human footprint in Tibet: Assessing the spatial layout and effectiveness of nature reserves. Science of the Total Environment, 621:18-29.

DOI

[12]
Li S C, Zhang Y L, Wang Z F et al., 2018b. Mapping human influence intensity in the Tibetan Plateau for conservation of ecological service functions. Ecosystem Services, 30:276-286.

DOI

[13]
Li T, Wang J, Zhang Q G et al., 2019. Spatiotemporal characteristics of an ecological footprint, decoupling effect tendency, and grey prediction in Hefei city. Acta Ecologica Sinica, 39(5):1735-1747. (in Chinese)

[14]
Liang L W, Wang Z B, Fang C L et al., 2019. Spatiotemporal differentiation and coordinated development pattern of urbanization and the ecological environment of the Beijing-Tianjin-Hebei urban agglomeration. Acta Ecologica Sinica, 39(4):1212-1225. (in Chinese)

[15]
Liao Z B, 1999. Quantitative judgement and classification system for coordinated development of environment and economy: A case study of the city group in the Pearl River Delta. Tropical Geography, 2:76-82. (in Chinese)

[16]
Liu J, Richard I, Marc W et al., 2018. Protect Third Pole’s fragile ecosystem. Science, 362(6421):1368.

DOI PMID

[17]
Liu T D, 2009. Study on sustainable development in Qinghai-Tibet Plateau[D]. Tianjin: Tianjin University. (in Chinese)

[18]
Lu C X, Xie G D, Xiao Y et al., 2004. Ecosystem diversity and economic valuation of Qinghai-Tibet Plateau. Acta Ecologica Sinica, 24(12):2749-2755, 3011. (in Chinese)

[19]
Ma Y M, Ma W Q, Zhong L et al., 2017. Monitoring and modeling the Tibetan Plateau’s climate system and its impact on East Asia. Scientific Reports, 7:44574.

DOI PMID

[20]
Niu Yafei, 1999. The study of environment in the Plateau of Qing-Tibet. Progress in Geography, 18(2):69-77. (in Chinese)

[21]
Tang L, Li J P, Yu L A et al., 2010. Quantitative evaluation methodology for system coordination development based on distance coordination degree model. Systems Engineering: Theory & Practice, 30(4):594-602. (in Chinese)

[22]
Tapio P, 2005. Towards a theory of decoupling: Degrees of decoupling in the EU and the case of road traffic in Finland between 1970 and 2001. Transport Policy, 12(2):137-151.

DOI

[23]
The State Council Information Office of the People’s Republic of China (SCIO), 2018. Ecological Progress on the Tibetan Plateau. (in Chinese)

[24]
Wang X H, Zheng D, Shen Y C, 2008. Land use change and its driving forces on the Tibetan Plateau during 1990-2000. Catena, 72(1):56-66.

DOI

[25]
Wang Y, Li G D, 2016. Mapping urban CO2 emissions using DMSP/OLS ‘city lights’ satellite data in China. Environment and Planning A: Economy and Space, 49(2):248-251.

DOI

[26]
Wang Z H, 2015. Research on the coupling of ecological construction and economic development in the minority areas of our country[D]. Harbin: Northeast Forestry University. (in Chinese)

[27]
Xie G D, Zhang C X, Zhang L M et al., 2015. Improvement of the evaluation method for ecosystem service value based on per unit area. Journal of Natural Resources, 30(8):1243-1254. (in Chinese)

[28]
Xue B, Chen X P, Wu J H et al., 2007. A study on the coupling relation and evolvement of the population-resources-environment in Qinghai Province. Journal of Lanzhou University (Natural Sciences), 1:33-36. (in Chinese)

[29]
Yang H R, 2013. Study on the coupling of eco-economic system in Qinghai Province. Qinghai Social Sciences, (5): 59-63, 68. (in Chinese)

[30]
Yang K, Wu H, Qin J et al., 2014. Recent climate changes over the Tibetan Plateau and their impacts on energy and water cycle: A review. Global and Planetary Change, 112:79-91.

DOI

[31]
Yao T D, Zhu L P, 2006. The response of environmental changes on Tibetan Plateau to global changes and adaptation strategy. Advances in Earth Science, 21(5):459-464. (in Chinese)

[32]
Yuan F D, Zhang X, Wei Y Q, 2018. Study on ecological environment vulnerability assessment in the ecological barrier area of Qinghai-Tibet Plateau. Geospatial Information, 16(4):67-69, 10. (in Chinese)

[33]
Zhang M X, Wang D X, 2018. Measurement of coupling between urbanization and ecological environment in Qinghai Province. Qinghai Social Sciences, (3):59-65. (in Chinese)

[34]
Zhao Y L, Zhang L J, 1998. A study on index and method of quantitative assessment of fragile environment. Progress in Geography, 17(1):67-72. (in Chinese)

DOI

[35]
Zhou C, Feng X G, Tang R, 2016. Analysis and forecast of coupling coordination development among the regional economy-ecological environment-tourism industry: A case study of provinces along the Yangtze economic zone. Economic Geography, 36(3):186-193. (in Chinese)

Outlines

/