
Journal of Geographical Sciences >
Integrating the ecosystem service in sustainable plateau spatial planning: A case study of the Yarlung Zangbo River Basin
|
Che Lei (1993-), PhD, specialized in ecological management and regional planning. E-mail:Cheleigeo@126.com |
Received date: 2020-03-18
Accepted date: 2020-08-13
Online published: 2021-04-25
Supported by
Strategic Priority Research Program of the Chinese Academy of Sciences(XDA20040401)
National Natural Science Foundation of China(41961027)
National Natural Science Foundation of China(41701173)
China Postdoctoral Science Foundation(2016M600121)
Copyright
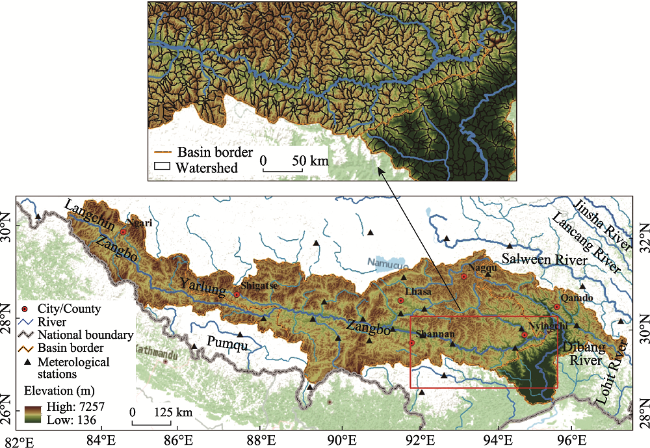
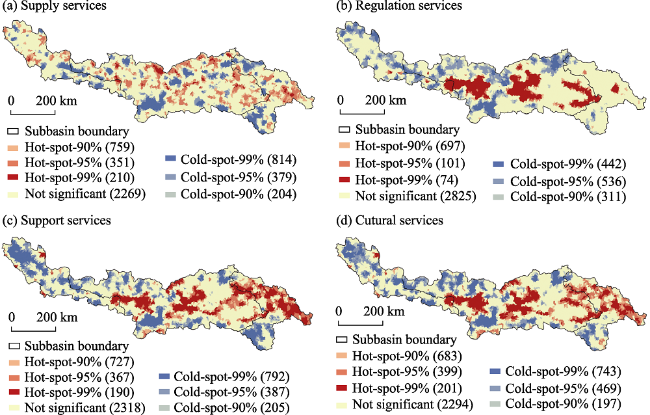
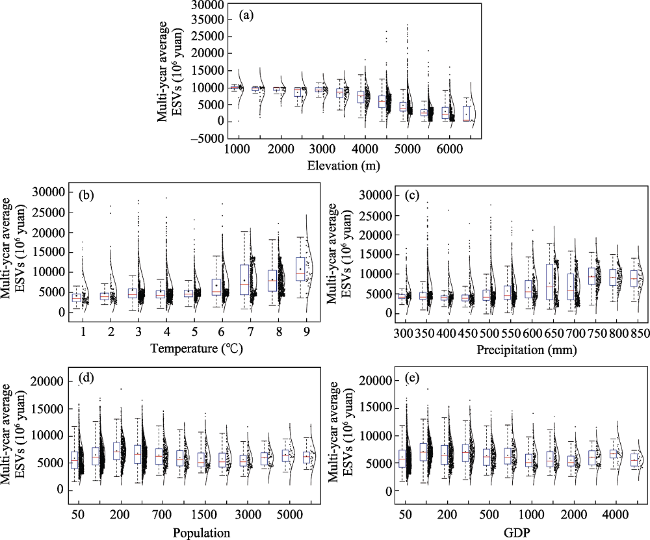
The Yarlung Zangbo River Basin (YZRB) is a key ecological protection area on the Qinghai-Tibet Plateau (QTP). Determination of the ecosystem service values (ESVs) can help recognize the benefits of sustainable management. It is gradually becoming the main path that constructs plateau spatial planning of integrating ecological protection, and achieves global sustainable development goals (SDGs) in China. In this paper, the spatio-temporal dynamic evolutions of the ESVs were estimated on the multiple scales of “basin, subbasin and watershed” from 1980 to 2015. The main factors influencing ESVs were explored in terms of physical geography, human activities, and climate change. It had been proposed that sustainable spatial planning including ecological protection, basin management, and regional development was urgent to set up. Our results show that the increase in wetland and forest and results in an increase of 9.4% in the ESVs. Attention should be paid to the reduction of water and grassland. Water conservation (WC), waste treatment (WT), and soil formation and conservation (SFC) are the most important ecosystem services in the YZRB. At present, the primary problem is to solve the ESVs decreasing caused by glacier melting, grassland degradation, and desertification in the upper reaches region. The middle reaches should raise the level of supply services. Regulation services should be increased in the lower reaches region on the premise of protecting vegetation. The ESVs in adjacent watersheds are interrelated and the phenomenon of “high agglomeration and low agglomeration” is obvious, existing hot-spots and cold-spots of ESVs. Additionally, when the altitude is 4500-5500 m, the temperature is 3-8°C, and the annual precipitation is 350-650 mm, ESVs could reach its maximum. A framework of sustainable plateau spatial planning could provide references to delimit the ecological protection red line, key ecological function zone, and natural resource asset accounting on the QTP.
CHE Lei , ZHOU Liang , XU Jiangang . Integrating the ecosystem service in sustainable plateau spatial planning: A case study of the Yarlung Zangbo River Basin[J]. Journal of Geographical Sciences, 2021 , 31(2) : 281 -297 . DOI: 10.1007/s11442-021-1847-7
Figure 1 Map of the Yarlung Zangbo River Basin |
Table 1 Single-unit ecosystem service values on the Qinghai-Tibet Plateau (yuan/ha) |
| Type | Subtype | Forest land | Grassland | Cropland | Wetland | Water | Unused land |
|---|---|---|---|---|---|---|---|
| Supply services | FP | 62.9 | 188.6 | 628.6 | 188.6 | 62.9 | 6.3 |
| RMP | 1634.4 | 31.4 | 6.3 | 44 | 6.3 | 0 | |
| WC | 2011.5 | 502.9 | 377.2 | 9743.3 | 12823.4 | 18.9 | |
| Subtotal | 3708.8 | 722.9 | 1012.1 | 9975.9 | 12892.6 | 25.2 | |
| Regulation services | GR | 2200.1 | 502.9 | 314.3 | 1131.5 | 0 | 0 |
| CR | 1697.2 | 565.7 | 559.5 | 10 749.1 | 289.2 | 0 | |
| Subtotal | 3897.3 | 1068.6 | 873.8 | 11 880.6 | 289.2 | 0 | |
| Support services | SFC | 2451.5 | 1225.8 | 917.8 | 1074.9 | 6.3 | 12.6 |
| WT | 823.5 | 823.5 | 1030.9 | 11428 | 11440.5 | 6.3 | |
| BP | 2049.2 | 685.2 | 446.3 | 1571.5 | 1565.2 | 213.7 | |
| Subtotal | 5324.2 | 2734.5 | 2395 | 14074.4 | 13012 | 232.6 | |
| Cultural services | EC | 804.6 | 25.1 | 6.3 | 3488.7 | 2728.1 | 6.3 |
| Total ESVs | Total | 13734.9 | 4551.1 | 4287.2 | 39419.6 | 28921.9 | 264.1 |
Abbreviations: FP: food production; RMP: raw material production; WC: water conservation; GR: gas regulation; CR: climate regulation; SFC: soil formation and conservation; WT: waste treatment; BP: biodiversity protection; EC: entertainment and culture. |
Table 2 Changes in ecosystem service values in the Yarlung Zangbo River Basin from 1980 to 2015 |
| Land-use type | ESVs (108 yuan) | Dynamic degree (%) | Variation trend | ||||||
|---|---|---|---|---|---|---|---|---|---|
| 1980 | 1995 | 2005 | 2015 | 1980-1995 | 1995-2005 | 2005-2015 | 1980-2015 | ||
| Cropland | 145.1 | 100.5 | 144.6 | 174.3 | 2.0 | 4.4 | 2.1 | 0.6 |  |
| Forest land | 4872.7 | 5589.0 | 4890.7 | 7226.9 | 1.0 | 1.2 | 4.8 | 1.4 |  |
| Grassland | 7249.1 | 6658.6 | 7243.7 | 5607.3 | 0.5 | 0.9 | 2.3 | 0.6 |  |
| Water | 3073.1 | 3220.0 | 3083.6 | 2133.3 | 0.3 | 0.4 | 3.1 | 0.9 |  |
| Wetland | 495.1 | 495.1 | 464.9 | 2154.4 | 0.0 | 0.6 | 36.3 | 9.6 |  |
| Unused land | 122.2 | 145.3 | 122.2 | 167.7 | 1.3 | 1.6 | 3.7 | 1.1 |  |
| Total ESV | 15957.3 | 16208.4 | 15949.8 | 17463.9 | 0.1 | 0.2 | 0.9 | 0.3 |  |
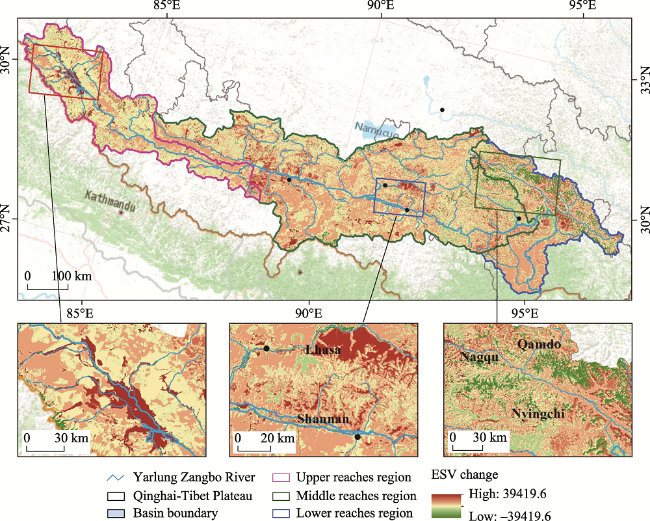
Figure 2 Spatial distribution variation of ecosystem service values in the Yarlung Zangbo River Basin from 1980 to 2015 |
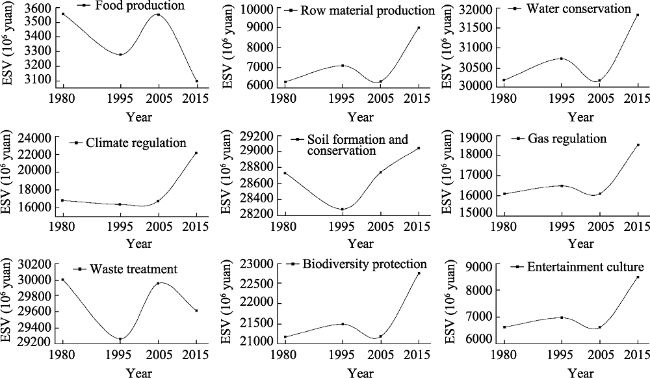
Figure 3 Changes in different kinds of ecosystem service values in the Yarlung Zangbo River Basin from 1980 to 2015 |
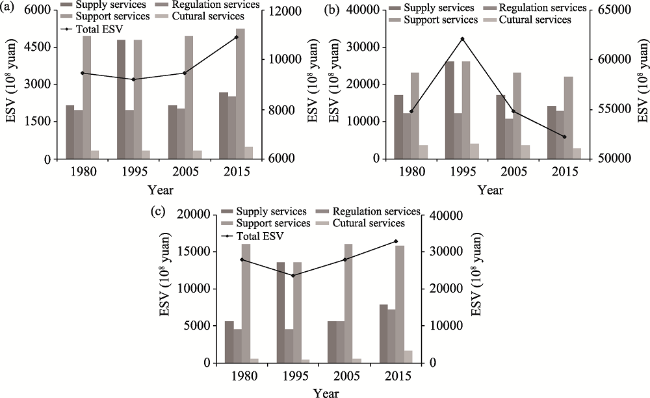
Figure 4 Spatio-temporal changes of multiple ecosystem service values in subbasins of Yarlung Zangbo River Basin(a. upper reaches; b. middle reaches; c. lower reaches) |
Figure 5 Different types of ecosystem service values hot-cold spots of watersheds in the Yarlung Zangbo River Basin from 1980 to 2015 (a. supply service; b. regulation services; c. support services; d. cultural service) |
Table 3 Sensitivity index of ecosystem service values to its coefficient |
| Change of value coefficients | 1980 | 1995 | 2005 | 2015 | ||||
|---|---|---|---|---|---|---|---|---|
| % | CS | ESV | CS | ESV | CS | ESV | CS | |
| Cropland VC±50% | 0.005 | 0.009 | 0.003 | 0.006 | 0.005 | 0.009 | 0.005 | 0.010 |
| Forest land VC±50% | 0.153 | 0.305 | 0.175 | 0.349 | 0.153 | 0.307 | 0.207 | 0.414 |
| Grassland VC±50% | 0.227 | 0.454 | 0.208 | 0.416 | 0.227 | 0.454 | 0.161 | 0.321 |
| Water VC±50% | 0.096 | 0.193 | 0.101 | 0.201 | 0.097 | 0.193 | 0.061 | 0.122 |
| Wetland VC±50% | 0.016 | 0.031 | 0.009 | 0.018 | 0.015 | 0.029 | 0.062 | 0.123 |
| Unused land VC±50% | 0.004 | 0.008 | 0.005 | 0.009 | 0.004 | 0.008 | 0.005 | 0.010 |
Figure 6 Variations in the multi-year average ecosystem service values for 1980-2015 along with elevation, temperature, precipitation, POP, and GDP |
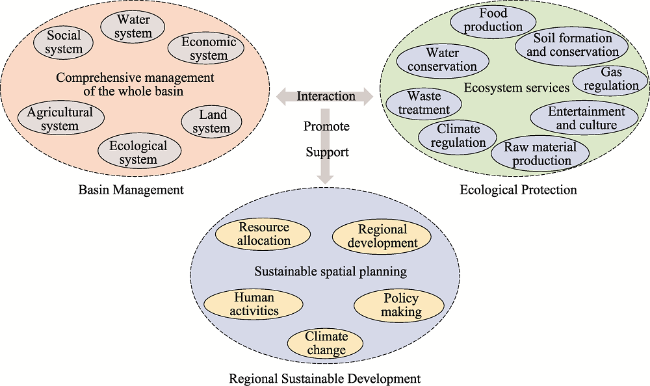
Figure 7 Relationship between ecological protection, basin management, and regional sustainable development (modified after Zhang et al., 2020) |
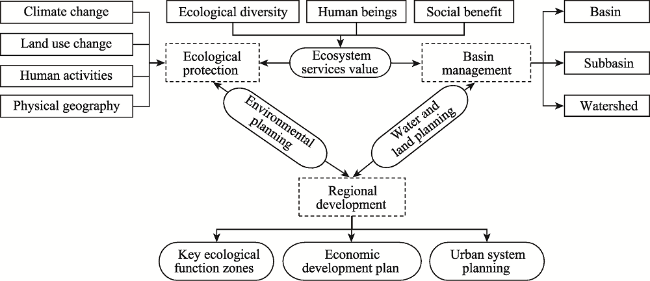
Figure 8 Implementation path of a sustainable basin spatial planning |
| [1] |
|
| [2] |
|
| [3] |
|
| [4] |
|
| [5] |
|
| [6] |
|
| [7] |
|
| [8] |
|
| [9] |
|
| [10] |
|
| [11] |
|
| [12] |
|
| [13] |
|
| [14] |
|
| [15] |
|
| [16] |
|
| [17] |
|
| [18] |
|
| [19] |
|
| [20] |
|
| [21] |
|
| [22] |
|
| [23] |
|
| [24] |
|
| [25] |
Millennium Ecosystem Assessment (MA), 2005. Ecosystems and Human Well-being. Washington DC: Island Press.
|
| [26] |
|
| [27] |
|
| [28] |
|
| [29] |
|
| [30] |
|
| [31] |
|
| [32] |
|
| [33] |
|
| [34] |
|
| [35] |
|
| [36] |
|
| [37] |
|
| [38] |
|
| [39] |
|
| [40] |
|
| [41] |
|
| [42] |
|
| [43] |
|
| [44] |
|
| [45] |
|
/
| 〈 |
|
〉 |