Analysis of ecological quality in Lhasa Metropolitan Area during 1990-2017 based on remote sensing and Google Earth Engine platform

  • HUANG Huiping , 1, 2 ,
  • CHEN Wei 1, 2 ,
  • ZHANG Yuan , 1, * ,
  • QIAO Lin 1, 2 ,
  • DU Yunyan 3, 2
Expand
  • 1. Aerospace Information Research Institute, CAS, Beijing 100094, China
  • 2. University of Chinese Academy of Sciences, Beijing 100049, China
  • 3. State Key Laboratory of Resources and Environmental Information System, Institute of Geographic Sciences and Natural Resources Research, CAS, Beijing 100101, China
*Zhang Yuan (1984-), PhD, specialized in remote sensing based ecological monitoring and evaluation. E-mail:

Huang Huiping (1973-), PhD and Professor, specialized in remote sensing for urban analysis. E-mail:

Received date: 2020-03-30

  Accepted date: 2020-07-23

  Online published: 2021-04-25

Supported by

Strategic Priority Research Program of the Chinese Academy of Sciences(XDA20040401)

Copyright

Copyright reserved © 2021. Office of Journal of Geographical Sciences All articles published represent the opinions of the authors, and do not reflect the official policy of the Chinese Medical Association or the Editorial Board, unless this is clearly specified.

Abstract

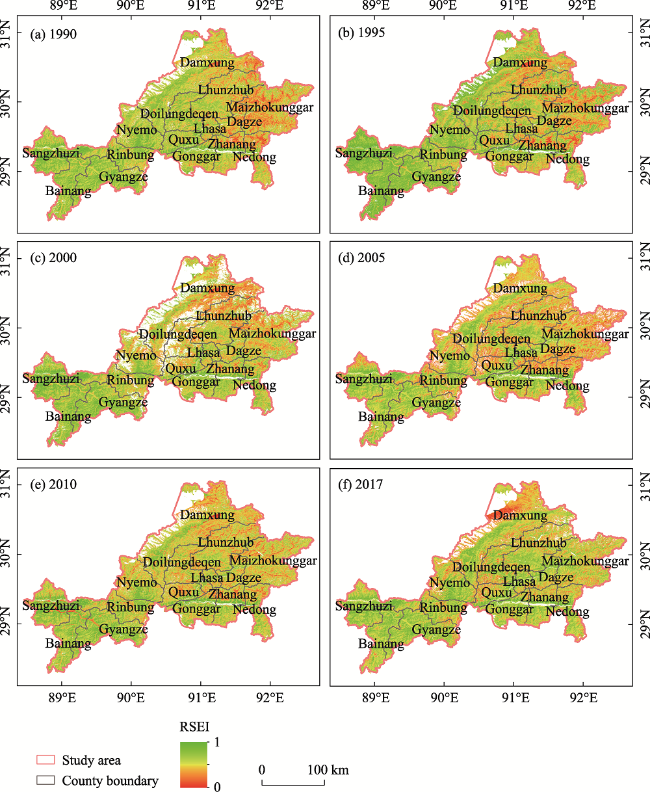
Based on a total of 519 images, the composite images with the lowest possible cloud cover were generated at pixel level with image synthesis method on Google Earth Engine (GEE) platform. The Remote Sensing Ecological Index (RSEI) was adopted, and calculated in an efficient way with the assistance of parallel cloud computing of the GEE platform. The RSEI was used in this paper to evaluate and monitor the eco-environmental quality of the Lhasa Metropolitan Area. Results show that: (1) The ecological quality is better in the west than in the east of Lhasa Metropolitan Area, with Lhasa as an approximate dividing point. The ecological quality improved and then deteriorated dramatically before 2000, with the mean RSEI value dropping from 0.51 to 0.46; the trend was followed by a gradual increase up until 2017, with the mean RSEI value increased from 0.46 to 0.55. (2) The RSEI is weakly and positively correlated with socioeconomic indicators. This indicates that the population growth and economic development did not negatively influence the ecological quality, but actually boosted it. (3) The GEE can serve as an efficient computing platform for the assessment and monitoring of eco-environmental quality in vast regions.

Cite this article

HUANG Huiping , CHEN Wei , ZHANG Yuan , QIAO Lin , DU Yunyan . Analysis of ecological quality in Lhasa Metropolitan Area during 1990-2017 based on remote sensing and Google Earth Engine platform[J]. Journal of Geographical Sciences, 2021 , 31(2) : 265 -280 . DOI: 10.1007/s11442-021-1846-8

1 Introduction

With the rapid urbanization in China, land use change has been increasingly intensified, and ecological system has been deteriorating in recent decades (Normile, 2008; Wu et al., 2011). Many ecological issues, such as grassland degradation (Harris, 2010; Wen et al. 2013), soil erosion (Teng et al., 2018), biodiversity loss (Wang et al., 2015), desertification (Dong et al., 2010; Li et al., 2016) and related economic recession, have become more prominent. The Tibetan Plateau serves as the ecological barrier for biodiversity, climate, and water cycle, and therefore it has been the focus of global terrestrial ecosystem change and global climate change studies. Meanwhile, the Tibetan Plateau is featured by fragile and complicated environments, making it susceptible to climate change and human activities (Piao et al., 2012). The eco-environment of the Tibetan Plateau as a whole is in a state of light- to-moderate degradation, and the ongoing degradation has not been fundamentally reversed in spite of the local governance and regulation (TARDRC, 2018). Consequently, its fragile ecosystem is highly sensitive to human intervention (e.g., agriculture and urbanization), and a seemingly insignificant human disturbance may lead to serious ecological degradation (Yao et al., 2012). Furthermore, local economic development and ecological security are closely correlated with the Tibetan Plateau’s ecosystem service function. The extensive economic development and rapid urbanization will further squeeze the ecological space, exacerbate the fragmentation of habitats, reduce biodiversity, and increase the difficulty of ecological protection and restoration. Especially, the rapid expansion of urban areas poses great challenges to the eco-environment (Kerr et al., 2003), which leads to the continuous degradation of the eco-environmental quality (Han et al., 2019). The funding gap for eco-environmental protection construction is large, and the construction of environmental infrastructure has lagged. The implementation of the Tibet Ecological Security Barrier Construction Plan has been slow. A large number of ecological protection and construction projects could not be implemented as scheduled (TARDRC, 2018). Therefore, more attention should be paid to the eco-environment situation of this region considering the above-mentioned problems. The analysis of ecological quality around cities is of greater importance than ever. Although urban decision-makers are fully aware of the importance of urban ecosystems for human health and life quality, the question remains of how to assess urban ecological conditions and manage urban ecosystems (Lakes et al., 2012).
The eco-environmental quality is an aggregated result influenced simultaneously by natural and anthropogenic factors. These factors can be quantitatively described by climate, terrain, land cover and vegetation data derived from remote sensing. The evaluation of regional eco-environmental conditions can help policy makers better understand the regional ecological situation and supervise them to take corresponding measures to improve regional development.
In China, numerous studies have been conducted on the Tibetan Plateau. Most of them concentrated on analyzing vegetation dynamics, as well as the relations with the potential driving force, such as human activities, climate change (Chen et al., 2014a; Huang et al., 2016; Li et al., 2016; Li et al., 2018; Luo et al., 2018; Wang, 2018; Zhang et al., 2018; Ran et al., 2019). Li et al. (2018) analyzed the vegetation change on the Tibetan Plateau during the period of 2000-2015 and integrated climatic and human footprint datasets to quantify the responses of vegetation to climatic and anthropogenic factors. Zhang et al. (2018) estimated the grassland yield on the Tibetan Plateau within 25 years and analyzed the impact of climate change and human activities. Liu et al. (2018) studied the spatiotemporal changes of grassland coverage from 2000 to 2016 in the Three-River Headwaters Regions. Yang et al. (2010) explored alpine grassland degradation based on classification. Han et al. (2019) analyzed the status of alpine grassland based on ecological indicators in Lhasa River Basin. Li et al. (2016) assessed the intensity of human influence on vegetation around Lhasa city.
Furthermore, some studies paid attention to land use change, its impact factors and its influence on eco-environment on the Tibetan Plateau (Wang et al., 2002; Shao et al., 2005; Ding et al., 2006; Zhao et al., 2015. For instance, Rai et al. (2018) and Gong et al. (2017) analyzed the land use and land cover change in Qinghai Lake area and evaluated the impacts on ecological benefits. Jin et al. (2019) conducted an ecological risk assessment on Delingha city on the Tibetan Plateau based on the intensity of land use and land cover change.
However, a limited number of studies have been conducted to assess land quality in an ecological sense on the Tibetan Plateau, using remote sensing technology and considering a comprehensive set of factors regarding land use, population, and economy (Du et al., 2019). Although some studies utilized the techniques of remote sensing and geographic information system, most of them have considered only the natural environment (Yang et al., 2002). For example, Guo et al. (2016) used landscape pattern indices and extreme climate factors to establish a new model for the evaluation of changes on the spatial patterns of ecosystem vulnerability.
There have been even fewer studies on the ecological quality around Lhasa city, the most important city on the Tibetan Plateau. This type of studies have been focusing on the relationship among urban expansion, land use and vegetation (Chu et al., 2010; Li et al., 2016; Tang et al., 2017; Chen et al., 2018). Tang et al. (2017) analyzed the urban expansion process from the time series of high-resolution remote sensing data within the period of 1990-2015 in Lhasa and analyzed the contribution of four potential factors of economy, demography, society, and government policy.
The ecological indicator is a well-established approach to provide useful information for ecosystem management in land use and ecological planning (Lakes et al., 2012). Ecological indicators can provide quantitative and spatially explicit description of the ecoenvironment in a region. Many spatially continuous urban ecological indicators have been developed and widely used in urban planning in the 1980s and 1990s. Examples include the (weighted) imperviousness (Weng, 2012), vegetation density value (Kumar et al., 2012), and integrated ecological value (Mahan et al., 2015). However, these indicators are based on local statistical data, field surveys and manual classification of aerial remote sensing images (Cadenasso et al., 2007), which are difficult to collect, and lack necessary quality evaluation and spatial context. Therefore, these indicators are more suitable for small areas (Behling et al., 2015; Rose et al., 2015). In light of the limitations of conventional indicators, remote sensing based indicators are in great need for more effective coping with ecological change (Rose et al., 2015).
Remote sensing has long been acknowledged as an efficient way for monitoring ecological conditions, due to its advantages of rapid, large area, periodical, and repeated earth observations (Turner et al., 2003). Since 1972, accumulated multi-temporal, spatially continuous Landsat datasets have been available (Roy et al., 2010). Based on the long-term Landsat data, many studies have been carried out regarding the human impact on land cover and the environment over time (Butt et al., 2015).
Xu (2013) developed the remote sensing ecological index (RESI), taking into consideration greenness, wetness, dryness and heat. The RSEI has been widely used in the evaluation of regional ecological quality (Wang et al., 2019; Hang et al., 2019; Liu et al., 2019; Wang et al., 2019), because it can obtain efficiently and reveal objectively regional ecological quality (Yue et al., 2019; Xu et al., 2018).
However, the acquisition of the multi-temporal and high-precision dataset used for ecological quality analysis and evaluation is usually time-consuming and labor-intensive. The monitoring of such a large area of about 50,000 km2 over a long period in the Lhasa Metropolitan Area is expected to require 1000 to 2000 scenes of remotely sensed images. Under this circumstance, conventional methods are not competent to complete such massive data processing and extensive calculation. As a cloud-based platform, Google earth engine (GEE) enables easy access to high performance computing resources and computation of very large geospatial datasets (Gorelick et al., 2017). Millions of servers on GEE are located all over the world, and scientists are able to process and analyze trillions of images in parallel (Dong et al., 2016). It is possible for scientists and researchers to analyze real-time changes on the earth's surface using 40 years of online satellite imagery on this platform (Houseman et al., 2015). Therefore, the GEE can serve as a technical platform for monitoring and evaluating eco-environmental quality in large regions.
Considering the issues mentioned above, the objective of this paper focuses on the analysis of long-time ecological quality changes in Lhasa Metropolitan Area using remote sensing with GEE platform. First, the feasibility of wall-to-wall image coverage with GEE platform in Lhasa metropolitan area was analyzed. Second, the ecological quality was evaluated using the RESI. Finally, the variation of ecological quality in Lhasa metropolis was revealed.

2 Study area and data

2.1 Study area

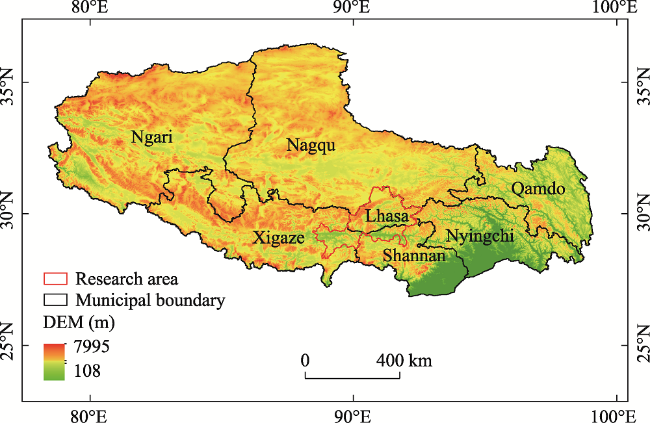
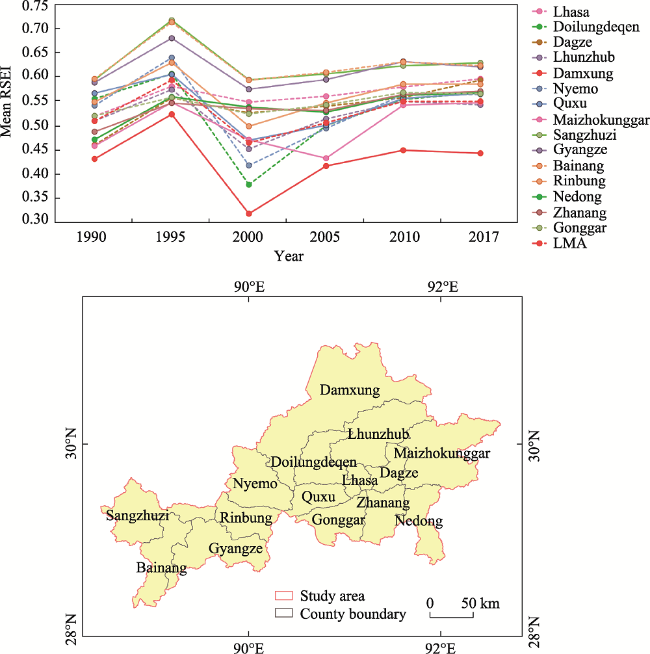
Figure 1 Spatial extent of Lhasa Metropolitan Area on the Tibetan Plateau, China
Known as the third pole of the world, the Tibetan Plateau is an area of great concern for biodiversity conservation and provides various ecosystem services (Chen et al., 2014b). In Tibet autonomous regional urban system planning (2008-2020) of China, the metropolitan area’s layout was built with “one line, one region, one center, and more points”. Lhasa is the center. One region includes the Basin of Yarlung Zangbo River and its four tributaries, Lhasa River, Nyangqu River, Yalong River, and Yanghe River. Lhasa Metropolitan Area covers Lhasa city and the central area of those five river basins with an area of 48,000 square kilometers.
On the Tibetan Plateau, the population is highly concentrated in Lhasa and prefecture-level urban areas. In 2017, Lhasa Metropolitan Area had a total population of 930,000, accounting for 30% of the total population of Tibet. The population of all counties in the metropolitan area is heterogeneous. The urban population is about 545,000, which takes up more than half of the total population in the Lhasa Metropolitan Area. The population distribution is featured by a great degree of spatial heterogeneity of population density, showing a pattern of high in the south and low in the north, and high in the urban and low in the rural areas. Most cities are small in the metropolitan area, except for Lhasa. The economic aggregation level is relatively low, and the secondary and tertiary industries are highly concentrated in Lhasa and prefecture-level urban areas. The Lhasa Metropolitan Area is associated with low economic development level, due to the special geo-location of the Tibetan Plateau. Due to the unique topography and diverse climate in Lhasa Metropolitan Area, this area is rich in biodiversity. However, the ecosystem is fragile and vulnerable to climate change and human impacts.

2.2 Remote sensing data and preprocessing

Google Earth Engine provides 40-year archived Landsat data with a 30-m spatial resolution online (Huang et al., 2017). All image pre-processing tasks were carried out on this platform (https://earthengine. google.org/). In this study, 519 Landsat scenes of the years 1990, 1995, 2000, 2005, 2010, and 2017 were used. In order to avoid the impact caused by seasonal differences, data in summer and early autumn between June and September were selected for each of the six years. Landsat-5 TM images with 51, 86, 56, 95 and 93 scenes were used to mosaik the imagery of 1990, 1995, 2000, 2005 and 2010 respectively, totaling 381 scenes. Landsat-8 OLI images were used to composite the images of 2017, with a total number of 138 scenes (Figure 2). The number of Landsat images by month in each year is shown in Figure 3.
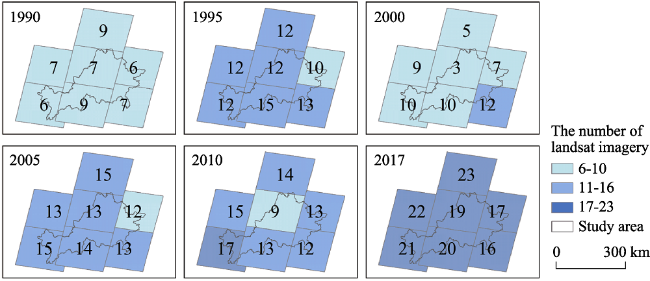
Figure 2 The Landsat images used to produce seasonal clear images with the lowest cloud composite
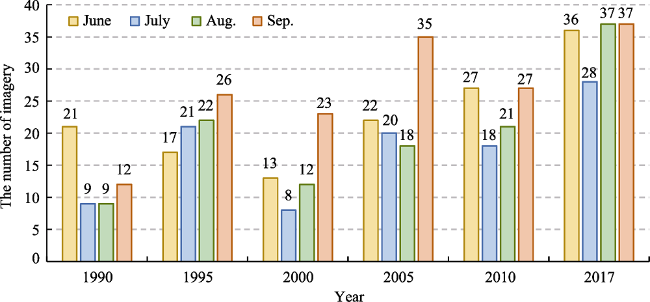
Figure 3 The statistics of the number of Landsat images by month in each year

2.3 Land use and statistical data

Land use and statistical data are used to analyze the impact of ecological quality changes. Land use dataset from 1990-2017 (1990, 1995, 2000, 2005, 2010 and 2017) was acquired from the resource and environmental science data center of the Chinese Academy of Sciences (http://www.resdc.cn/data.aspx?DATAID=96) with a spatial resolution of 100 m. This data is based on Landsat TM/ETM remote sensing image interpretation, including six primary classes and 25 secondary classes. In addition, demographic and socioeconomic data of Lhasa metropolitan area are obtained from the statistical yearbook of Tibet.

3 Method

In this study, the ecological quality in Lhasa Metropolitan Area was analyzed using a three-stage framework (Figure 4). First, based on all 1382 scenes of Landsat images, the lowest-cloud composite images were generated at pixel level using image synthesis method on Google Earth Engine platform (as described in Section 2.2). Second, with the assistance of parallel cloud computing ability of GEE platform, four indicators (greenness, wetness, dryness, and heat) were calculated efficiently. Finally, the principal component analysis was used to combine the four indicators into the remote sensing-based ecological index RSEI, in order to assess and monitor the ecological quality in Lhasa Metropolitan Area.
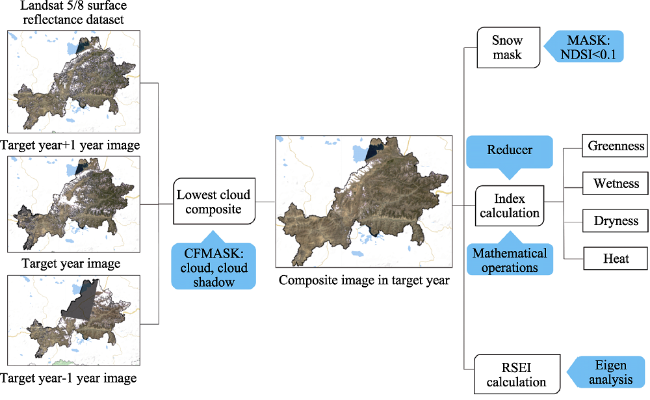
Figure 4 The methodological framework of the ecological quality analysis in Lhasa Metropolitan Area during 1990-2017

3.1 Pixel-based time series data reconstruction

In order to make full use of the image information in the same season and overcome the influence of clouds, the pixel-based time series data reconstruction was conducted to obtain time series data (1990, 1995, 2000, 2005, 2010 and 2017) with clean-sky pixels. An object-based algorithm Fmask was used to produce a clear cloud-free image using the selected Landsat scenes of single dates (Zhu et al., 2012). First, all Landsat surface reflectance images from June to September in the target year and in the years before and after were collected. Each image includes 4 visible, near-infrared, 2 short-wave infrared (SWIR) and 1thermal infrared (TIR) bands. Second, the function maskL8sr (https://developers.google.com/earth-engine/datasets/catalog/LANDSAT_LC08_C01_T1_SR#bands) provided by GEE was used to remove clouds. In this function, the Quality Assessment (QA) band in GEE was used to flag bad-quality observations of each image (i.e., clouds, cloud shadows, cirrus, and snow/ice). Thus, all the available clear-sky pixels are used to build the time series data in the study data.

3.2 Calculation of four indicators

Xu (2013) synthesized four indicators (greenness, wetness, dryness, and heat) to obtain an ecological index named RSEI, which is completely based on remote sensing. This index is used to access ecological status. The four indicators considered in the RSEI are closely related to the ecological quality and directly perceivable. The weights of these four indicators were determined by principal component analysis. The RSEI enables the derivation of the ecological dynamics for the analysis of the interactions between human activities and eco-environment. The RSEI is calculated as follows:
$\text{RSEI}=\text{f}\left( \text{NDVI},\text{Wet},\text{LST},\text{NDSI} \right)$
$We{{t}_{OLI}}=0.1511{{\rho }_{green}}+0.1973{{\rho }_{red}}+0.3283{{\rho }_{NIR}}+0.3407{{\rho }_{SWIR1}}-0.7117{{\rho }_{TIR}}-0.4559{{\rho }_{SWIR2}}$
$We{{t}_{TM}}=0.0315{{\rho }_{blue}}+0.2021{{\rho }_{green}}+0.3102{{\rho }_{red}}+0.1594{{\rho }_{NIR}}-0.6806{{\rho }_{SWIR1}}-0.6109{{\rho }_{SWIR2}}$
$\text{NDSI}=\frac{\left[ \frac{({{\rho }_{SWIR1}}+{{\rho }_{red}})-({{\rho }_{NIR}}+{{\rho }_{blue}})}{({{\rho }_{SWIR1}}+{{\rho }_{red}})+({{\rho }_{NIR}}+{{\rho }_{blue}})} \right]}{\left[ \frac{\frac{2{{\rho }_{SWIR1}}}{{{\rho }_{SWIR1}}+{{\rho }_{NIR}}}-\left( \frac{{{\rho }_{NIR}}}{{{\rho }_{NIR}}+{{\rho }_{red}}}+\frac{{{\rho }_{green}}}{{{\rho }_{green}}+{{\rho }_{SWIR1}}} \right)}{\frac{2{{\rho }_{SWIR1}}}{{{\rho }_{SWIR1}}+{{\rho }_{NIR}}}+\left( \frac{{{\rho }_{NIR}}}{{{\rho }_{NIR}}+{{\rho }_{red}}}+\frac{{{\rho }_{green}}}{{{\rho }_{green}}+{{\rho }_{SWIR1}}} \right)} \right]}$
where NDVI refers to the normalized difference vegetation index, Wet refers to humidity component, LST refers to land surface temperature, $\text{NDBSI}$ refers to normalized difference bare soil index, ρ refers to the corresponding bands of Landsat images, $We{{t}_{OLI}}$ refers to humidity component calculated from Landsat 8 (Xu et al., 2018), and $We{{t}_{TM}}$ refers to that calculated from Landsat 5 (Xu, 2013).
As the world’s most advanced petabyte geographic data used as scientific analysis platform, GEE can achieve fast operation of spatially explicit remote sensing indicators over a large area online. According to the equation of each indicator (Xu, 2013), the calculation of four indicators is completed on the GEE platform. Since the unit and data range of the indicators are different, the values of the four indicators must be normalized to the range of 0 to 1, before the principal component analysis can be applied. An example code piece of indicator calculations and normalizations based on GEE platform can be found at: https://code.earthengine.google.com/248cd3edea59d0429c891ed78aaef5ca (A Google account is required).

3.3 Building RSEI with combination of the indicators

Xu (2013) used principal component analysis to build the remote sensing ecological index rather than a traditional weighted sum method. The main information of the four indicators was mainly concentrated on the first principal component (PC1).
In principal component analysis, principal component is the linear combination of each indicator, and the weight of indicators is the eigenvector. It indicates the contribution of each indicator to the principal component and determines the practical significance of the principal component. The four normalized indicators were analyzed by principal component analysis module of ENVI software. The eigenvector, eigenvalue, contribution rate and cumulative contribution rate of principal components were obtained to justify the applicability of RSEI in Lhasa Metropolitan Area (Table 1).
Table 1 Principal component eigenvectors, eigenvalues, contribution rate and cumulative contribution
Year 2005 2017
PC1 PC2 PC3 PC4 PC1 PC2 PC3 PC4
NDVI 0.130 0.964 0.178 -0.145 0.012 -0.076 0.923 0.376
Wet 0.195 0.021 -0.762 -0.617 0.329 -0.921 -0.143 0.154
LST -0.139 -0.205 0.584 -0.773 -0.027 0.199 -0.355 0.913
Dry -0.962 0.165 -0.215 -0.033 -0.944 -0.327 -0.028 0.033
Eigenvalue, 0.0112 0.0050 0.0012 0.0002 0.0113 0.0050 0.0009 0.0001
Contribution rate 63.63% 28.48% 6.82% 1.07% 51.24% 32.09% 15.05% 1.62%
The results show that in Lhasa Metropolitan Area, (1) NDVI representing green degree and Wet representing humidity are positive, and the LST representing heat and the NDBSI representing dry degree are negative, which are consistent with the fact that green degree and humidity have a positive effect and dry degree and temperature have a negative one on the eco-environment. (2) Compared with other components, PC1 constitutes nearly 50%-60% of the information of the four indicators, making it a feasible remote sensing ecological index.
Large water bodies need to be removed before the principal component analysis to avoid the interference of large water bodies to the real ground humidity conditions. The 30-m JRC Yearly Water Classification dataset (Pekel et al., 2016) on GEE platform contains maps of the location and temporal distribution of surface water from 1984 to 2018, and was used as the water mask in this paper. According to the equation of each indicator (Xu, 2013), the values of RSEI of 1990, 1995, 2000, 2005, 2010 and 2017 were obtained based on GEE platform Eigen Analysis (https://developers.google.com/earth-engine/arrays_eigen_analysis).

4 Results and discussion

4.1 Spatio-temporal patterns of RSEI

The RSEI was generated from 1990 to 2017 over Lhasa Metropolitan Area as shown in Figure 5. In general, Lhasa Metropolitan Area has better ecological quality in the west than in the east. In 1990, the difference between the west and the east is the greatest. The ecological quality in the mountainous area in the northeastern Damxung, Lhunzhub, Maizhokunggar, Dagze, Nedong and northern Zhanang is the worst within Lhasa Metropolitan Area. On the other hand, the ecological quality is much better in the counties west of Lhasa. In 1995, the overall ecological quality increases dramatically in the entire Lhasa Metropolitan Area, though the poor in the east and good in the west pattern still exists. In 2000, the overall ecological quality deteriorated, while in 2005, the quality improved specifically along the valleys. In 2010, the ecological quality further improved in other regions than just the valley region. In 2017, the overall trend was still increasing towards higher ecological quality. However, northern Damxung County just south of the Nam Co Lake experienced obvious trend toward much lower ecological quality. This is possibly because during this period Damxung County strengthened the production level of grassland animal husbandry, leading to the increased intensity of grassland resource utilization.
Figure 5 The spatial distribution of RSEI in Lhasa Metropolitan Area in 1990, 1995, 2000, 2005, 2010 and 2017
The mean ecological quality as indicated by RSEI within Lhasa Metropolitan Area experienced a process of abrupt-increase, abrupt decrease, and gradual increase (Figure 6). The RSEI increased dramatically from 1990 to 1995, decreased dramatically from 1995 to 2000, and then increased gradually from 2000 up to 2017. However, the RSEI still haven’t recovered to the 1990 level up until 2017. The ecological quality is the highest in 1995 and the lowest in 2000. This trend is consistent with the research results of Li (2019). Li (2019) analyzed the coupling relationship between urbanization and eco-environment in Lhasa city from 2011 to 2015, and concluded that the environmental comprehensive index is constantly fluctuating, showing an overall downward trend (Li, 2019).
Figure 6 The mean RSEI of Lhasa Metropolitan Area of the 15 counties
The temporal evolution of the RSEI in each individual county shows a similar trend as in the entire Lhasa Metropolitan Area. Among them, Damxung County has the poorest ecological quality during the entire period of 1990 through 2017. The RSEI in Damxung County ranges from 0.32 in 2000 to 0.52 in 1995. Counties of Bainang, Gyangze and Sangzhuzi have the best ecological quality. The RSEI in these three counties ranges from as low as 0.57 in 2000 to as high as 0.72 in 1995. Lhasa, among all counties, has the smallest inter-annual variation with the RSEI ranging from 0.52 in 1990 to 0.59 in 2017. The Maizhokunggar County has a slight different trend with the RSEI decreasing from 1995 until 2005. Its RSEI valley occurred in 2005 and peak in 2017. From 2000 to 2005, the RSEI of Maizhokunggar County shows a decreasing trend, which is different from those of other counties. This lower ecological quality is anticipated to be closely related to the excessive exploitation of mineral resources and vegetation destruction in Maizhokunggar County.
The inter-annual variation from 1990 to 2017 in Lhasa Metropolitan Area is displayed in Figure 7. Pixels with an RSEI absolute difference of less than 0.2 were regarded similar, those with a RSEI increase of more than 0.2 was regarded as better and those with a RSEI decrease of more than 0.2 regarded worse. Most of the region shows an increasing trend of RSEI, and only a very limited number of regions were associated with a decreasing trend from 1990 to 1995. The situations were completely opposite for the period of 1995-2000.
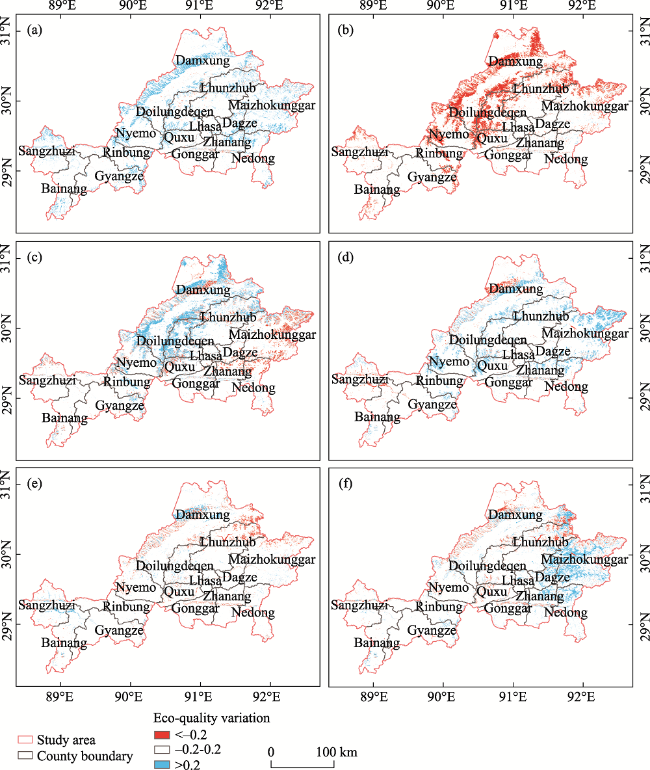
Figure 7 The inter-annual variation of RSEI in Lhasa Metropolitan Area during the periods of 1990-1995 (a), 1995-2000 (b), 2000-2005 (c), 2005-2010 (d), 2010-2017 (e) and 1990-2017 (f)
Lhasa Metropolitan Area is predominantly occupied by the increased ecological quality over the entire period of 1990-2017 (Figure 7f). The regions with worse ecological quality are sparsely distributed in the center, north, and northeast of Lhasa Metropolitan Area. However, the region with better ecological quality is much more concentrated and located in the eastern Lhasa Metropolitan Area in counties of Maizhokunggar, Dagze, Nedong and northern Zhanang.
Lhunzhub and Maizhokunggar were selected to analyze the annual change between the four indicators and RSEI. The results show that RSEI is very integrative regarding the four aspects of greenness, wetness, dryness and heat. RSEI values comprehensively reflect and quantitatively describe the ecological quality and can effectively reflect the ecological changes of Lhunzhub and Maizhokunggar (Figure 8). Among these four indicators, none of them shows its maximum contribution to RSEI. The contribution of vegetation and dryness are relatively larger, but the combination of wetness and heat can offset these effects from vegetation and urban land.
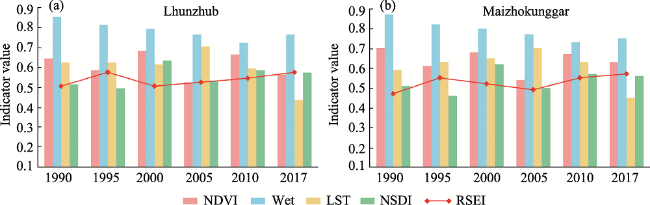
Figure 8 The changes of four indicators and RSEI in Lhunzhub and Maizhokunggar from 1990-2017

4.2 Relationship between RSEI and socioeconomic status

Six socioeconomic indicators of population, urban population, GDP, population density, urban population density, and GDP per capita were generated and plotted against the correspondent RSEI of the 15 counties within Lhasa Metropolitan Area to explore the variation of ecological quality as influenced by socioeconomic status.
As shown in Figure 9, RSEI is only weakly correlated with all six socioeconomic indicators. The correlation coefficient between RSEI and GDP per capita was the highest and the only one above 0.3. This is probably because the more developed areas are associated with a higher level of environmental awareness and financial support for eco-environmental protection. All correlation coefficients were positive, indicating the population increase and economic development actually did not influence the ecological quality in Lhasa Metropolitan Area in a negative way. If Lhasa was excluded from the analysis, all correlation coefficients increased dramatically except for that between RSEI and GDP per capita. All socioeconomic indicators have a correlation coefficient greater than 0.35. The one between RSEI and population density is as high as 0.56. This increase may indicate that Lhasa, as the core city of Lhasa Metro Area, was treated in a different way with different roles and different policy. Similarly, the signs of all correlation coefficients are positive. Therefore, it is further confirmed that the economic development actually boosted instead of suppressed the ecological quality in Lhasa Metropolitan Area.
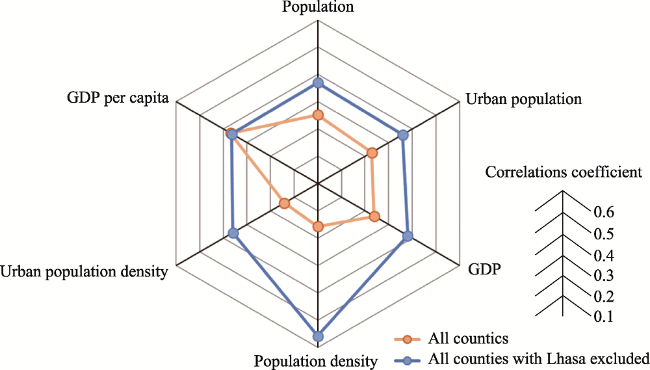
Figure 9 The correlation coefficients between RSEI and socioeconomic indicators

5 Conclusions

This paper developed a method to derive the effective and robust RSEI in an efficient manner using the Google Earth Engine, demonstrating the effectiveness of GEE in handling the extremely large dataset over a vast region. Therefore, the GEE can be treated as a platform for effective and efficient large-scale ecological quality evaluation of a large area. The method was applied to analyze the spatio-temporal variation and patterns of Lhasa Metropolitan Area. Major conclusions are as follows:
(1) Under the circumstances of a vast region and a huge amount of data, the algorithms and the parallel cloud computing provided by GEE platform can be used to avoid complicated, labor intensive, and time-consuming data preprocessing. That is, GEE can be used as an efficient calculation platform for eco-environmental quality evaluation and monitoring in a large area.
(2) The ecological quality is better in the west than in the east of Lhasa Metropolitan Area, with Lhasa as an approximate dividing point. Damxung County has the worst (with a long-term mean RSEI of 0.45) and counties of Bainang, Gyangze and Sangzhuzi have the best ecological quality (with long-term mean RSEI values around 0.6). The ecological quality in Lhasa Metropolitan Area increases and then decreases dramatically before 2000, followed by a gradual increase up until 2017.
(3) The RSEI is weakly and positively correlated with socioeconomic indicators, within Lhasa Metropolitan Area and only one indicator’s (GDP per capita) correlation coefficient above 0.3. However, while Lhasa, the core of Lhasa Metropolitan Area, is excluded, the correlation coefficient dramatically increases, with all indicators’ correlation coefficient above 0.3. The population increase and ecological development in Lhasa Metropolitan Area did not negatively influence the ecological quality, on the contrary, it boosted the ecological quality.
[1]
Behling R, Boshow M, Foerster S et al., 2015. Automated GIS-based derivation of urban ecological indicators hyper-spectral remote sensing and height information. Ecological Indicators, 48:218-234.

DOI

[2]
Butt A, Shabbir R, Ahmad S et al., 2015. Land use change mapping and analysis using remote sensing and GIS: A case study of Simly watershed, Islamabad, Pakistan. The Egyptian Journal of Remote Sensing and Space Science, 18(2):251-259.

DOI

[3]
Cadenasso M, Pickett S, Schwarz K, 2007. Spatial heterogeneity in urban ecosystems: Reconceptualizing land cover and a framework for classification. Frontiers in Ecology and the Environment, 5(2):80-88.

DOI

[4]
Chen B, Zhang X, Tao J et al., 2014. The impact of climate change and anthropogenic activities on alpine grassland over the Qinghai-Tibet Plateau. Agricultural and Forest Meteorology, 189:11-18.

DOI

[5]
Chen T, Lang W, Chan E et al., 2018. Lhasa: Urbanising China in the frontier regions. Cities, 74:343-353.

DOI

[6]
Chu D, Zhang Y, Biangba C et al., 2010. Land use dynamics in Lhasa area, Tibetan Plateau. Journal of Geographical Sciences, 20(6):899-912.

DOI

[7]
Ding M, Zhang Y, Shen Z et al., 2006. Land cover change along the Qinghai-Tibet highway and railway from 1981 to 2001. Journal of Geographical Sciences, 16(4):387-395.

DOI

[8]
Dong J, Xiao X, Menarguez M A et al., 2016. Mapping paddy rice planting area in northeastern Asia with Landsat 8 images, phenology-based algorithm and Google Earth Engine. Remote Sensing of Environment, 185:142-154.

DOI PMID

[9]
Dong Z, Hu G, Yan C et al., 2010. Aeolian desertification and its causes in the Zoige Plateau of China’s Qinghai-Tibetan Plateau. Environmental Earth Sciences, 59(8):1731-1740. (in Chinese)

DOI

[10]
Du J, Watts J, Jiang L et al., 2019. Remote sensing of environmental changes in cold regions: Methods, achievements and challenges. Remote Sensing, 11(16):1952-1988.

DOI

[11]
Gong J, Li J, Yang J et al., 2017. Land use and land cover change in the Qinghai Lake region of the Tibetan Plateau and its impact on ecosystem services. International Journal of Environmental Research and Public Health, 14(7):818-839.

DOI

[12]
Gorelick N, Hancher M, Dixon M et al., 2017. Google Earth Engine: Planetary-scale geospatial analysis for everyone. Remote Sensing of Environment, 202:18-27.

DOI

[13]
Guo B, Zhou Y, Zhu J et al., 2016. Spatial patterns of ecosystem vulnerability changes during 2001-2011 in the Three-River Source Region of the Qinghai-Tibetan Plateau, China. Journal of Arid Land, 8(1):23-35.

DOI

[14]
Han W, Lu H, Liu G et al., 2019. Quantifying degradation classifications on alpine grassland in the Lhasa River Basin, Qinghai-Tibetan Plateau. Sustainability, 11(24):7067.

DOI

[15]
Hang X, Luo X, Cao Y et al., 2020. Ecological quality assessment and urbanization impact based on RSEI mode: A case in Nanjing. Chinese Journal of Applied Ecology, 31(1):219-229. (in Chinese)

DOI PMID

[16]
Harris R, 2010. Rangeland degradation on the Qinghai-Tibetan Plateau: A review of the evidence of its magnitude and causes. Journal of Arid Environments, 74(1):1-12.

DOI

[17]
Huang H, Chen Y, Clinton N et al., 2017. Mapping major land cover dynamics in Beijing using all Landsat images in Google Earth Engine. Remote Sensing of Environment, 202:166-176.

DOI

[18]
Huang K, Zhang Y, Zhu J et al., 2016. The influences of climate change and human activities on vegetation dynamics in the Qinghai-Tibet Plateau. Remote Sensing, 8(10):876-896.

DOI

[19]
Jin X, Jin Y, Mao X, 2019. Ecological risk assessment of cities on the Tibetan Plateau based on land use/land cover changes: Case study of Delingha City. Ecological Indicators, 101:185-191.

DOI

[20]
Kerr J, Ostrovsky M, 2003. From space to species: Ecological applications for remote sensing. Trends in Ecology & Evolution, 18(6):0-305.

[21]
Kumar A, Pandey A, Jeyaseelan A, 2012. Built-up and vegetation extraction and density mapping using WorldView-II. Geocarto International, 27:557-568.

[22]
Lakes T, Kim H, 2012. The urban environmental indicator “Biotope Area Ratio”: An enhanced approach to assess and manage the urban ecosystem services using high resolution remote-sensing. Ecological Indicators, 13:93-103.

[23]
Li H, Li Y, Gao Y et al., 2016. Human impact on vegetation dynamics around Lhasa, southern Tibetan Plateau, China. Sustainability, 8(11):1146-1162.

[24]
Li L, Zhang Y, Liu L et al., 2018. Spatiotemporal patterns of vegetation greenness change and associated climatic and anthropogenic drivers on the Tibetan Plateau during 2000-2015. Remote Sensing, 10(10):1525-1541.

[25]
Li Q, Zhang C, Shen Y et al., 2016. Developing trend of aeolian desertification in China’s Tibet Autonomous Region from 1977 to 2010. Environmental Earth Sciences, 75(10):895-907.

[26]
Li Y, 2019. Analysis of the coupling evaluation of urbanization and ecological environment in Lhasa, Tibet. Journal of Tibet Nationalities University: Philosophy and Social Sciences Edition, (1):126-130. (in Chinese)

[27]
Liu N, Yang Y, Yao L et al., 2018. A regionalized study on the spatial-temporal changes of grassland cover in the Three-River Headwaters Region from 2000 to 2016. Sustainability, 10(10):3539-3563.

[28]
Liu S, Yuan Y, Zhao G et al., 2019. Analysis of ecological environment changes in hydropower development zone based on RSEI: A case study in the middle and lower reaches of the Qingjiang River, China. Journal of Ecology and Rural Environment, 35(11):1361-1368. (in Chinese)

[29]
Luo Z, Wu W, Yu X et al., 2018. Variation of net primary production and its correlation with climate change and anthropogenic activities over the Tibetan Plateau. Remote Sensing, 10(9):1352-1374.

[30]
Mahan, C, Young J, Miller B et al., 2015. Using ecological indicators and a decision support system for integrated ecological assessment at two national park units in the Mid-Atlantic Region, USA. Environmental Management, 55(2):508-522.

DOI PMID

[31]
Normile, 2008. China’s living laboratory in urbanization. Science, 319(5864):740-743.

PMID

[32]
Pekel Jean-François et al., 2016. High-resolution mapping of global surface water and its long-term changes. Nature, 540:418-422.

PMID

[33]
Piao S, Tan K, Nan H et al., 2012. Impacts of climate and CO2 changes on the vegetation growth and carbon balance of Qinghai-Tibetan grasslands over the past five decades. Global and Planetary Change, 98/99:73-80.

[34]
Rai R, Zhang Y, Paudel B et al., 2018. Land use and land cover dynamics and assessing the ecosystem service values in the trans-boundary Gandaki River Basin, Central Himalayas. Sustainability, 10(9):3052-3074.

[35]
Ran Q, Hao Y, Xia A et al., 2019. Quantitative assessment of the impact of physical and anthropogenic factors on vegetation spatial-temporal variation in northern Tibet. Remote Sensing, 11(10):1183-1205.

[36]
Rose R, Byler D, Eastman J et al., 2015. Ten ways remote sensing can contribute to conservation. Conservation Biology, 29(2):350-359.

[37]
Roy D, Ju J, Kline K et al., 2010. Web-enabled Landsat Data (WELD): Landsat ETM+ composited mosaics of the conterminous United States. Remote Sensing of Environment, 114(1):35-49.

[38]
Shao J, Ni S, Wei C et al., 2005. Land use change and its corresponding ecological responses: A review. Journal of Geographical Sciences, 15(3):305-328.

[39]
Tang W, Zhou T, Sun J et al., 2017. Accelerated urban expansion in Lhasa city and the implications for sustainable development in a plateau city. Sustainability, 9(9):1499-1518.

[40]
Teng H, Liang Z, Chen S et al., 2018. Current and future assessments of soil erosion by water on the Tibetan Plateau based on RUSLE and CMIP5 climate models. Science of The Total Environment, 635:673-686.

[41]
Tibet Autonomous Region Development and Reform Commission (TARDRC), 2017. Tibet Autonomous Region’s 13th Five-year Plan for Ecological and Environmental Protection. (in Chinese)

[42]
Turner W, Specto S, Gardiner N et al., 2003. Remote sensing for biodiversity science and conservation. Trends in Ecology & Evolution, 18:306-314.

DOI

[43]
Wang C, Dong W, Wei Z, 2002. Anomaly feature of seasonal frozen soil variations on the Qinghai-Tibet Plateau. Journal of Geographical Sciences, 12(1):99-107.

DOI

[44]
Wang F, He X, Fang Z et al., 2019. Assessment of the eco-environmental quality in Aberdare National Park based on long-term sequence remote sensing data. Journal of Geo-Information Science, 21(9):1479-1489. (in Chinese)

[45]
Wang L, Jiao L, Lai F et al., 2019. Evaluation of ecological changes based on a remote sensing ecological index in a Manas Lake wetland, Xinjiang. Acta Ecologica Sinica, 39(8):2963-2972. (in Chinese)

[46]
Wang L, Yu H, Zhang Q et al., 2018. Responses of aboveground biomass of alpine grasslands to climate changes on the Qinghai-Tibet Plateau. Journal of Geographical Sciences, 28(12):1953-1964.

[47]
Wang X, Dong S, Sherman R et al., 2015. A comparison of biodiversity-ecosystem function relationships in alpine grasslands across a degradation gradient on the Qinghai-Tibetan Plateau. Rangeland Journal, 37(1):45-55.

DOI

[48]
Wen L, Dong S, Li Y et al., 2013. Effect of degradation intensity on grassland ecosystem services in the alpine region of Qinghai-Tibetan Plateau, China. PLoS ONE, 8(3):e0058432.

[49]
Weng Q, 2012. Remote sensing of impervious surfaces in the urban areas: Requirements, methods, and trends. Remote Sensing of Environment, 117:34-49.

[50]
Wu Y, Zhang X, Shen L, 2011. The impact of urbanization policy on land use change: A scenario analysis. Cities, 28(2):147-159.

[51]
Xu H, 2013. A remote sensing urban ecological index and its application. Acta Ecologica Sinica, 33(24):7853-7862. (in Chinese)

[52]
Xu H, Wang M, Shi T et al., 2018. Prediction of ecological effects of potential population and impervious surface increases using a remote sensing based ecological index (RSEI). Ecological Indicators, 93:730-740.

[53]
Yang S, Liu C, Yang Z et al., 2002. Natural eco-environmental evaluation of eastern Qinghai-Tibet Plateau using RS and GIS. Journal of Geographical Sciences, 12(3):283-288.

[54]
Yang W, Wu X, Shi H et al., 2010. Research on alpine grassland degradation in the Three-river Headwaters Area based on TWINSPAN classification. Journal of Gansu Agricultural University, 45(6):139-143. (in Chinese)

[55]
Yao T, Thompson L G, Mosbrugger V et al., 2012. Third Pole Environment (TPE). Environmental Development, 3:52-64.

[56]
Yue H, Liu Y, Li Y et al., 2019. Eco-environmental quality assessment in China’s 35 major cities based on remote sensing ecological index. IEEE Access, 7:51295-51311.

[57]
Zhang H, Fan J, Wang J et al., 2018. Spatial and temporal variability of grassland yield and its response to climate change and anthropogenic activities on the Tibetan Plateau from 1988 to 2013. Ecological Indicators, 95:141-151.

[58]
Zhao Z, Zhang Y, Liu L et al., 2015. Recent changes in wetlands on the Tibetan Plateau: A review. Journal of Geographical Sciences, 25(7):879-896.

[59]
Zhu Z, Woodcock C, 2012. Object-based cloud and cloud shadow detection in Landsat imagery. Remote Sensing of Environment, 118:83-94.

Outlines

/