Identifying the scope of the Lhasa Metropolitan Area based on a spatial field energy model

  • WANG Zhenbo , 1, 2 ,
  • LI Jiaxin 1, 2 ,
  • LIANG Longwu 1, 2
Expand
  • 1. Institute of Geographic Sciences and Natural Resources Research, CAS, Beijing 100101, China
  • 2. College of Resources and Environment, University of Chinese Academy of Sciences, Beijing 100049, China

Wang Zhenbo, PhD and Associate Professor, specialized in urbanization. E-mail:

Received date: 2020-03-22

  Accepted date: 2020-07-31

  Online published: 2021-04-25

Supported by

Strategic Priority Research Program of the Chinese Academy of Sciences(XDA20040401)

The Second Comprehensive Scientific Investigation and Research on the Tibetan Plateau(2019QZKK1005)

Copyright

Copyright reserved © 2021. Office of Journal of Geographical Sciences All articles published represent the opinions of the authors, and do not reflect the official policy of the Chinese Medical Association or the Editorial Board, unless this is clearly specified.

Abstract

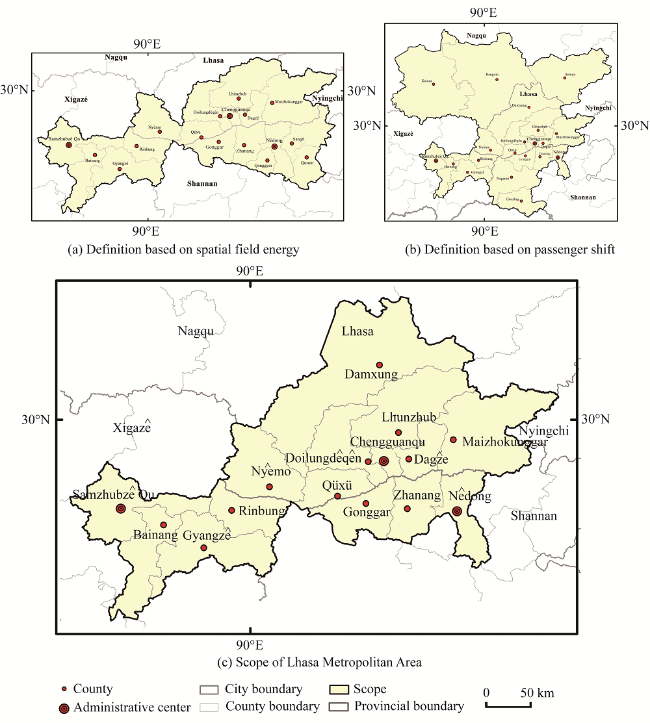
The cultivation and development of modern metropolitan areas with the aim of establishing new regional centers with competitive edge is a key objective for the new-type urbanization directions in China. The construction of the Lhasa Metropolitan Area is of great significance for the promotion of the South Asia Channel, the ‘Belt and Road’ initiative, the Bangladesh-China-India-Myanmar Economic Corridor, the Himalaya Economic Cooperation Zone, and for rapid development and long-term stability of the Qinghai-Tibet Plateau. This paper examines the scope of the Lhasa Metropolitan Area including Chengguanqu (Chengguan District), Doilungdeqen, Dagze, Lhunzhub, Damxung, Nyemo, Quxu, Maizhokunggar, Samzhubze Qu (Samzhubze District), Gyangze, Rinbung, Bainang, Nedong, Gonggar, and Zhanang using a spatial field energy model that combines nodality and accessibility indices and considers multiple indicators including traffic flow between cities. By combining factors such as the natural background, population agglomeration, the social economy, infrastructure construction, and the urban spatial structure of the Lhasa Metropolitan Area, it is proposed to build a bow-and-arrow-shaped urban system with ‘one core, two centers, one axis, and two wings’ along the valleys and the transportation trunk lines of the area. The study advocates the construction of a pure land industrial system comprising a green cultural and tourism-oriented plateau.

Cite this article

WANG Zhenbo , LI Jiaxin , LIANG Longwu . Identifying the scope of the Lhasa Metropolitan Area based on a spatial field energy model[J]. Journal of Geographical Sciences, 2021 , 31(2) : 245 -264 . DOI: 10.1007/s11442-021-1845-9

1 Introduction

The Tibet Autonomous Region is an important national security barrier, a key ecological security barrier as well as a key strategic resource and an agricultural plateau production base. The region is also a critical cultural protection site that encompasses Chinese national characteristics as well as an important world tourist destination (Fang et al., 2015). ‘Administering Tibet according to the law, enriching the people, reconstructing Tibet for the long term and speeding up the pace of building a prosperous society in Tibet is an important principle in Tibet’s development plan. It is clear that new urbanization is an important way for the Tibet Autonomous Region to realize economic development, ensure long-term stability, and build a prosperous society (Fang et al., 2015). Urban agglomeration is the main form of new urbanization (Ma et al., 2018; Wang et al., 2019). However, restricted by the special natural environment and the urban developmental conditions, Tibet does not possess the necessary foundations for cultivating an urban agglomeration over the short timescale. The metropolitan area, as a core spatial unit of urban agglomeration, is in the mid-term stage of urban agglomeration development (Fang et al., 2019). The National Development and Reform Commission issued Guiding Opinions on Cultivating and Developing Modern Metropolitan Areas in February 2019 and proposed ‘cultivating and developing modern metropolitan areas and forming new regional competitive advantages.’ This work further highlighted the key directions and pathway for urbanization in China for the new era. Indeed, with the rapid progress in urbanization and rapid economic development as well as a continuous increase of national infrastructural construction and investment on the Qinghai-Tibet Plateau, urban expansion within Lhasa has been rapid (Fan et al., 2010; Tang et al., 2017; Chen et al., 2018) while the agglomeration effect of regional central cities has also been continuously enhanced. Indeed, the Lhasa Metropolitan Area prototype with this provincial capital being the epicenter of agglomeration has taken an initial shape (Fang et al., 2015). In 2016, the national ‘13th Five-Year Plan’ (2016-2020) clearly proposed the promotion and development of the Lhasa Metropolitan Area. Thus, taking Lhasa as a focal point, actions to facilitate the gathering of people and to promote the radiating functions of this regional central city on the Tibetan Plateau, and thus, create a metropolitan area are considered inevitable, hence the urgent need is to realize new urbanizations with plateau characteristics in Tibet. This region will become the core node for the construction of the South Asia Channel, connecting the ‘Belt and Road’ initiative and the Bangladesh-China-India-Myanmar Economic Corridor, and for the promotion and the development of the Himalaya Economic Cooperation Zone in Tibet.
Metropolitan areas are city regions consisting of a core city linked to the surrounding hinterland and associated cities. These areas are internally related closely in space, interdependent in function, and tend to be integrated. There is no established administrative boundary and thus the study of a metropolitan area should first seek to clarify its spatial scope (Sun, 2003; Lan et al., 2006; Fragkias et al., 2009). A clear and rational spatial scope is the key to ensuring a reasonable flow of elements as well as the dislocation and integration of functions between a central city and its hinterland, cities and their counterparts within a metropolitan area, and to achieve coordinated and integrated development (Yao et al., 2006; Chen et al., 2015). Therefore, research on the spatial scope of a metropolitan area is of great significance. Research concerning the definitions of the metropolitan area can be roughly divided into qualitative and quantitative categories. The first of these, qualitative research, has mainly involved the selection of indicators and presented the corresponding judgment criteria to identify the scope of a metropolitan area. Factors to consider include urban density, population size and density, urban infrastructure, rate of commuting, land use, industrial development, and urban functions. The most representative research on the scope for spatial development of urban agglomerations in overseas countries based on such indicators mainly concern metropolitan areas in North America, Japan, and Asia (Gottmann, 1957; McGee, 1991; Liu, 2003; Wei et al., 2005). Indeed, ever since Zhou Yixing proposed five major standards for urban economic zone statistics in 1986, Zhou Yixing et al. (1995), Sun Yinshe (1992), Hu Xuwei et al. (2000), Yao Shimou et al. (2006), Fang Chuanglin (2009), Ning Yuemin (2011), Huang Jinchuan et al. (2014), and others have conducted further in-depth research on the definitions of the scope of metropolitan areas. In contrast, quantitative research mainly utilizes models to identify the scope of metropolitan areas. Martin (1998) is typical of researchers who used the model approach to identify the spatial scope. He proposed the use of various population and socio-economic data to establish the boundaries of the metropolitan area by means of computational simulation. Gu et al. first used the model method to define urban dense areas in China (Chen and Huang, 2015). These researchers used the random distribution model to undertake a more scientific study on the urban spatial distribution types of various provinces and regions in 1985 (Gu, 1992). In recent years, the model approach has been widely used for identification of metropolitan areas. Time, space, flow, and gravity are the core elements to be considered in the scope for a definition (Sun, 2003). Gravity (Yang et al., 2000), field strength (Zhang, 2005), the Voronoi diagram, and space field energy models (Huang, 2016) are the main applications.
The research objects concerning the definition of the spatial scope for the metropolitan area of Llasa are mainly concentrated in the central and eastern regions. The Lhasa Metropolitan Area on the Qinghai-Tibet Plateau remains unstudied from this perspective. In addition, compared with other methods and models, the spatial field energy model is more comprehensive. In this approach, an index system is constructed from multi-dimensions to measure and calculate values for the nodality index which can then be used to depict the influence of a central city more comprehensively. Accessibility is then used to assess comprehensively the difficulty and time costs of element ‘flow’ in an urban spatial network. The result in this case is also more objective as high altitude and great height difference characteristics exist across the study area; furthermore, the highways and railways are poorly connected with the outside world apart from the principal entry and exit points which are taken into account fully in this approach. In addition, a metropolitan area is a complex socioeconomic system which becomes more and more integrated over time. All kinds of ‘flow’ processes that exist objectively can then be used to assess accurately the compactness of inter-city linkages based on the people’s subjective will. However, the spatial field energy model can only be used to reflect static interactions between cities and cannot truly depict ‘flow’ between entities (Sun et al., 2018), where, in this study, the traffic flow elements were employed to identify the scope of the metropolitan area and to ensure the generation of more realistic results.
This study takes the Lhasa Metropolitan Area as the research object and constructs an index system based on four dimensions of economic and social development including resource utilization, and the ecological environment to calculate the urban nodality index. Measurement of the regional spatial field energy was via a K-order data field model based on the regional accessibility of nodal cities within the area. At the same time, traffic flow factors based on highway passenger traffic movements were also evaluated to identify and define the spatial scope of the Lhasa Metropolitan Area. A cultivation pathway was then produced to provide a reference for the future planning and construction of new urbanization on the Qinghai-Tibet Plateau.

2 Study area and data sources

2.1 Study area

The Tibet Autonomous Region is located in the southwestern portion of the Qinghai-Tibet Plateau (26°50′N-36°53′N, 78°25′E-99°06′E). This region borders Xinjiang in the north, Sichuan in the east, Qinghai in the northeast, and Yunnan in the southeast and is flanked by Myanmar, India, Bhutan and Nepal, as well as other countries and regions. A land border of more than 4000 km surrounds this region, and the average elevation is more than 4000 m. The Tibet Autonomous Region is known as ‘the roof of the world’ and includes seven cities, Lhasa, Xigaze, Qamdo, Nyingchi, Shannan, Nagqu, and Ngari, which comprise a total area of about 1,202,200 km2. This region is the second largest province in China (Figure 1).
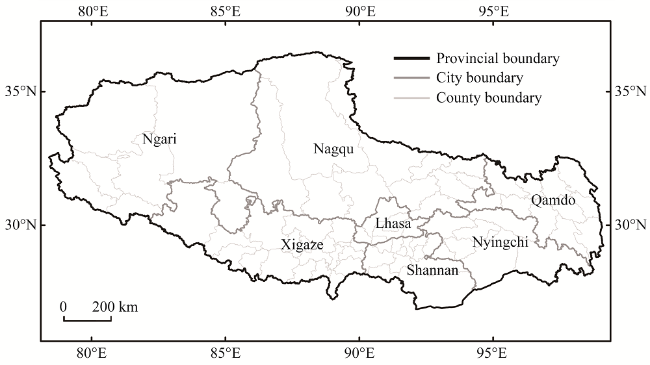
Figure 1 Map illustrating the spatial scope of the Tibet Autonomous Region
The permanent population of the Tibet Autonomous Region in 2016 was about 3.31 million, the urban population was 980,000, and the GDP was 115 billion yuan, accounting for 0.24%, 0.12%, and 0.15% of the national total, respectively. The total GDP in 2016 increased by 10% from the previous year, rising higher than the national average (6.7%) by 3.3%. The urbanization rate within the Tibet Autonomous Region was 29.61% at this time point, however, far below the national average of 57.35%. This region is a key area for both the opening up and development within Chinese border areas as well as being a strategic hub and an important channel for the nation’s opening up into South Asia. The Tibet Autonomous Region is also an important gateway as part of the Bangladesh-China-India-Myanmar Economic Corridor because of its important strategic location.

2.2 Data sources

The index evaluation system data used in this study were mainly derived from the 2016 Statistical Communique of the National Economic and Social Development in the Tibet Autonomous Region and various municipalities, the Tibet Statistical Yearbook (2017), the China County Statistical Yearbook (2017), the China City Statistical Yearbook (2017), and the China Urban Construction Statistical Yearbook (2017). Some missing data were supplemented by exponential smoothing. The traffic network data were derived from the road vector data of the national 1:1,000,000 basic geographic data provided by the National Catalogue Service for Geographic Information. The overall current situation of the data is for 2015 (http://www.webmap.cn/main.do?method=index). The route for the Lhasa-Nyingchi Railway was obtained by vectorization of the “13th Five-Year” (2016-2020) national railway planning and construction plan, while digital elevation model (DEM) topographic data were extracted from the International Scientific Data Mirroring Website of the Computer Network Information Center of the Chinese Academy of Sciences. Passenger traffic data were extracted from the passenger traffic movement schedules of Lhasa Bus Station, Lhasa East Suburb Bus Station, and Lhasa North Suburb Bus Station.

3 Methods

The space field energy model was the main research method used in this study. In this context, spatial field energy refers to the influence (or driving capability) of a central city on the surrounding cities and, therefore, provides an assessment of the development potential. In other words, the stronger the space field energy, the greater the development potential of a city. The theories of the point-axis system and regional interaction both state that a central city is the growth pole for regional development; this entity, therefore, relies on its strong attraction and radiating forces to ensure that the people, the logistics, the capital, and information all flow, agglomerate, and spread. A central city will also interact with its neighbors via various channels and will drive the development of peripheral areas. Generally speaking, the radiating and diffusion effects of the central city can be reflected by the field strength; the peripheral areas are affected by the superposition of multiple central cities at the same time, and the superposition of the field strength can be reflected by the potential energy (Guan et al., 2012). The regional spatial field energy is closely related to the influence of a central city as well as accessibility, and is calculated as follows (Lu et al., 2013):
$E_{ij}^{\text{k}}=\frac{{{Z}_{k}}}{{{\left( D_{ij}^{k} \right)}^{\alpha }}}\begin{matrix} {} & {} & {} \\ \end{matrix}{{F}_{ij}}=\sum\limits_{k=1}^{k}{E_{ij}^{k}}\cdot {{\lambda }_{k}}$
where (i, j) denotes the location of any point within a given space, while $E_{ij}^{k}$indicates the field strength of the central city k, Zk denotes the influence of the city, calculated by the nodality index (i.e., the energy index of a city (Zhao et al., 2016), $D_{ij}^{k}$is the distance between the central city and a peripheral point, represented by the regional accessibility time cost, α is the coefficient of friction, and where α = 1.0 based on the method proposed by Li (2011) and Xingliang (2012). Similarly, Fij denotes the potential energy at any point in space (i.e., space field energy), and λk is the weight of influence of the central city k, which is determined by the relative size of the nodality index.
The aim of this research is to calculate the nodality indices for seven cities as well as the time cost in each case to reach any point (21,127 ×14,420) in space. The radiating field strength of each city to any spatial point is then calculated and the space field energy of each point is then superimposed.

3.1 Accessibility

Regional accessibility reflects an individual’s ability to move around in space (Deichmann, 1997; Wang et al., 2010), and reflects the difficulty of reaching a particular geographic location from a certain spatial position (Hansen, 1959; Goodall, 1987; Kim et al., 2003). Accessibility has been extensively studied in the context of urban agglomeration (Tao et al., 2016; Cha et al., 2017) and regional development (Shen, 1998; Mackiewicz et al., 2003). Accessibility is calculated here by the weighted cost distance method using raster data. Thus, the traffic road network was first rasterized and grid pixels were set to 100 m × 100 m before the average driving speeds for various transportation modes were assigned (Table 1) based on the intended design speed for the road; a network cost raster map was then generated. As this study area exhibits a number of special characteristics including high altitude, a high height difference, steep ground slopes, and various route developments, the terrain and slope elements were fully considered in the accessibility calculations. Thus, as altitude increases, air pressure and air density both gradually decrease, resulting in a reduction in engine compression and power. This effectively means that for every 1000 m increase in altitude, the atmospheric pressure drops by about 11.5%, the density of air decreases by about 9%, and power falls by about 10%. Vehicle speed was, therefore, held at its original value when the altitude was below 3000 m; thereafter, the speed resorted to 90% of its original value when the altitude was between 3000 and 4000 m, 80% for altitudes between 4000 and 5000 m, and 70% when the altitude was below 5000 m. Travel speeds in contiguous land areas that lack road passing points were also defined as related to ground slope. A slope map was, therefore, generated from the DEM terrain data and inclines were divided into three categories, i.e., 0-3, 3-20, and 20-90, which corresponded to speeds of 5 km/h, 4 km/h, and 3 km/h, respectively. Incorporating the characteristics of highways and railways that do not link with the surrounding roads apart from at entry and exit points, a 250-m expressway and railway buffer zone was set and assigned a low speed of 0.1 km/h (so that the cost distance calculation in this case does not pass through the buffer zone and enters the highways and high-speed railway lines). Similarly, a zone of 300 m was set to buffer the entry and exit points to break through the isolation area and ensure that it can only communicate externally at the entry and exit points (Yu, 2017). The Lhasa-Nyingchi Railway, which is under construction, was also incorporated into this analysis and assigned a design speed of 160 km/h. The time cost raster data for each layer were superimposed to obtain a grid of spatial features.
Table 1 Main traffic mode driving speed data for the Tibet Autonomous Region (2016)
Transportation Lhasa-
Nyingchi Railway
Other railways Highways National roads Provincial roads County roads Townships and village roads Other roads Waters
Speed km/h 160 120 100 80 60 40 35 30 1

3.2 Nodality index

The nodality index refers to the absolute importance of a city (Preston, 1970; Marshall, 1989), and is an indicator of a city’s overall strength. A higher index value means a city will have an enhanced ability to influence the peripheral areas. The nodality index has played an important role in the study of urban administrative divisions (Zhao et al., 2016), spatial evolution (Yan et al., 2004), and hierarchical systems (Zhou et al., 2001). Indeed, based on the connotation of a nodular index, the selection principle (i.e., systematic, comparability, comprehensiveness, and operability), and the results of previous research, a total of 15 indicators were selected that span four dimensions. The comprehensive evaluation system that underpins this index (Table 2) aims to reflect the influence of a central city on the peripheral areas in a comprehensive and objective way.
Table 2 Comprehensive system used to calculate the urban nodality index
Target layer Primary indicator Secondary indicators Unit
Urban
nodality index
Economic development status GDP (X1)
Output value of primary and secondary industries (X2)
Total investment of fixed assets (X3)
Public revenue (X4)
10,000 yuan
10,000 yuan
10,000 yuan
10,000 yuan
Social development status Number of employees in secondary and tertiary industries (X5)
Per capita GDP (X6)
Surplus of residents’ deposits (X7)
Number of mobile phone users (X8)
Number of beds in medical and health institutions (X9)
Number of students in secondary vocational education (X10)
10,000 people
Yuan
10,000 yuan
Household
People
People
Resource utilization status Area of agricultural facilities (X11)
Total water supply (X12)
Penetration rate for gas supply (X13)
10,000 ha
10,000 t
%
Ecological environment status Annual good air quality rate (X14)
Discharge achievement rate for industrial wastewater (X15)
%
%
Raw data were standardized using the deviation method to eliminate any dimensional influence and to ensure comparability in the nodality index (Liang et al., 2019). The nodality index was calculated as follows:
$X_{kj}^{*}=\frac{{{X}_{kj}}-\min \ ({{X}_{j}})}{\max \ ({{X}_{j}})-\min \ ({{X}_{j}})}\times 60+40$
where X*kj denotes a new value following dimensionless processing of the city, k, and index, j, while Xkj denotes an original value after dimensionless processing, max(Xj) and min(Xj) refer to the maximum and minimum values of the indicator j for all cities, respectively, k=7, j=15. To create the nodule index range [40, 100], the constant term was set to 40 and the model coefficient was set to 60.
Principal component analysis (PCA) was then used to weight each index. Thus, selected PCs were weighted and accumulated using eigenvalues to calculate a comprehensive scale value. Factors with eigenvalues greater than 1 were then extracted and variance maximization rotation was performed to minimize the number of variables exerting a higher load on each factor. The formula for calculating the city nodularity index was:
${{Z}_{k}}=\sum\limits_{i=1}^{M}{\left[ {{A}_{i}}\times \sum\limits_{j=1}^{20}{{{C}_{ij}}\times X_{kj}^{*}} \right]}$
where Ai denotes the contribution rate of each PC, while M is the number of PCs with eigenvalues greater than 1, and Cij refers to the load of the first PC on the first variable. The remaining variables are the same as in Equation (2).

4 Results

4.1 Nodality index analysis

The urban nodality index denotes the radiating effect and the influencing capability within a given area. The data generated in this analysis suggest that spatial differences in the nodality index are significant in all seven Tibetan cities (Table 3). Lhasa, exhibiting the highest nodality index (96.00), is the region’s central city and shows the strongest radiating and influencing effects. The cities of Qamdo (66.40) and Xigaze (64.39) are in the second and third places, respectively, and have developed as important growth poles within Tibet. The third echelon cities of Nyingchi (59.36) and Shannan (58.43) are also important supporting locations in southern Tibet. Nagqu and Ngari are located on the remote northern Tibetan Plateau, and exhibit low nodality index values of 48.08 and 45.74, respectively, reflecting weak radiating and influencing abilities.
Table 3 Nodality index data for central Tibetan cities (2016)
City Economic
development
Social development Resource
utilization
Ecological
environment
Composite
index
Lhasa 100.00 100.00 94.15 89.85 96.00
Qamdo 56.60 56.68 52.32 100.00 66.40
Shannan 53.76 53.08 62.08 64.79 58.43
Xigaze 60.61 65.52 68.20 63.22 64.39
Nagqu 47.36 50.73 54.22 40.00 48.08
Ngari 40.00 43.81 40.00 59.13 45.74
Nyingchi 51.41 54.58 60.36 71.10 59.36
The different Tibetan cities are endowed in different ways. Lhasa has the highest value in terms of economic development, social development, and resource utilization as it boasts the highest level of economic and social development and resource utilization and has the best basic public services across this region. In terms of the ecological environment, Qamdo has the highest value, followed by Lhasa and Nyingchi. In contrast, the economic and social development seen in the city of Ngari remains backward due to the high altitude, the harsh natural environmental conditions, and limited resource exploitation and utilization. This city has the lowest economic, social, and resource index values. Nagqu is the main area within Tibet that generates livestock products as it boasts relatively well-developed agriculture and animal husbandry facilities even though the ecological environment of this region remains very fragile. Coupled with long-term overgrazing and excessive excavation, the ecological environment index of this zone remains the lowest within the region.

4.2 Accessibility analysis

An accessibility value for each time cycle (Table 4) denotes the area traveled from various Tibetan cities within one hour. These values are used to characterize city accessibility. Thus, according to the goal of building a 'three-hour comprehensive traffic circle' by 2020, proposed in the '13th Five-Year Development Plan for Comprehensive Transportation of the Tibet Autonomous Region,' the accessibility characteristics of the Lhasa Metropolitan Area were analyzed here using the three-hour circle. The data show that the circles for the cities of Xigaze and Lhasa are the largest, 51,423 km2 and 42,869 km2, respectively, while those for Ngari and Nyingchi are the smallest, 24,748 km2 and 24,263 km2, respectively. The reason for these results is that Lhasa and Xigaze are the regional central cities and are important growth poles within Tibet, respectively, and therefore have better transportation and connecting infrastructure. The extremely cold weather and anoxic conditions best characterize Ngari which has complex geological structures and frequent geological disasters, while problematic transportation infrastructure characterizes Nyingchi; accessibility of the latter two cities is, therefore, weak. The results show that the three-hour journey to Lhasa is centered on Chengguanqu (Chengguan District) and encompasses Dagze, Quxu, Doilungdeqen, Lhunzhub, Maizhokunggar, Damxung, Nyemo, Gonggar, Zhanang, Nedong, Sangri, Qusum, Qonggyai, Nagarze, Samzhubze Qu (Samzhubze District), Rinbung, Gyangze, Bainang, Namling, Gongbo'gyamda, and other counties (Figure 2).
Table 4 Accessibility areas (km2) based on hourly circles (h) in central Tibetan cities (2016)
City Hourly circles
0-0.5 0.5-1 1-3 3-5 5-10 0-3
Lhasa 835.79 2,471.00 39,562.14 81,896.36 323,544.99 42,868.93
Qamdo 703.20 2,369.32 29,778.12 53,298.18 171,777.02 32,850.64
Shannan 622.77 2,686.78 26,545.55 67,624.68 272,086.19 29,855.10
Xigaze 1049.03 3,712.42 46,661.68 93,688.61 309,438.58 51,423.13
Nagqu 495.80 1,682.40 23,001.01 49,227.15 289,890.96 25,179.21
Ngari 585.85 1,809.42 22,352.47 43,770.81 162,549.89 24,747.74
Nyingchi 510.70 1,567.04 22,184.77 52,649.61 303,998.07 24,262.51
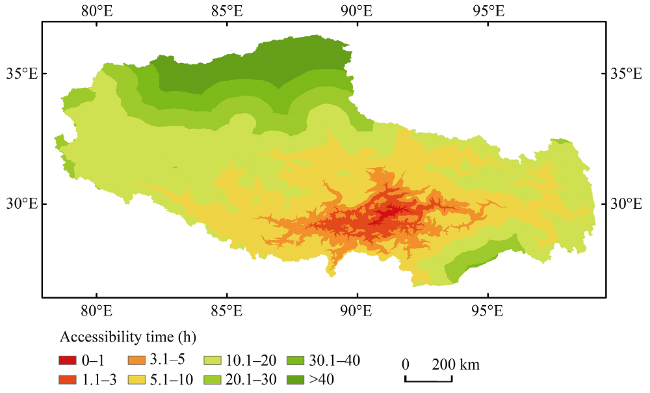
Figure 2 Map showing the accessibility distributions at different time cycles for the city of Lhasa, Tibet (2016)

4.3 Spatial field energy characteristics

Spatial field energy is the result of interactions between the nodality index and regional accessibility. It, therefore, reflects the influence or driving capacity of central cities on the surrounding ones as well as the urban development potential. Spatial field energies for Tibetan cities were calculated here using a field energy model via the ArcGIS spatial analysis tool (Figure 3).
Figure 3 Map showing the spatial distribution patterns of field energy across Tibet (2016)
Spatial field energy across Tibet is ‘high in the southeast and low in the northwest’ and conforms to a spatial structure of ‘one-core and multi-centers’ (Figures 3 and 4). The city of Lhasa is at the core of the Tibetan spatial field energy and has a value of 1.56, while other cities comprise secondary centers with values below 1 and weak radiating capacities (Table 5). As the Lhasa Metropolitan Area comprises a continuous high-value zone, the integration pattern between this city and Xigaze is clear and forms a ‘wing-like’ radiating diffusion pattern from the cores of Chengguanqu in Lhasa and Samzhubze Qu in Xigaze out into the surrounding areas (Figure 4).
Table 5 Spatial field energy values for central Tibetan cities (2016)
City Lhasa Qamdo Shannan Xigaze Nagqu Ngari Nyingchi
Mean 1.56 0.62 0.76 0.69 0.38 0.27 0.60
Standard deviation 2.50 0.81 0.62 0.51 0.25 0.15 0.51
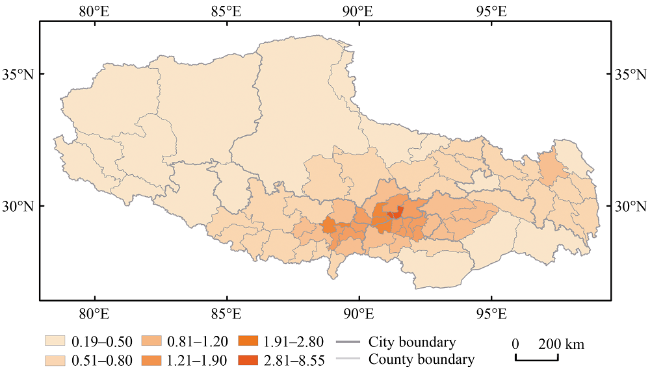
Figure 4 Hierarchical map showing the spatial field energies at the county level across Tibet (2016)

4.4 Definition of the scope of the Lhasa Metropolitan Area

The spatial field energy is an abstract concept that attempts to define the ‘potential energy difference’ produced by regional central cities and to drive the development of peripheral areas via regional contact ‘channels.’ This variable can be used to represent, comprehensively and objectively, the regional development patterns and spatial differences, and is, therefore, an effective way to define the scope of a metropolitan area. This model can only be used, however, to reflect static spatial interactions between cities and cannot truly depict dynamic or ‘flow’ processes. Thus, considering the spatial field energy and the comprehensive traffic flow factors when identifying the scope of a metropolitan area in this analysis, we may obtain the final scope by taking the intersection of the domains of two key scopes which have been extracted separately. In the context of the extraction of the spatial scope of flow factors, it is important to realize that the Lhasa Metropolitan Area is located on the Qinghai-Tibet Plateau and so inter-city transportation is still dominated by the road passenger networks. At the same time, data on information, funding, and technology remain difficult to collect, thus shifting schedules for highway passenger traffic were used to characterize these variables.
4.4.1 Scope: extraction based on spatial field energy
The spatial field energy values for Tibet were classified into five groups using the natural breakpoint approach. On this basis, the highest field energy area (>1.90) includes Chengguanqu, Doilungdeqen, Quxu, Dagze, Gonggar, and Samzhubze Qu, while the higher field energy areas (1.20–1.90) include 11 counties such as Maizhokunggar, Lhunzhub, Zhanang, Nedong, Bainang, and Gyangze. The middle field energy area (0.80–1.20) includes ten counties, such as, Damxung, Nagarze, Lhaze, and Karub Qu, while the lower field energy area (0.50–0.80) comprises 26 counties including Tingri, Yadong, Bomi, and Seni Qu. Finally, the lowest field energy area (≤0.50) includes 16 counties such as Zhongba, Amdo, and Medog (Figure 4). The data show that the both the highest and higher field energy areas within this region are located in the region of the Yarlung Zangbo River Valley and its tributaries; this region is the area containing the highest density of towns, the best foundation for industrial development, the most concentrated production facilities, and the strongest resource and environmental carrying capacities within Tibet. This region, therefore, contains regional growth poles and core nodes. In contrast, developmental conditions as well as environmental and resource carrying capacities within the mid-field energy area are slightly weak and this zone is located within the effective radiating range of both the highest and higher field energy areas. The lower and lowest field energy areas identified here tend to be widely distributed in the peripheries of high-altitude mountain glacier areas that are themselves characterized by fragile ecological environments, poor traffic accessibility, and weak socioeconomic development. Thus, to give full exposure to the driving effects of regional development in the highest and higher field energy areas and to ensure the integrity of administrative divisions, county areas with field energies above 1.20 were subdivided within the Lhasa Metropolitan Area (Figure 5a).
Figure 5 Map showing the spatial scope of the Lhasa Metropolitan Area
4.4.2 Scope: extraction based on traffic flow
Statistical data on passenger traffic movements at Lhasa Bus Station, Lhasa East Suburb Bus Station, and Lhasa North Suburb Bus Station show that passenger traffic to Bayip and Damxung occur most often, followed by routes to Nagqu, Lhunzhub, Maizhokunggar, and Gonggar, and then to Quxu, Nedong, Gyangze, and Samzhubze Qu. Cities with two or more passenger traffic movements per day are all located within the Lhasa Metropolitan Area. Thus, considering the continuity principle for the scope of the metropolitan area, Bayip should not be included within this zone (Figure 5b).
4.4.3 Scoping of the Lhasa Metropolitan Area
Preliminary results regarding the definition of the Lhasa Metropolitan Area were obtained from the overlapping and intersecting scoping domains based on the spatial field energy and the passenger traffic movements. Considering that Damxung is within Lhasa and is also an important city along the Golmud-Lhasa section of the direct Qingdao-Lhasa comprehensive transport corridor (in the context of the ‘National 13th Five-Year Development Plan of the Modern Integrated Transport System’), this city was included in the analysis. This resulted in the final composition of the Lhasa Metropolitan Area consisting of Chengguanqu, Doi-lungdeqen, Dagze, Lhunzhub, Damxung, Nyemo, Quxu, Maizhokunggar within Lhasa as well as Samzhubze Qu, Gyangze, Rinbung, Bainang of Xigaze, and Nedong, Gonggar, and Zhanang within Shannan (Figure 5c).

5 Developmental status and proposed cultivation pathway for the Lhasa Metropolitan Area

5.1 Developmental status

The urban system plan for the Tibet Autonomous Region (2008-2020) encompasses the construction of a framework consisting of ‘one-line, one-piece, one-center and multi-points’ urban components. In this context, Lhasa City is the ‘one-center’ while the ‘one-piece’ comprises the Yarlung Zangbo River and its tributaries, the Lhasa, Nyangqu, and Yalong rivers as well as the central Nyang River Basin which encompasses an area of 120,000 km2. The Lhasa Metropolitan Area encompasses ‘one heart’ (Lhasa City) as well as central areas of this ‘one piece’; this region covers an area of 48,000 km2 and represents the core urban system area of the Tibet Autonomous Region.
Urbanization of the Lhasa Metropolitan Area has been steadily and rapidly advancing in recent years. The urbanization rate of this region increased from 35% in 2000 to 44% in 2016, and the proportion of urban land under construction increased from 0.09% in 2000 to 0.16% in 2016. The speed of urban development can be divided roughly into two periods, that is, the slow growth period from 2000 to 2010 and the fast growth period from 2010 to 2016. The momentum of economic development in this region is also good. The GDP and per capita GDP showed a steady upward trend from 2000 to 2016 and increased rapidly after 2010. The GDP increased from 4.7 billion yuan in 2000 to 52.5 billion yuan in 2016, an increase of 1017%. The per capita GDP rose steadily from 5627 yuan in 2000 to 49,250 yuan in 2016, an increase of 775%. The proportion of the added value of secondary and tertiary industries is on the rise as a whole, and the industrial structure is constantly being optimized. There has also been a clear trend in population agglomeration. The population density increased from 16.98 people/km2 in 2000 to 21.91 people/km2 in 2016, eight times that of Tibet (2.69 people/km2) as a whole (Figure 6).
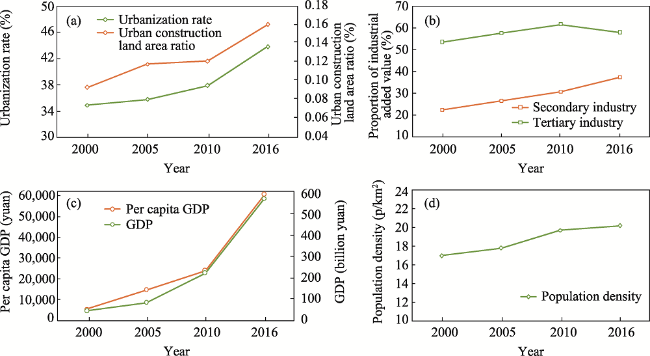
Figure 6 Main development indicators of the Lhasa Metropolitan Area from 2000 to 2016
The population of this region remains highly concentrated in Lhasa and the prefecture-level capital cities, and the sizes of these cities remain generally small although there are large differences in size. The total population of the Lhasa Metropolitan Area was 930,000 in 2016, accounting for 30% of the total population of Tibet. This area is the main place where people gather. The population distribution in counties within this metropolitan area is uneven; the total number of people living within Lhasa in 2016 was 490,000 with more than half of the total population being within the extended metropolitan area. Spatial differences in population density are very prominent and conform to a pattern of being high in the south, low in the north, and higher in the prefecture-level city capitals. The highest population density was in Chengguanqu with 303.82 people/km2, this level being 16.21 times the average level of the metropolitan area.
The unique location of the Tibetan Plateau explains the low overall level of economic development within the Lhasa Metropolitan Area; secondary and tertiary industries are highly concentrated within Lhasa and the prefecture-level city capitals. The GDP of the metropolitan area was 52.5 billion yuan in 2016, representing 63% of the entire Tibetan productivity and, therefore, dominant within the economic development of Tibet. Output values for primary, secondary, and tertiary industries were 28.12 billion, 18.879 billion, and 30.811 billion yuan, respectively, accounting for 5.33%, 36.08%, and 58.88% of the totals. This region encompasses a highly concentrated zone containing secondary and tertiary industries within the autonomous region. Spatially, the total economic output as well as secondary and tertiary industries are highly concentrated within Lhasa and prefecture-level city capitals, while primary industries are widely distributed in western and northern regions. Fixed asset investment is generally higher in the east and lower in the west; this kind of investment is especially highly concentrated along the Lhasa-Nyingchi Railway from Chengguanqu to Maizhokunggar but is weak in other areas (Figure 7).
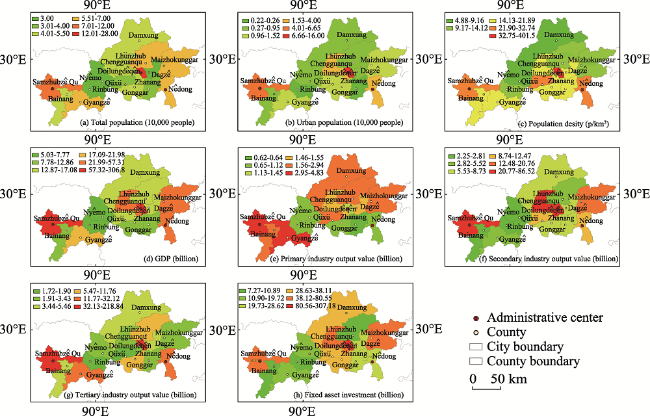
Figure 7 Maps showing the spatial distribution of the population and the main economic indicators within the Lhasa Metropolitan Area (2016)

5.2 A cultivation pathway for the Lhasa Metropolitan Area

Establishing the Lhasa Metropolitan Area is the key task proposed in the ‘National 13th Five-Year Plan.’ At the same time, an important aspiration of the ‘13th Five-Year Plan of the Tibet Autonomous Region’ is to complete the construction of a three-hour economic circle for the Lhasa Metropolitan Area. Completing this project is necessary to ensure border security, build an economic corridor between Bangladesh, China, India, and Myanmar, and cre-ate an important hub to open up China to South Asia. The developmental pathways can, therefore, be proposed based on the special geographical environment and location as well as the particular problems which occur in the development stage of the special urbanization of this metropolitan area.
5.2.1 Developing a ‘one core, two centers, one axis, and two wings’ bow-and-arrow- shaped urban system along the valleys and transportation trunk lines
The Lhasa Metropolitan Area has the highest agglomeration density in Tibet even though it has a complex natural environment. The river valley within this system forms a meeting place for people living on the plateau as well as being the only route for transportation lines. The urban development layout of this region relies heavily on both valley space and transportation development. This means that 90% of Tibetan cities and towns are located on the main transportation trunk lines such that a beaded-type urban system is formed along the river valley and the traffic trunk lines. On this basis, a ‘one core, two centers, and multi nodes’ urban system with Lhasa as the core city within the metropolitan area alongside Samzhubze Qu within Xigaze and Nedong Qu within Shannan as centers and other county towns as nodes has developed.
The main axis of the Lhasa Metropolitan Area can be configured by taking the Lhasa-Xigaze Railway and the National Highway 318 as axes and then creating an integrated region which includes Maizhokunggar, Dagze, Chengguanqu, Quxu, Nyemo, Rinbung, and Samzhubze Qu. Taking the National Highway 109 and the Qinghai-Tibet Railway as axes, which link Chengguanqu, Yangbajing, and Damxung, then the northern wing axis of the metropolitan area can also be configured. This axis can be extended to construct the southern wing axis of the metropolitan area by taking the Provincial Highway 101 along the Yarlung Zangbo River as well as the Lhasa-Nyingchi Railway as an axis, which then connects Gonggar, Zhanang, and Nedong. A bow-and-arrow-shaped beaded-type urban spatial pattern of 'one axis, two wings' is then formed. Taking into account the current situation of small-scale populations, the growth boundaries and the population red lines of cities and towns at all levels can then be determined on the basis of regional resource endowments and environmental carrying capacities. It is, therefore, necessary to emphasize the development of the core and central cities, and actively promote Maizhokunggar, Lhunzhub, Doilungdeqen, Dagze, and Gyangze and coordinate the development of Gonggar, Quxu, Damxung, and Zhanang, as well as Nyemo and Rinbung. This will enable authorities to steadily guide the population from agricultural, pastoral, and low-carrying capacity areas into the 'one axis, two wings' and 'one core, two centers, and multi-nodes' towns, accelerate the integration of infrastructure, industry, marketing, planning, management and services, and form a healthy and rational urban system featuring plateau characteristics (Figure 8).
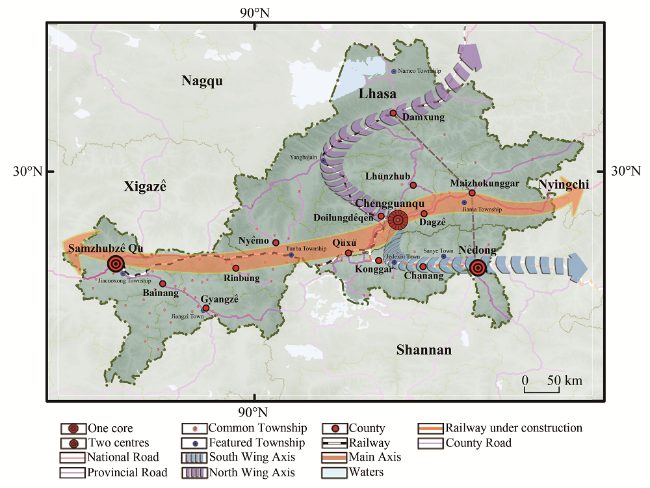
Figure 8 Urban system structures within the Lhasa Metropolitan Area
5.2.2 Constructing a green cultural and tourism-oriented plateau and a pure land industrial system
The major aspiration of ‘protecting the last pure land in the world and realizing a beautiful Qinghai-Tibet Plateau’ reflects the considerable importance attached to the long-term development and stability of the Qinghai-Tibet Plateau. Building a green ecological pure land industrial system is an inevitable choice to enhance the self-hematopoietic functions of the Qinghai-Tibet Plateau and to transform this region into a beautiful area. The Lhasa Metropolitan Area is the processing and trade center for agricultural products within Tibet as well as being a highly concentrated area containing secondary and tertiary industries. This region is also the frontier for building the plateau pure land industrial system. The tertiary industries with the largest proportion being within the Lhasa Metropolitan Area are benefited mainly by receiving the support of the special national financial policy as well as local aid policies to Tibet. This region relies mainly on traditional services, lacks producer services, and suffers from insufficient development and uptake of the high-quality cultural tourism resources which currently belong to a typical ‘government-supplied’ or financially-driven development model. The Lhasa Metropolitan Area also contains globally scarce multi-cultural tourism resources; in 2016, the total income from tourism industries in this area was 33.075 billion yuan, 28.8% of total Tibetan GDP. Tourism is now the most important industry within this region. Analyzing the resource endowment structure and comparative advantages of the Qinghai-Tibet Plateau while focusing on the main goal of protecting the ecological environment and characteristic cultures means that it is possible to adapt to the positive advantages of industrial development as well as local conditions and take advantage of the prevailing circumstances. This will enable the region to establish a mutually supportive and complementary 1+6 pure land industrial system with a green cultural tourism industry at its center, and supported by biological industries, clean energy industries, modern service industries, high-tech digital industries, commercial circulation industries, and pure land green industrial networks as extensions to support the construction of a beautiful Qinghai-Tibet Plateau.

6 Conclusions and discussion

6.1 Conclusions

(1) The spatial field energy of Tibet conforms to a spatial pattern of 'high in the southeast and low in the northwest' as well as a spatial structure of 'one-core and multi-center' around Lhasa as the core region. Given that the Lhasa Metropolitan Area comprises a contiguous high-value zone, there is evidence of clear integration between Lhasa and Xigaze and the region, which has a 'wing-like' pattern with the pattern radiating and diffusing from the cores of Chengguanqu within Lhasa and Samzhubze Qu within Xigaze out into the surrounding areas. Thus, considering traffic flow factors based on passenger traffic movements, the spatial scope of the Lhasa Metropolitan Area is defined as 15 counties including Chengguanqu, Doilungdeqen, Dagze, Lhunzhub, Damxung, Nyemo, Quxu, and Maizhokunggar within Lhasa as well as Samzhubze Qu, Gyangze, Rinbung, and Bainang within Xigaze, alongside Nedong, Gonggar, and Zhanang within Shannan.
(2) The Lhasa Metropolitan Area covers an area of 48,000 km2, which is the core area of the urban system of the Tibet Autonomous Region. The total population in this region accounts for 30% of the total for Tibet, and the population density is some eight times that of Tibet; and the city of Lhasa is the main place where people gather and socialize. The urbanization rate of this region increased from 35% in 2000 to 44% in 2016, 14% higher than the average level for Tibet, and in recent years, the urbanization process has been steadily and rapidly advancing. The momentum of economic development in this region is also good. The GDP increased from 4.7 billion yuan in 2000 to 52.5 billion yuan in 2016, which comprises 63% of the entire Tibetan productivity and, therefore, is dominant within the economic development of this autonomous region. Also, this region encompasses a highly concentrated zone containing secondary and tertiary industries within the autonomous region.
(3) Incorporating the natural background, population agglomeration, social economy, infrastructure construction, urban spatial structures, and other factors associated with the Lhasa Metropolitan Area, a core development path is proposed for the area that comprises building ‘one core, two centers, one axis and two wings’ bow-and-arrow-shaped urban system along the valleys and transportation trunk lines and constructing a green cultural and tourism-oriented plateau pure land industrial system.

6.2 Discussion

Based on the spatial field energy model that combines nodality and accessibility indices, and from comprehensive consideration of multi-indicators including traffic flow between cities, this research has been able to identify a range of factors that influence the development of the Lhasa Metropolitan Area. This method can characterize, both comprehensively and objectively, the regional development patterns and the spatial differences and is, therefore, an effective means to identify the scope of the metropolitan area.
It is noteworthy that the cost friction coefficient in the field strength calculation formula was taken as 1 in this analysis to allow comparisons with existing literature. No uniform standard is available for this value, however, and it, therefore, remains subjective to a certain extent. Because of data availability issues, the accessibility calculations actually do not include an aviation component, while the traffic flow statistics ignore the contributions to travel movements from self-driving, un-registered vehicles and inter-city buses. These additional variables might influence the overall results of this analysis.
[1]
Brady S M, 2000. The Irish Urban System and Its Dynamics. Dubin: Department of the Environment and Local Government.

[2]
Bureau of Statistics of Tibet Autonomous Region, Tibet Survey Team of the National Bureau of Statistics, 2017. Tibet Statistical Yearbook . Beijing: China Statistics Press. (in Chinese)

[3]
Cha Kaili, Peng Mingjun, Liu Yanfang et al., 2017. Spatio-temporal evolution and correlation analysis of road network accessibility and economic contact in Wuhan Metropolitan Area. Economic Geography, 37(12):74-81, 210. (in Chinese)

[4]
Chen Shouqiang, Huang Jinchuan, 2015. Review of range recognition research on urban agglomerations. Progress in Geography, 34(3):313-320. (in Chinese)

[5]
Chen Tingting, Lang Wei, Chan Edwin et al., 2018. Lhasa: Urbanising China in the frontier regions. Cities, 74:343-353.

[6]
Deichmann U, 1997. Accessibility indicators in GIS. New York: United Nations Statistics Division, Department for Economic and Policy Analysis.

PMID

[7]
Department of Rural Socio-economic Investigation, National Bureau of Statistics, 2017. China Statistical Yearbook (county-level). Beijing: China Statistics Press. (in Chinese)

[8]
Department of Urban Socio-economic Investigation, National Bureau of Statistics, 2017. China City Statistical Yearbook. Beijing: China Statistics Press. (in Chinese)

[9]
Fan Jie, Wang Hongyuan, Chen Dong et al., 2010. Discussion on sustainable urbanization in Tibet. Chinese Geographical Science, 20(3):258-268.

[10]
Fang Chuanglin, 2009. Research progress and general definition about identification standards of urban agglomeration space. Urban Planning Forum, (4):1-6. (in Chinese)

[11]
Fang Chuanglin, Li Guangdong, 2015. Particularities, gradual patterns and countermeasures of new-type urbanization in Tibet, China. Bulletin of Chinese Academy of Sciences, 30(3):294-305. (in Chinese)

[12]
Fang Chuanglin, Liang Longwu, Wang Zhenbo, 2019. Quantitative simulation and verification of upgrade law of sustainable development in Beijing-Tianjin-Hebei urban agglomeration. Science China Earth Sciences, 62(12):1929-1947.

[13]
Fragkias M, Seto K C. 2009. Evolving rank-size distributions of intra-metropolitan urban clusters in South China. Computers, Environment and Urban Systems, 33(3):189-199.

[14]
Goodall B, 1987. Dictionary of Human Geography. London: Penguin.

[15]
Gottmann J, 1957. Megalopolis or the urbanization of the northeastern seaboard. Economic Geography, 33(7):189-200.

[16]
Gu Chaolin, 1992. China’s Urban System: History, Current Situation and Prospect. Beijing: The Commercial Press.

[17]
Guan Xingliang, Fang Chuanglin, Luo Kui, 2012. Regional economic development disparity of China: An application of spatial field. Scientia Geographica Sinica, 32(9):1055-1065. (in Chinese)

[18]
Hansen W G, 1959. How accessibility shape land use. Journal of American Institute of Planners, 25(2):73-76.

[19]
Hu Xuwei, Zhou Yixing, Gu Chaolin et al., 2000. Study on Spatial Aggregation and Diffusion in Urban-intensive Areas along China’s Coastal Areas . Beijing: Science Press. (in Chinese)

[20]
Huang Jinchuan, 2016. Identification of urban agglomeration in China based on radiation diffusion measurement. Economic Geography, 36(11):199-206. (in Chinese)

[21]
Huang Jinchuan, Liu Qianqian, Chen Ming, 2014. The identification of urban agglomeration distribution in China based on GIS analysis. Urban Planning Forum, (3):37-42. (in Chinese)

[22]
Kim H M, Kwan M P, 2003. Space-time accessibility measures: A geocomputational algorithm with a focus on the feasible opportunity set and possible activity duration. Journal of Geographical Systems, 5(1):71-91.

[23]
Lan Mu, Xiao Wang, 2006. Population landscape: a geometric approach to study spatial patterns of the US urban hierarchy. International Journal of Geographical Information Science, 20(6):649-667.

[24]
Liang Longwu, Wang Zhenbo, Li Jiaxin, 2019. The effect of urbanization on environmental pollution in rapidly developing urban agglomerations. Journal of Cleaner Production, 237:117649.

[25]
Liu Rongzeng, 2003. Retrospect and rethinking of the study of city-and-town concentrated area and interrelated concepts. Human Geography, 16(3):13-17, 51. (in Chinese)

[26]
Lu Shasha, Guan Xingliang, Wang Zhenbo et al., 2013. Spatial field of the Yangtze River Delta Economic Zone: An application of regional accessibility and data field. Geographical Research, 32(2):295-306. (in Chinese)

[27]
Ma Zhongjia, Ma Defu, 2018. Urban agglomeration will be the main form of new-type urbanization. People’s Daily, 2018-02-06. (in Chinese)

[28]
Mackiewicz A, Ratajczak W, 2003. Towards a new definition of topological accessibility. Transportation Research B, 30(1):47-79.

[29]
Marshall J U, 1989. The Structure of Urban Systems . Toronto: University of Toronto Press.

[30]
Martin D, 1998. Automatic neighbourhood identification from population surfaces. Environment and Urban Systems, 22(2):107-120.

[31]
McGee T G, 1991. The emergence of Desa-kota regions in Asia: Expanding a hypothesis. In: The Extended Metropolis: Settlement Transition in Asia. Hawaii: University of Hawaii Press

[32]
Ministry of Housing and Urban-Rural Development of the People’s Republic of China, 2017. China Urban Construction Statistical Yearbook. Beijing: China Statistics Press. (in Chinese)

[33]
Ning Yuemin, 2011. Definition of Chinese metropolitan areas and large urban agglomerations: Role of large urban agglomerations in regional development. Scientia Geographica Sinica, 31(3):257-263. (in Chinese)

[34]
Preston R E, 1970. Two centrality models. Yearbook of Association of Pacific Coast Geographers, 32(1):59-78.

[35]
Shen Q, 1998. Spatial technologies, accessibility, and the social construction of urban space. Computer, Environment and Urban Journal of Transport Geography, 4(4):227-238.

[36]
Sun Juan, 2003. Research for defining the scope of the metropolitan area: A case study of Nanjing Metropolitan Area. Urban Planning Forum, 4:73-77, 96. (in Chinese)

[37]
Sun Wei, Yan Dongsheng, Wu Jiawei, 2018. On the urban agglomeration scope definition method: A case study of the Yangtze River Delta. Geographical Research, 37(10):1957-1970. (in Chinese)

[38]
Sun Yinshe, 1992. Forming mechanism and delimitation of metropolitan area in China: A case study of Beijing. Acta Geographica Sinica, 47(6):552-560. (in Chinese)

[39]
Tang Wei, Zhou Tiancai, Sun Jian et al., 2017. Accelerated urban expansion in Lhasa City and the implications for sustainable development in a plateau city. Sustainability, 1499(9):1-19.

[40]
Tao Zhuolin, Yang Xiaomeng, Liang Jinshe, 2016. Impact of high-speed rail on land transportation accessibility of Yangtze River Delta. Economic Geography, 36(8):40-46. (in Chinese)

[41]
Wang Li, Deng Yu, Liu Shenghe et al., 2011. The study of urban spheres of influence based on improved field model and its applications: A case study of central China. Acta Geographica Sinica, 66(2):189-198. (in Chinese)

[42]
Wang Zhenbo, Liang Longwu, Sun Zhan et al., 2019. Spatiotemporal differentiation and the factors influencing urbanization and ecological environment synergistic effects within the Beijing-Tianjin-Hebei urban agglomeration. Journal of Environmental Management, 243:227-239.

PMID

[43]
Wang Zhenbo, Xu Jiangang, Zhu Chuangeng et al., 2010. The county accessibility divisions in China and its correlation with population distribution. Acta Geographica Sinica, 65(4):416-426. (in Chinese)

[44]
Wei W, Zhao G R, 2005. Research on the patterns of Japanese metropolitan circles: A literature review. Contemporary Economy of Japan, 140(2):40-45.

[45]
Yan Xiaopei, Lin Zhangping, 2004. The change of spatial disparities of urban development in China, 1990s. Acta Geographica Sinica, 59(3):437-445. (in Chinese)

[46]
Yang Kaizhong, Li Guoping, 2000 . Sustainable Capital: Development Strategy of Beijing in the New Century. Guangzhou: Guangdong Education Press. (in Chinese)

[47]
Yao Shimou, Chen Zhenguang, Zhu Yingming et al., 2006. The Urban Agglomeration of China . Hefei: Press of University of Science and Technology of China. (in Chinese)

[48]
Yu Ce, 2017. Optimization research on railway route scheme in high altitude and large elevation difference mountain area based on GIS and accessibility[D]. Chengdu: Southwest Jiaotong University. (in Chinese)

[49]
Zhang Zhaotang, 2005. Research on the Development of China’s Capital Circle . Beijing: Peking University Press. (in Chinese)

[50]
Zhao Biao, Zhuang Rulong, Wang Shichen, 2016. The optimization study of the administrative area of Jiangsu province based on the spatial field energy. Economic Geography, 36(6):8-17. (in Chinese)

[51]
Zhou Yixing, Shi Yulong, 1995. Toward establishing the concept of physical urban area in China. Acta Geographica Sinica, 50(4):289-301. (in Chinese)

[52]
Zhou Yixing, Zhang Li, Wu Yue, 2001. Study of China’s urban centrality hierarchy. Areal Research and Development, 20(4):1-5. (in Chinese)

Outlines

/