Population migration across the Qinghai-Tibet Plateau: Spatiotemporal patterns and driving factors

  • WANG Nan , 1, 2 ,
  • WANG Huimeng 1, 2 ,
  • DU Yunyan 1, 2 ,
  • YI Jiawei , 1, 2, * ,
  • LIU Zhang 1, 2 ,
  • TU Wenna 1, 2
Expand
  • 1. State Key Laboratory of Resources and Environmental Information System, Institute of Geographic Sciences and Natural Resources Research, CAS, Beijing 100101, China
  • 2. College of Resource and Environment, University of Chinese Academy of Sciences, Beijing 100049, China
*Yi Jiawei (1988-), PhD and Associate Professor, specialized in spatiotemporal data mining. E-mail:

Wang Nan (1994-), PhD, specialized in spatiotemporal data mining. E-mail:

Received date: 2020-03-17

  Accepted date: 2020-11-24

  Online published: 2021-04-25

Supported by

National Natural Science Foundation of China(41590845)

Strategic Priority Research Program of the Chinese Academy of Sciences(XDA19040501)

Strategic Priority Research Program of the Chinese Academy of Sciences(XDA20040401)

National Key Research and Development Program of China(2017YFB0503605)

National Key Research and Development Program of China(2017YFC1503003)

Copyright

Copyright reserved © 2021. Office of Journal of Geographical Sciences All articles published represent the opinions of the authors, and do not reflect the official policy of the Chinese Medical Association or the Editorial Board, unless this is clearly specified.

Abstract

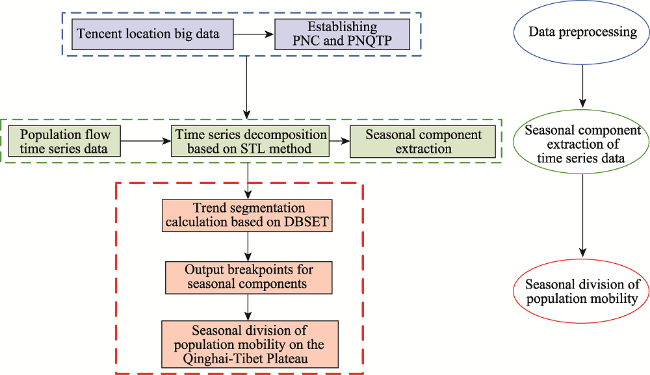
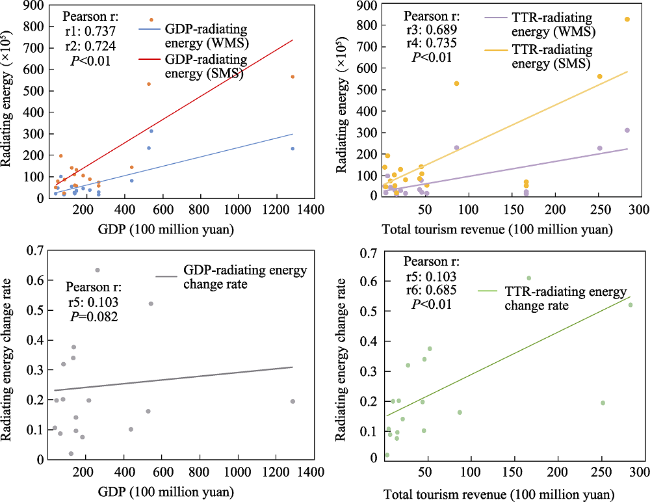
Developing a comprehensive understanding of inter-city interactions is crucial for regional planning. We therefore examined spatiotemporal patterns of population migration across the Qinghai-Tibet Plateau (QTP) using migration big data from Tencent for the period between 2015 and 2019. We initially used decomposition and breakpoint detection methods to examine time-series migration data and to identify the two seasons with the strongest and weakest population migration levels, between June 18th and August 18th and between October 8th and February 15th, respectively. Population migration within the former period was 2.03 times that seen in the latter. We then used a variety of network analysis methods to examine population flow directions as well as the importance of each individual city in migration. The two capital cities on the QTP, Lhasa and Xining, form centers for population migration and are also transfer hubs through which migrants from other cities off the plateau enter and leave this region. Data show that these two cities contribute more than 35% of total population migration. The majority of migrants tend to move within the province, particularly during the weakest migration season. We also utilized interactive relationship force and radiation models to examine the interaction strength and the radiating energy of each individual city. Results show that Lhasa and Xining exhibit the strongest interactions with other cities and have the largest radiating energies. Indeed, the radiating energy of the QTP cities correlates with their gross domestic product (GDP) (Pearson correlation coefficient: 0.754 in the weakest migration season, WMS versus 0.737 in the strongest migration season, SMS), while changes in radiating energy correlate with the tourism-related revenue (Pearson correlation coefficient: 0.685). These outcomes suggest that level of economic development and level of tourism are the two most important factors driving the QTP population migration. The results of this analysis provide critical clarification guidance regarding huge QTP development differences.

Cite this article

WANG Nan , WANG Huimeng , DU Yunyan , YI Jiawei , LIU Zhang , TU Wenna . Population migration across the Qinghai-Tibet Plateau: Spatiotemporal patterns and driving factors[J]. Journal of Geographical Sciences, 2021 , 31(2) : 195 -214 . DOI: 10.1007/s11442-021-1842-z

1 Introduction

Human migration refers to the movement of people from one place to another with the intention of permanently or temporarily settling at a new location (i.e., geographic region). This phenomenon therefore encompasses factors such as urbanization development, education level, economic attractiveness, and tourism. In this context, population migration is a proxy for the vitality of a city as it triggers inter-regional materials, information, capital, and technology flows (Scott, 2003; Liu et al., 2011; Dorigo and Tobler, 2015; Jiang and Wang, 2015; Cao and Dong, 2020). Human migration also promotes cultural, economic, and societal infusion and diffusion within a given spatial area (Haas, 2010). It is also clear that population migration plays an important role in urbanization, informatization, industrialization, and economic development across different cities and regions. Thus, understanding the spatial characteristics and structures of population migration is of great value to urbanization management and economic planning (Li, 2014; Li et al., 2014; Allard and Moura, 2015).
The Qinghai-Tibet Plateau (QTP), also known as the ‘Roof of the World,’ is a sparsely populated region which encompasses diverse climates, complex terrains, and rich natural and cultural resources (Yang et al., 2010; Chen et al., 2013; Yao et al., 2015). The QTP is also characterized by uneven population distribution and economic development, with most people living in relatively low-altitude, yet economically more developed, areas. The QTP has also experienced a significant increase in the number of homes and international tourists because of improvements in transportation infrastructure as well as the promotion of eco-tourism across China (Zhang et al., 2010; Ma et al., 2012; Xu et al., 2017). The bulk of visitors from home and abroad visit the QTP over the summer and so increased inter-migration flows superimpose onto already active intra-migration flows (i.e., local population migrations) within the same season (Li, 2012; Yang et al., 2016). Dramatically enhanced migration flows over the summer create an increased labor for demand and also provide extra income to local residents (Ding and Wang, 2012). These increased migration flows also promote urbanization across the QTP and place huge pressure on the fragile ecological environment.
Examination of population migration patterns over different time periods on the QTP is of great significance if we are to better understand human impacts on the ecological environment as well as ongoing urbanization processes. Population data collected via census and the use of questionnaires has been widely used in population migration studies (Shen, 1996; Liao, 2003a, 2003b; Dong et al., 2013; Wang, 2014; Zhao, 2016; De, 2018). Research has shown that current population distribution as well as trends in mobility and the factors driving population migration on the QTP over a long time period. As a result of limitations in static population data, previous studies have mainly focused on migration within specific time periods to identify macro-patterns in movement at relatively low spatiotemporal resolutions (Hilbert and Martin, 2016; Li, 2016; Shaw et al., 2016).
Human-environment interactions have significantly changed over time due to significantly improved transportation and communication technologies. Access to big location data has significantly refined the spatiotemporal scale of geographical research and provided new opportunities for studies addressing urban interactive networks (Liu et al., 2015; Liu and Enming, 2016; Belyi et al., 2017). Current studies have utilized big location data to examine urban interaction within large clusters and at various other spatial scales. Time series from mobile data have been used to examine inter-country population movement patterns (Belyi et al., 2017), to establish a mobile network system between cities (Liu et al., 2016), to delineate countries into hierarchical ‘source-sink’ regions, to characterize various urbanization levels or distinctive roles in labor markets (Wang et al., 2018), and to measure connectivity within city clusters (Lin et al., 2019). A number of researchers have also used probabilistic models to assess population movement patterns and to study regional changes in migration flow to further predict potential future patterns (Ma et al., 2018). In addition, taking the advantages of mobile data over time, numerous studies also used big location data to measure unbalanced population migration on vacations or during specific time periods as well as to explore the factors driving these changes (Xu et al., 2017; Wei et al., 2018).
We used Tencent big migration data to examine population migration dynamics on the QTP. Population migration flows show significant seasonal fluctuations across this region and are significantly affected by both domestic and international tourists. We unraveled migration flow patterns, network structural characteristics, directional distributional characteristics, and the radiating energies of specific cities across the QTP. We also examined the factors driving these different migration patterns. The results of this study provide valuable information for urbanization management on the QTP as well as for regional development planning.

2 Study area and data

2.1 Study area

The QTP is located in southwestern China and encompasses an area of ​​about 2.6 million km2. This region is the third pole of the world as it has an average elevation around 4200 m above sea level (Qiu, 2008). This plateau is sparsely populated and there is significant differentiation with area in both economic development and population distribution. The bulk of the QTP residents live in low-altitude and economically more developed regions which usually have more agreeable climates.
Two administrative provincial units are located entirely within the QTP, the Tibet Autonomous Region and Qinghai Province. The QTP also encompasses a small portion of four other provincial units, including Xinjiang Uygur Autonomous Region and Gansu, Sichuan, and Yunnan provinces. A total of 18 prefectural level cities are also present on the QTP (Zhang et al., 2002), including two provincial capitals (Lhasa and Xining) as well as 16 prefecture-level ones (Xizage, Qamdo, Nyingchi, Shannan, Nagqu, Ngari, Haidong, Haibei, Huangnan, Hainan, Haixi, Golog, Yushu, Gannan, Garze, and Aba). Ninety percent of these urban areas are included within the boundaries of the QTP, encompassing a land area of ​​almost 2.16 million km2. These regions were taken as the study area for this analysis (Figure 1).
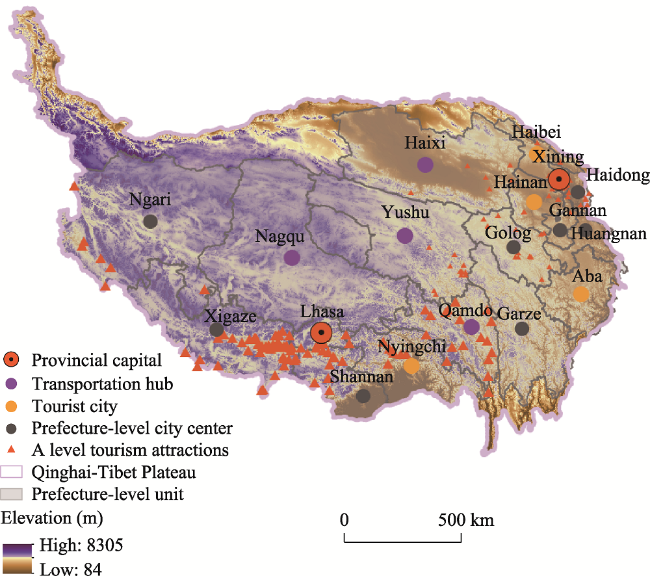
Figure 1 The study area considered in this analysis

2.2 Data sources and processing

Multiple datasets were used in this study. Population migration data were downloaded from the Tencent Location Big Data website (https://heat.qq.com/) using the Tencent Migration API. We obtained daily population migration data for 365 cities across China covering the period between February 2015 and March 2019. These 365 cities include 333 prefecture-level administrative units, four municipalities, 26 county-level cities, and two Special Administrative Regions (Hong Kong and Macao). This population migration dataset includes migration to and from cities as well as the number of migrants moving between any two entities. It is important to note that the Tencent population migration dataset has been validated and previously utilized to study population movements across China (Xu et al., 2017, Wei et al., 2018).
We constructed a population mobility network utilizing each of these 365 cities as a node and the daily migrant number between any two as a network link connecting a specific pair (i.e., cities). Migrant number was therefore defined as the total number of inflow and outflow people for a particular city. We then constructed an 18 by 18 network matrix to illustrate population migration amongst the 18 QTP prefectural cities. These cities were then aggregated into one node which was then used to construct a 348 by 348 population migration matrix to illustrate movements between the QTP and the remaining 347 non-QTP cities across China. We therefore defined population migration amongst these 18 QTP cities as intra-migration flows while migration between QTP entities and the other 347 non-QTP cities were defined as inter-migration flows.
It is clear that both flows exhibit significant seasonal fluctuations with higher numbers over the warm seasons and lower numbers over the cold seasons, as shown in time series daily inter- and intra-migration flows (Figure 2). Thus, over the period of interest, maximum daily numbers of inter- and intra-migrational migrants peaked in July 2017 at 2.13 million and 470,000, respectively. Seasonal fluctuations in population migration were then superimposed with holiday-induced and short-term increased migration flows. This analysis shows that migration flows significantly increased during the Labor Day holidays (May 1st) as well as during the National Day holidays (between October 1st and October 7th).
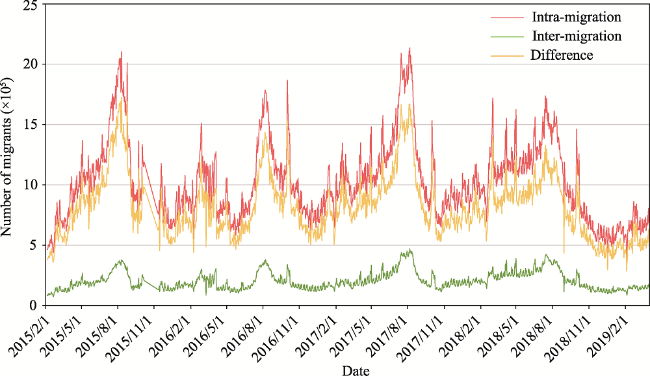
Figure 2 Time series to show the total daily number of intra-migrational migrants between the 18 QTP cities as well as inter-migration migrants between these cities and their 347 non-QTP counterparts.

3 Methodology

We initially utilized time series decomposition and breakpoint detection methods to identify seasonal patterns in population mobility of intra- and inter-migration flows. A social network analysis method was then utilized to study the distributional characteristics of population mobility. The strength of connections between nodes in the population mobility network were then assessed using an interaction strength model. We then utilized a population mobility radiation model to examine the spatial extent to which any given city might influence QTP population mobility.

3.1 Population flow time series seasonal divisions

Two typical characteristics of seasons are seen in atmospheric science, periodicity of seasonal transformations as well as differences between seasons. Time series for QTP population migrants indicate regular annual upward and downward trends over certain periods of time. Thus, in order to obtain and verify seasonality, we utilized the Seasonal-Trend decomposition based on Loess (STL) time series decomposition method (Cleveland et al., 1990) to identify breakpoints within time series migration data (Figure 2). These breakpoints divide time series data into different segments which reveal seasonal differences and migration flow periodicity across the QTP. The Detecting Breakpoints and Estimating Segments in Trend model (DBEST) (Jamali et al., 2015) was then used to extract seasonal components from time series migration flows (Figure 3).
Figure 3 Identification of seasonal breakpoints from time series migration flows

3.2 The importance of QTP cities in population migration

We utilized the PageRank algorithm (Brin and Page, 1998) to evaluate the importance of the QTP within a population mobility network. The approach was originally used by Google search engine to rank the importance of webpages. The basic premise of this algorithm is that a more important webpage will have higher link popularity as it is being linked with higher numbers of additional websites. In addition to conventional node centrality indicators, the PageRank algorithm also evaluates the number of network node connections and the quality of inter-connected nodes. The relationship between population mobility networks and Internet websites is very similar; in a population mobility network, nodes representing more important cities have more connections and therefore attract more people from other cities (Gupta et al., 2013; Wei et al., 2015). This algorithm was obtained via the study of population mobility networks (Gupta et al., 2013; Wei et al., 2015; Xu et al., 2017) and so we used it to evaluate and analyze the network importance of different seasons on the QTP.

3.3 Interaction strength between QTP cities

Although migration between urban nodes can reflect the mutual influence of population and resources, because of population bases, city sizes, and economic development levels, absolute population flow does not reflect the relationship and interaction strength between two cities. We therefore utilized the interactive relationship model proposed by Sforzi et al. (1990) to assess the interaction between any two cities to characterize their strength (Eq. (1)). We used this model to filter out differences between urban backgrounds as well as to quantitatively describe the interaction intensity between any two QTP cities, as follows:
$I{{V}_{ij}}=\frac{{{f}_{ij}}^{2}}{{{O}_{i}}*{{I}_{j}}}+\frac{{{f}_{ji}}^{2}}{{{O}_{j}}*{{I}_{i}}}$
where IVij denotes the interactive relationship between cities i and j, while fij and fji represent the number of migrants from cities i to j and cities j to i, respectively. Similarly, Oi and Oj denote the total number of outflow migrants from cities i and j, while Ii and Ij refer to the total number of inflow migrants into cities i and j, respectively.

3.4 Radiating momentum and QTP city energies

We introduce a population mobility radiating model to study the extent to which a QTP city influences population migration across this region. This model is composed of radiating momentum and energy; of these, radiating momentum, the product of population flow and distance, denotes the effect of a city on population migration to other urban areas across all directions. These are represented by directional vectors in this analysis. Thus, the radiating momentum of each city has its own direction, the aggregated direction of all vectors associated with that specific urban agglomeration. Radiating energy therefore denotes the ability of a city to attract or drive out migrants and is a function of distance and the number of population flows. Thus, in a population mobility network, the greater the radiating energy of a node, the more it can transmit people over a greater distance, as follows:
$RMi{{n}_{i}}=\sum\limits_{j=1}^{n}{(M{{f}_{ij}}}*\overrightarrow{U{{d}_{ij}}}*\left| {{d}_{ij}} \right|)$
$RMou{{t}_{i}}=\sum\limits_{j=1}^{n}{(M{{f}_{ji}}}*\overrightarrow{U{{d}_{ji}}}*\left| {{d}_{ji}} \right|)$
$R{{E}_{i}}=\sum\limits_{j=1}^{n}{(M{{f}_{ij}}}*\left| {{d}_{ij}} \right|)+\sum\limits_{j=1}^{n}{(M{{f}_{ji}}}*\left| {{d}_{ji}} \right|)$
where $RMi{{n}_{i}}$and$RMou{{t}_{i}}$ denote radiation momentum flowing into the city i node as well as radiation momentum flowing out of city i, respectively. Similarly, $M{{f}_{ij}}$ and $M{{f}_{ji}}$ denote the population flow numbers between city i and city j as well as between city j and city i, respectively. Thus, $\overrightarrow{U{{d}_{ij}}}$ denotes the unit vector of city i flowing to city j, while$\overrightarrow{U{{d}_{ji}}}$ denotes the unit vector of city i flowing to city j. Lastly,$\left| {{d}_{ij}} \right|$and$\left| {{d}_{ji}} \right|$ denote road distances between city i and city j.

4 Results

4.1 Seasonal characteristics of migration flows

We utilized STL time series decomposition and the breakpoint method to reveal seasonal patterns of population movements on the QTP based on total daily flows. We separately aggregated time series daily numbers of inter- and intra-migration migrants between 2015 and 2019 into one-year time series and converted absolute numbers to relative change values (Figure 4). We identified four breakpoints along the time series and divided this into five segments. Migration flows within these five segments were statistically significant differences from one another at the 0.01 level and therefore provided further data support for analyzing spatiotemporal patterns.
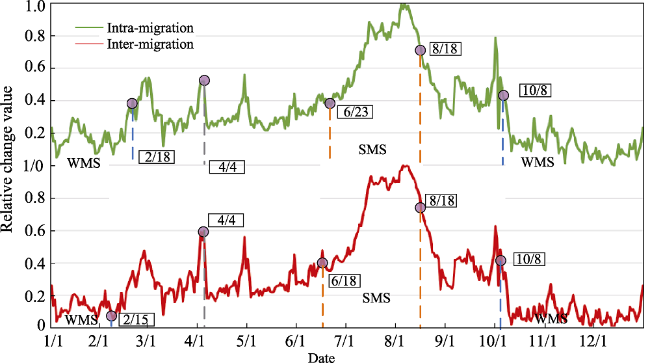
Figure 4 Agglomerated fluctuations in inter- and intra-migration flows within one year
Results show that the strongest and weakest migration flows occurred between June 18th and August 18th and between October 8th and February 15th, respectively. Throughout the weakest migration period, average daily traffic numbers for the 18 QTP cities as well as their 347 non-QTP counterparts were 157,700 and 800,000, respectively. This roughly approximates to the winter season on the QTP and implies that low temperature is one of the major factors that curtails migration flows. In contrast, average daily traffic numbers for the 18 QTP cities and their 347 non-QTP counterparts during the strongest migration period were 319,900 and 153.04 million, respectively. This time period is also when large numbers of tourists tend to visit the QTP.
The other three seasons encompassing the periods between February 15th and April 4th, between April 4th and June 18th, and between August 18th and October 8th are transitional times. These relative change values all fall between periods with the strongest and weakest migration flows, respectively. We therefore focused on examining spatiotemporal variations in migration flows during the weakest (WMS) and the strongest migration seasons (SMS), respectively.

4.2 Seasonal patterns in QTP population flows

Our analysis of internal flows between different seasons revealed changes in distribution within the QTP. We determined the importance of QTP cities (or city pairs) in driving intra-migration flows (Figures 5a and 5b). The most intense migration flows were found between Xining and Haidong, accounting for 28.30% and 15.28% of the total intra-migration flows in the strongest and weakest seasons, respectively. Similarly, migration flows between Xining and Haixi, Xining and Hainan, and Xining and Haibei account for between 10.75% and 9.28%, 6.50% and 9.60%, and 5.74% and 6.53% of the total intra-migration flows in the strongest and weakest periods, respectively. Data show that migration flows between Lhasa and Haixi ranks fifth on the list, accounting for less than 5% of the totals in both periods. The top five migration flow lines account for 55.57% and 44.21% of the total inter-migration movements within the QTP over the two periods, respectively. Individually, Xining is the most important city driving migration across this region, accounting for 29.5% and 24.7% of the total intra-migration in the strongest and weakest seasons, respectively. The second ranked is Lhasa in Tibet (11.3%, 13.4%), followed by Haixi (10.8%, 11.8%), Haidong (18.1%, 11.1%), and Hainan (5.1%, 9.1%); these top five cities accounted for 74.8% and 70.1% of total population movements in WMS and SMS seasons, respectively. In terms of QTP population movements, it is clear that mobility is unevenly distributed; most cities across this region are remotely located geographically, relatively backward in their development, and have limited communication with the outside world. A small number of cities contain most of the QTP population; frequent migration is concentrated between cities where economies are better developed and transportation is more convenient.
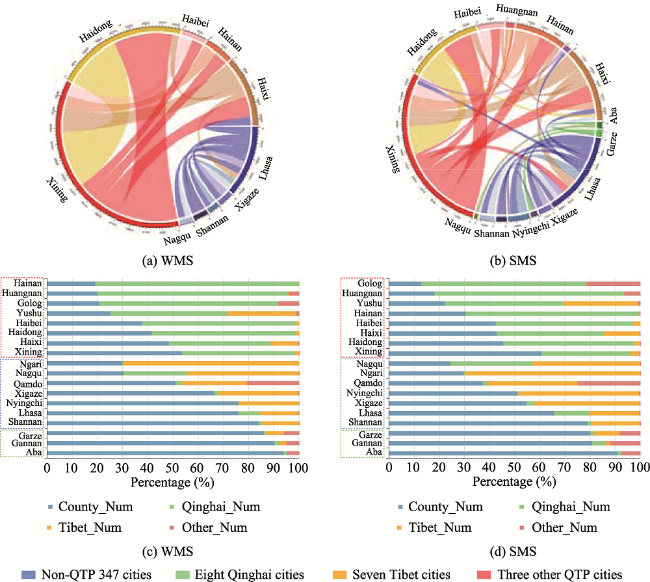
Figure 5 Chord diagrams showing migration flows between the 18 QTP cities during WMS (a) and SMS (b) periods. The bulk of migration flows involving the 18 QTP cities are from their 347 non-QTP counterparts as well as eight Qinghai, seven Tibet, and the other three non-QTP cities during WMS (c) and SMS (d) periods.
Huge differences in intra-migration flow structures are seen during the weakest and strongest migration periods. Thus, compared to the weakest periods of migration, more city pairs exhibit enhanced intra-migration flows; the increased migration flows are seen between Nyingchi/Hainan and Xining/Lhasa throughout the strongest period. The percentage of migration flows of Aba, Gannan, Huangnan, and Nyingchi also increased over this period. The main driving force for increased mobility into these cities is tourism.
Migration flows from the 347 non-QTP cities within China as well as the seven Tibetan, eight Qinghai, and three other QTP cities were plotted across the strongest and weakest migration seasons (Figures 5c and 5d). The three other cities assessed here included Aba, Garze, and Gannan. Significant inter-migration flows were seen across China between these three QTP cities and their 347 non-QTP counterparts during both the strongest and weakest migration seasons. The main reason for this result is that although these three cities are in the QTP areas of China, large regional differences exist and interactions between Qinghai and Tibet remain weak. This results in the phenomenon that over 80% of the migration flows from these three other cities are from non-QTP 347 entities. Remaining migration flows are mainly found within the three other QTP cities with the exception of Garze. These flows reveal slightly stronger migration connections with Tibet throughout the strongest migratory season.
Overall, less than 50% of migration flows involving the eight Qinghai cities come from non-QTP entities in both seasons. This does not include Xining which encompasses more than 50% of total movements in the weakest migration season as well as 60% in the strongest season out of the total flow from the 347 non-QTP cities. The eight cities in Qinghai are involved in migration within this region with the exception of Golog and Yushu. Specifically, the city of Yushu is characterized by a higher percentage of migration flows from Tibet in both seasons, while the city of Golog draws more people from the three other QTP cities during the strongest migration season. Migration flows from the 347 non-QTP cities always tend to be high in Lhasa (65% and 76%) and Shannan (79% and 84%), while low for Nagqu (24% and 30%) and Ngari (29% and 30%) during the strongest and weakest migration seasons. Migration flows from Ngari and Nagqu are mainly from other Tibetan cities, while the latter draws 24% and 32% of the flows from Qinghai during the weakest and strongest migration seasons. It is also noteworthy that the city of Qamdo draws a significant percentage (20% and 24%) of its migration flows from the other three QTP cities throughout the two seasons. Distribution ratios involving Yushu, Nagqu, and Qamdo remain relatively even; these regions connect population mobility between different areas as there are huge differences in administrative divisions, cultures, and topography. The percentage of migration flows into QTP cities from their 347 non-QTP counterparts are between 5% and 11% higher in the weakest migration seasons than they are in the strongest ones, with the exception of Hainan, Xining, Haibei, and Haidong. This trend suggests that more people from the 347 non-QTP cities visit their QTP counterparts during the tourism season. Attractive regions for visitors are located around Qinghai Lake, an important QTP tourist attraction.

4.3 Seasonal patterns in network interactions and regional QTP status

Interaction strength analysis reveals the size of population relationships between nodes, while PageRank calculations reflect the position of a node within a network. We spatially mapped the rankings of the QTP cities in terms of their importance to population migration over different seasons (Figures 6a and 6b). Analysis reveals a clear structure encompassing ‘two centers and three connection points’ with the two capital cities, Xining and Lhasa, at the top of the list. These cities both have strong interactions with cities in Qinghai Province and within the Tibet Autonomous Region, respectively. A further three cities (i.e., Yushu, Nagqu, and Qamdo) are also toward the top of these rankings; these are transferring cities that fall between the QTP and non-QTP cities (i.e., ports through which inter-migrational migrants either enter or leave the QTP).
In addition to the importance of each city node, we also mapped interaction strengths between pairs of the QTP cities over the WMS and SMS periods (Figures 6a and 6b). In sum, city pairs with interaction strength values higher than 0.01 are shown in Figure 6b. These interaction relationships show that Qamdo, Aba, and Garze are strongly connected (Qamdo-Garze: 0.44, Garze-Aba: 0.43), while the two major cities in Qinghai, Haidong and Haixi, both reveal strong interactions with the capital Xining (Xining-Haidong: 0.75; Xining-Haixi: 0.18). Similarly, across the Lhasa Metropolitan Area, the cities of Xigaze and Shannan exhibit strong interactions with the central city - Lhasa (Lhasa-Xigaze: 0.23; Lhasa-Shannan: 0.22).
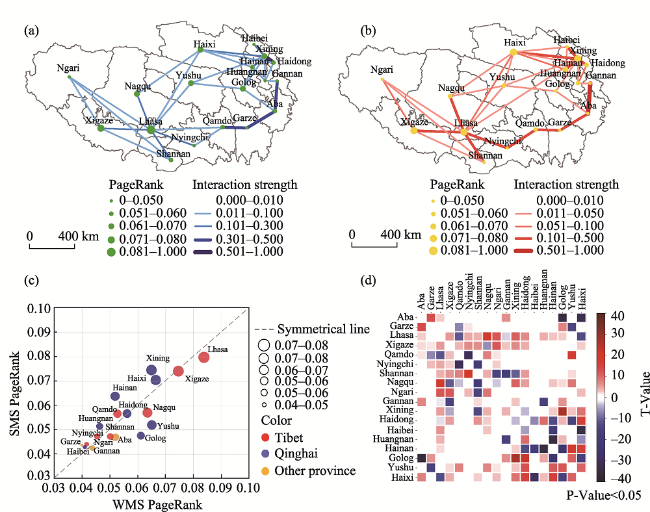
Figure 6 City importance rankings and interaction strengths between QTP cities in terms of migration flows during WMS (a) and SMS (b). Correlations between PageRank values during the two seasons for different regions across the QTP (c) as well as t-test results for changes between different pairs of cities (d).
Data show that throughout the SMS, connections between cities within the same province as well as between Qinghai and Tibet become stronger than is the case during the WMS, in particular between popular tourist cities and the two capitals. In one example, interactions between Xining and Hainan increased by 46% whereas those between Lhasa and Nyingchi increased by 66%. Throughout the SMS, connection strengths between Xining-Lhasa and Haixi-Lhasa increased by 400% and 20.7%, respectively, indicating enhanced inter-provincial connections. Intra-provincial connections are also strengthened over this period as shown by increased connection strengths between Lhasha and Xining.
Variation in all QTP’s cities’ PageRank values during WMS and SMS periods are shown in Figure 6c. It is clear that Lhasa and Xining, the political and economic centers of the QTP region, as well as the cities of Haixi and Xigaze which are better economically developed fall within the first level of the network. These are the dominant players within the migration network revealed in this analysis (PageRank values > 0.065). Transportation hubs on the QTP, Nagqu, Qamdo, and Yushu, as well the Hainan and Haidong areas within the Xining Metropolitan Area fall within the secondary position within the network (PageRank values > 0.05). We compared changes in PageRank values for different nodes across the two seasons and found that the ranking of transferring and popular tourist cities increased dramatically throughout the SMS. In contrast, less developed cities such as Golog, Yushu, and Nagqu, exhibited the largest declines overall on the ranking list. These cities also have relatively poor transportation infrastructures; this variable appears to form a bottleneck for both intra- and inter-migrational QTP flows.
We investigated whether or not, changes in connection strength between two cities as we move from WMS to SMS are statistically significant at the level of 0.05 (Figure 6d). The white color in Figure 6d shows which changes are not statistically significant, while red and blue colors indicate statistically significant increases and decreases, respectively. These results show that most changes between cities within the same province are statistically significant. Connection strengths between Xining-Golog, Xining-Hainan, Haixi-Hainan, Lhasa-Nagqu, Lhasa-Ngari, Shannan-Nyingchi, and Aba-Garze all increased by statistically significantly amounts. In contrast, connection strengths between Hainan-Huangnan, Haibei- Haixi, Hainan-Haibei, Qamdo-Nyingchi, Nyingchi-Shannan, and Nagqu-Shannan all declined significantly. Cities in different provinces, such as Golog-Aba, Huangnan-Gannan, and Xining-Shannan, all had weaker connections as people migrated to other cities; this means that more cities are included within the SMS population migration network.

4.4 QTP quantitative radiation intensity patterns

We calculated the final effects of each inflow and outflow node radiating momentum within WMS and SMS seasons using Eqs. (2) and (3) (Figure 7a). These data reveal no significant changes in both inflow and outflow directions in the case of most QTP cities during WMS and SMS. Lhasa and Xining, the two capital cities within the region, are major hubs through which inflow and outflow migrants enter and leave the QTP. It is noteworthy that Qamdo is the portal for migrants from Sichuan Province to enter the QTP and inflow migrants during both seasons mainly travel to Nyingchi. A major population migration corridor is present between Sichuan Province and Qamdo via Nyingchi to Lhasa during the SMS; most inter-migrational individuals enter and visit the QTP via this route. In contrast, Nyingchi exhibits no dominant radiating momentum outflow direction throughout the WMS, while Lhasa, the center of Tibet, has the ultimate effect of absorbing and transmitting population flows en route to Qinghai.
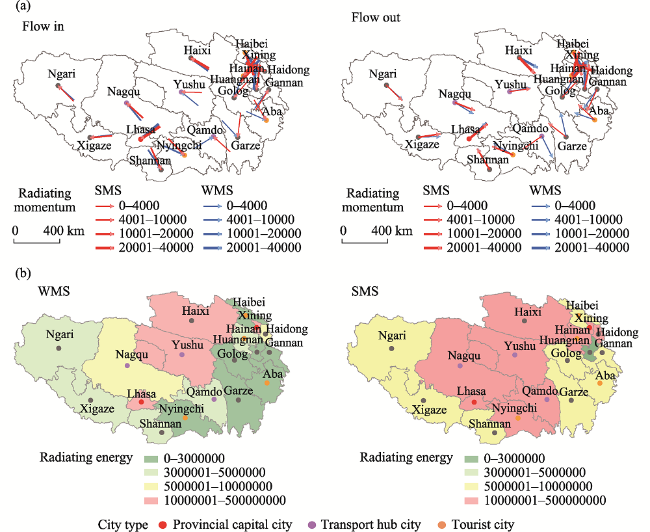
Figure 7 Results based on a population flow radiation model for 18 QTP cities across different seasons: Radiating momentum directions (a) and (b) energy
Significant changes in radiating momentum are seen throughout both seasons. Inflow migrants to Garze mainly come from the central QTP in the WMS but shift to moving to Qinghai during the SMS. It is also the case that outflow radiating momentum directions seen in Garze and Haixi change from Golog and Qinghai to Tibet, respectively. In both migration seasons, inflow and outflow migrants come and go to Xining, suggesting that inter-migrational migrants mainly enter or leave the QTP via the Xining transportation hub. Indeed, compared with the flow-in map flow direction, the radiation direction of most areas has not changed significantly showed in flow-out map. The Nagqu area exhibits a stronger radiation capacity in the direction of Qinghai, while Yushu has a stronger radiation capacity in the direction of Tibet. The Qamdo area has a stronger radiation capacity in the direction of Nyingchi while the hot season turns to the Sichuan border. Similarly, compared with WMS, Hainan, Xining, Nagqu, and Haixi produce more energy in the flow effect. The population flow network presented here also encompasses the node that sends and receives radiating energy fields. It is also clear that the Lhasa and Xining nodes accept and transmit the radiative momentum of population movements from different directions within the province, the center of radiation momentum conversion. Data show that Yushu, Nagqu, and Qamdo, transit centers for the three Tibetan areas, are mediators for energy transmission as most do not exhibit any obvious direction. Thus, as the WMS period shifts to the SMS, the effects of population movements reflect changes in the magnitude and direction of radiation momentum in each city as influenced by tourism factors.
Radiating energy values for QTP cities are summarized in Figure 7b for the two seasons. Data show that cities with stronger radiating energy during the WMS include the four economic centers, Lhasa, Xining, Haixi, and Haidong, as well as the two major transportation hubs, Yushu and Nagqu. These six cities are the most important ones within the QTP population migration network. However, although Haidong is characterized by large population flow, the main one is in the short-distance Xining direction, resulting in lower radiating energy. Conversely, although population flows are small in Yushu and Haixi, these cities nevertheless have the ability to transmit populations to places further afield because they are transportation hubs. Migrants in most cities along eastern and southwestern margins of the QTP flow to provincial capitals or neighboring cities and so their radiating energy remains low. Indeed, compared with the WMS, the phenomenon in the SMS includes a large number of tourists entering the QTP led to a significant increase in radiating energy in all cities, although this energy in Huangnan did not change to any great extent.
We performed vector subtraction calculations on the radiated momentum of inflow and outflow directions at each node, respectively. The change rate of inflow and outflow directions of radiating momentum across the two seasons have been calculated (Figure 8a). Thus, Qamdo, Garze, Nyingchi, Gannan, and Aba tend to be areas characterized by the greatest changes; these areas are located on the edge of the QTP where an influx of tourists exerts a huge impact. No significant changes in the direction of action in Xining, Lhasa, and Haixi were seen such there has been a significant increase in the number and distance of transmitted population flows. The increase in the number of tourists has also greatly increased the radiation momentum of main flow directions (e.g., Xining) in Hainan and Haibei.
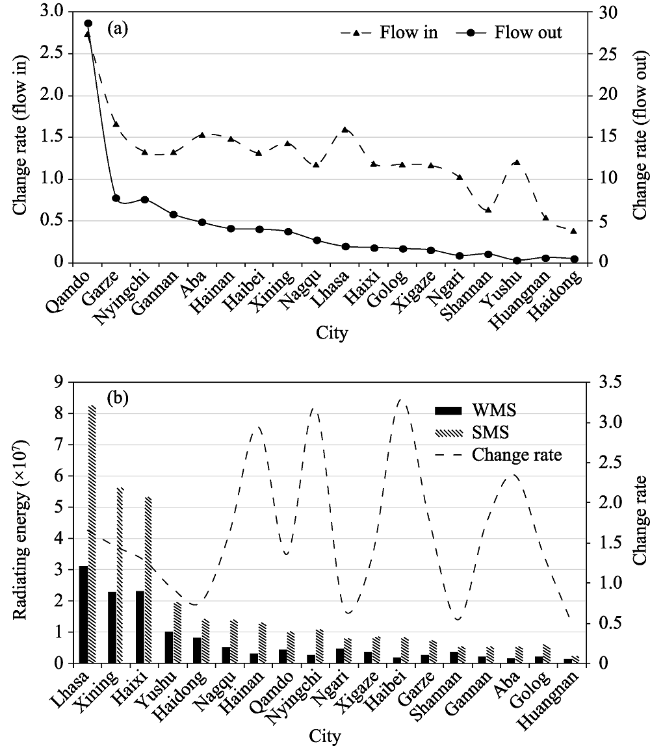
Figure 8 Rates of radiating momentum change in ‘in and out’ directions (a) as well as radiating energy(b) for cities on the QTP alongside rate of change during WMS and SMS
Significant differences in QTP city radiating energy are seen in different seasons (Figure 8b). Results show that Nyingchi (In: 277.4%; Out: 362.3%), Hainan (In: 260.1%; Out: 331.1%), Haibei (In: 235.0%; Out: 382.7%), and Aba (In: 138.3%; Out: 245.9%) are the cities which have experienced the largest changes in population mobility radiating energy. These four cities are the main tourist cities within the QTP such that tourism factors have played a huge role in urban development. In contrast, cities like Ngari, Huangnan, Golog, Shannan, and Haidong have experienced limited changes with rates less than 1. Although the radiating energy of these cities has increased, the rates of increase have remained small, this means that these increases in the frequency of population movements on the QTP has not had a major impact overall.

5 Discussion

5.1 QTP population flow structure

We have analyzed the composition of population movements within each QTP city, reflect-ing the willingness of population to move in each case. Additional analyses of migration flows (Figure 9) show that slightly less than 20% of the total population comes from other QTP cities, (i.e., inter-migration). It is clear that Lhasa, Xining, and Aba are the major portals through which migrants from non-QTP cities enter (or leave) this area. Data show that in both WMS and SMS periods, more than 50% of inflow and outflow inter-migrational migrants from non-QTP cities use these three cities as transfer stations.
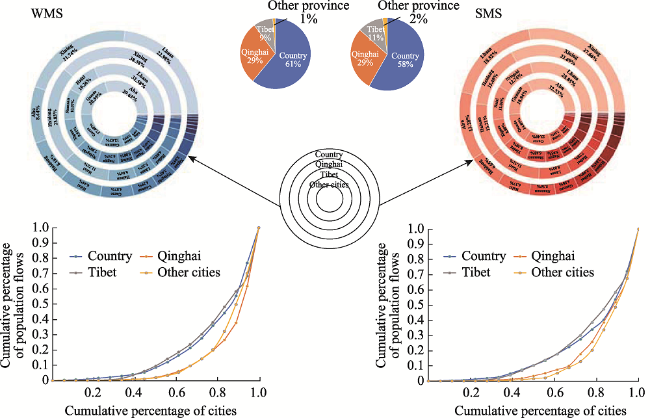
Figure 9 Composition of the QTP population flows and Lorenz curves during the WMS and SMS
More than 80% of migrants migrate within this province as shown by the Lorenz curves. Migration flows within Xining account for over 35% of the total within-province migration. The two other major cities in Qinghai, Haidong, and Haixi witness another 15% of total within-province migration. Migration flows in Lhasa (Tibet) account for 31.58% and 18.85% of total within-province migration in WMS and SMS periods, respectively. In terms of other QTP cities, population migration around Aba, Garze, and Gannan accounts for over 80% of total intra-migrational population flows in both seasons. There is also significant migrational flow between Qamdo and the three other QTP cities.
Lorenz curves also show that differences in migrational flows among Qinghai cities as well as between these and non-QTP ones are not significant during WMS and SMS periods. Migrational flows change significantly for popular cities or transportation hubs including Xining, Aba, Nyingchi, Lhasa, and Hainan during the SMS. Results suggest that current population migration over the QTP remains mainly within-province, yet inter-migration from other non-QTP cities might significantly change population migration structures during the SMS, the time when many tourists come to visit.

5.2 Factors driving QTP population migration

The QTP enjoys rich eco-tourism resources and unique climatic conditions. These have led to significant differences in population flow patterns in different seasons. The radiating energy of each city has changed significantly due to changes in driving forces. Nyingchi, Hainan, Haibei, and Aba are typical tourist hotspots; the tourism revenue of these popular destinations accounts for more than 10% of GDP. Similarly, Xining and Lhasa are second level cities which have experienced large changes; these are popular tourist destinations and important QTP transportation hubs, responsible for distributing people all over the province. These two cities connect the interaction between Qinghai and Tibet during the high season.
In order to determine the relationship between radiating energy, its changes, and urban development in this paper, we compared radiating energy with GDP and tourism revenue (taken from the 2017 China Statistical Yearbook). We then mapped these relationships (Figure 10). Data show that radiating energy is positively correlated with regional GDP and with a higher cold season correlation coefficient. Radiating energy is positively correlated with total regional tourism revenue and has a higher hot season correlation coefficient. Changes in radiating energy are not significantly correlated with GDP and have a significant positive relationship with total regional tourism revenue. It is therefore possible to infer that the magnitude of radiating energy is related to the level of regional development and that tourism factors can significantly influence changes in population movement radiating energy across different seasons.
Figure 10 The relationship between QTP region migration data and socioeconomic indices
The QTP is far away from economically developed areas in the east of China. The environmental carrying capacity of this region is small, travel is inconvenient, and socioeconomic development is relatively backward, limiting tourism development. At the same time, this variable is responsible for much QTP development. Tourism can continue to increase mobility between QTP cities and reduce the uneven development of this region given a long time period although this effect is not long-lasting and the remote tourism resources of Ngari, Golog, Huangnan, and other regions are limited. It is therefore essential to drive more regional connectivity to reduce regional development differences and enhance tourism sustainability. This will be very important if we are to further improve QTP city competitiveness.

6 Conclusions

We have examined population migrational patterns over the QTP using Tencent time series migration big data. We analyzed spatiotemporal laws of QTP population flows as well as the radiating energy characteristics of different cities in different seasons. The results of this analysis lead to a number of clear conclusions.
It is initially clear that population migration is much stronger between June 18th and August 18th but is weaker between October 18th and February 15th. This pattern is likely due to the influence of climate across the QTP; thus, summer is the season when most tourists from China and internationally tend to visit the QTP. Tourism activities also trigger additional local population migration over larger spatial scales. In contrast, few visitors come to the QTP in winter and local residents also migrate less and over just short ranges due to inclement weather.
Second, population migration is stronger between cities within the same province than it is between those in different provinces. The two capital cities, Lhasa and Xining, as well as some transportation hubs, like Haixi, Yushu, and Qamdo, are the most active ports by which migrants enter and leave the QTP. These top five cities account for 74.8% and 70.1% of total population movement in both WMS and SMS, respectively. Indeed, compared to the winter season, the summer means that more cities are involved in population migrations; total population flow within the QTP increases by 102.9% at this time which suggests that mild weather over the summer allows tourists and local dwellers to migrate over a larger spatial area.
Third, the population migration network developed here is characterized by a structure of ‘two centers, three connecting points, and three circles.’ The two capital cities, Lhasa and Xining, are the two population migration centers, while Qamdo, Nagqu, and Yushu are the three connecting points responsible for connecting the three major QTP areas. PageRank values for these five node cities are all higher than 0.05. Data show that population migrations mainly occur along Lhasa, Xining, and Aba circles. In the summer, when population migrations are much stronger, interactions between Qinghai and Tibet also strengthen significantly (significant at the 0.05 level).
Fourth, from the perspective of radiating energy changes, cities in Qinghai Province tend to be characterized by more obvious migration directions as well as changes in effects. It is clear that radiating momentum in cities such as Qamdo, Nyingchi, and Aba have undergone significant changes. In terms of radiating energy, Lhasa, Xining, and Haixi are cities at the top of the list and have the largest radiation capacities. These cities also possess stronger abilities to transmit to larger populations. Popular tourist cities such as Nyingchi, Hainan, Haibei, and Aba are characterized by the strongest increases in radiating energy. Energy change rates for these popular tourist cities all exceeded 250% in our analysis; this indicates that the influence of tourism factors exerts a significant impact on QTP population migration.
The results of this analysis reveal major structures and distributional characteristics on the QTP that are basically consistent with the results of previous research based on traditional census data. This outcome therefore corroborates the utility of big data. The core cities identified here are unsurprising, especially to workers who are familiar with the QTP. We have, however, been able to identify changes in population flow structure over different time periods at higher spatiotemporal precision, quantitatively determine the direction and extent of flows in different regions, and reveal changes in radiating energies.
[1]
Allard R F, Moura F, 2015. The incorporation of passenger connectivity and intermodal considerations in intercity transport planning. Transport Reviews, 36(2):1-27.

DOI

[2]
Brin S, Page L, 1998. The anatomy of a large-scale hypertextual Web search engine. Computer Networks and ISDN Systems, 30(1-7):107-117.

[3]
Cao H H, Dong G H, 2020. Social development and living environment changes in the Northeast Tibetan Plateau and contiguous regions during the late prehistoric period. Regional Sustainability, 1(1):59-67.

[4]
Chen H, Zhu Q, Peng C et al., 2013. The impacts of climate change and human activities on biogeochemical cycles on the Qinghai-Tibetan Plateau. Global Change Biology, 19(10):2940-2955.

DOI PMID

[5]
Chin W C B, Wen T H, 2015. Geographically modified pagerank algorithms: Identifying the spatial concentration of human movement in a geospatial network. Plos One, 10(10):e0139509.

[6]
Cleveland R B, Cleveland W S, Mcrae J E et al., 1990. STL: A seasonal-trend decomposition procedure based on loess. Journal of Official Statistics, 6(1):3-33.

[7]
De J Y Z, 2018. The study on Tibetan population current of Qinghai province during urbanization[D]. Xining: Qinghai Normal University. (in Chinese)

[8]
Dong S, Pu Y, Wang Y, 2013. A research on complex network of Chinese interprovincial migration based on the fifth population census. 2013 21st International Conference on Geoinformatics, 1-4.

[9]
Dorigo G, Tobler W, 2015. Push-pull migration laws. Annals of the Association of American Geographers, 73(1):1-17.

[10]
Guo Z Y, Mao H X, 2009. Population change and migration in China’s five major Tibetan-inhabited regions. Population & Economics, (1):5-10. (in Chinese)

PMID

[11]
Gupta P, Goel A, Lin J et al., 2013. WTF: The who to follow service at twitter. Proceedings of the 22nd International Conference on World Wide Web, 505-514.

[12]
Haas H D, 2010. Migration and development: A theoretical perspective1. International Migration Review, 44(1):227-264.

[13]
Jamali S, Jönsson P, Eklundh L et al., 2015. Detecting changes in vegetation trends using time series segmentation. Remote Sensing of Environment, 156:182-195.

[14]
Jiang X R, Wang S L, 2017. Research on China’s urban population mobility network: Based on Baidu migration big data. Chinese Journal of Population Science, (2):35-46. (in Chinese)

[15]
Li S M, 2014. Population migration regional economic growth and income determination: A comparative study of Dongguan and Meizhou, China. Urban Studies, 34(7):999-1026.

[16]
Li Y, Liu H, Tang Q et al., 2014. Spatial-temporal patterns of China’s interprovincial migration, 1985-2010. Journal of Geographical Sciences, 24(5):907-923.

[17]
Liao S B, Sun J L, 2003a. GIS based spatialization of population census data in Qinghai-Tibet Plateau. Acta Geographica Sinica, 58(1):25-33. (in Chinese)

[18]
Liao S B, Sun J L, 2003b. Quantitative analysis of relationship between population distribution and environmental factors in Qinghai-Tibet Plateau. China Population, Resources and Environment, 13(3):65-70. (in Chinese)

[19]
Lin J, Wu Z, Li X, 2019. Measuring inter-city connectivity in an urban agglomeration based on multi-source data. International Journal of Geographical Information Science, 33(5):1062-1081.

[20]
Liu R, Liu Y, Xu X et al., 2017. Change of geographical environment in southern margin of Tibetan Plateau since 1980s. Bulletin of Chinese Academy of Sciences, 32(9):1003-1013. (in Chinese)

[21]
Liu S, Hu Z, Deng Y et al., 2011. The regional types of China’s floating population: Identification methods and spatial patterns. Journal of Geographical Sciences, 21(1):35-48.

[22]
Liu W B, Shi E M, 2016. Spatial pattern of population daily flow among cities based on ICT: A case study of “Baidu Migration”. Acta Geographica Sinica, 71(10):1667-1679. (in Chinese)

[23]
Ma D, Qing X, 2012. Present situation and counter measures of ecotourism development in Qinghai-Tibetan Plateau. Journal of Tibet University (Social Science Edition), 27(1):26-33.

[24]
Ma T, Zhu R, Wang J H et al., 2019. A proportional odds model of human mobility and migration patterns. International Journal of Geographical Information Science, 33(1):81-98.

[25]
Page L, Brin S, Motwani R et al., 1999. The PageRank Citation Ranking: Bringing Order to the Web. Technical Report. Stanford InfoLab.

[26]
Qiu J, 2008. China: The third pole. Nature, 454:393-396.

PMID

[27]
Scott A J, 2003. Global city regions: Trends, theory, policy. Area, 35(3):326-327.

[28]
Shen J, 1996. Internal migration and regional population dynamics in China. Progress in Planning, 45(3):123-188.

[29]
Wang M, 2014. Tibetan migrates and population flow: Based on the data of fifth and sixth population census. Northwest Population Journal, 35(5):13-18. (in Chinese)

[30]
Wei Y, Song W, Xiu C et al., 2018. The rich-club phenomenon of China’s population flow network during the country’s Spring Festival. Applied Geography, 96:77-85.

[31]
Wu W B, Yang P, Shibasaki R et al., 2010. The relationship between the urban-rural income inequality and urbanization in west China: A case study of Qinghai province. Progress in Geography, 29(8):961-967. (in Chinese)

[32]
Xiao B W, Zhou W, Tang W et al., 2014. Migration trends and effect on urbanization of key ecological functional areas of the northern Tibetan Plateau. Mountain Research, 32(4):497-504. (in Chinese)

[33]
Xu J, Li A Y, Li D et al., 2017. Difference of urban development in China from the perspective of passenger transport around Spring Festival. Applied Geography, 87:85-96.

[34]
Xu Z R, Zhang Y L, Cheng S K et al., 2017. Scientific basis and the strategy of sustainable development in Tibetan Plateau. Science & Technology Review, 35(6):108-114.

[35]
Yang M X, Nelson F E, Shiklomanov N I et al., 2010. Permafrost degradation and its environmental effects on the Tibetan Plateau: A review of recent research. Earth-Science Reviews, 103(1/2):31-44.

[36]
Yao T D, Wu F Y, Ding L et al., 2015. Multispherical interactions and their effects on the Tibetan Plateau’s earth system: A review of the recent researches. National Science Review, 2(4):468-488.

[37]
Yin L S, Feng B Y, Li S G, 2012. Regional development disparities and spatial pattern evolution in Guangdong province. Areal Research and Development, 31(1):30-34, 69. (in Chinese)

[38]
Zhang Y H, Zhang P Y, Zhang Z X, 2010. Disquisition of touristic ecological footprint and sustainable development of Lhasa. China Population, Resources and Environment, 20(7):154-159. (in Chinese)

Outlines

/