
Journal of Geographical Sciences >
Human’s digital footprints on the Qinghai-Tibet Plateau: Variations during festivals and impacts on nature reserves
|
Du Yunyan (1973-), PhD and Professor, specialized in spatio-temporal data mining. E-mail:duyy@lreis.ac.cn |
Received date: 2020-03-22
Accepted date: 2020-09-10
Online published: 2021-04-25
Supported by
Strategic Priority Research Program of the Chinese Academy of Sciences(XDA20040401)
Strategic Priority Research Program of the Chinese Academy of Sciences(XDA19040501)
National Key Research and Development Program of China(2017YFB0503605)
National Key Research and Development Program of China(2017YFC1503003)
National Natural Science Foundation of China(41901395)
Copyright
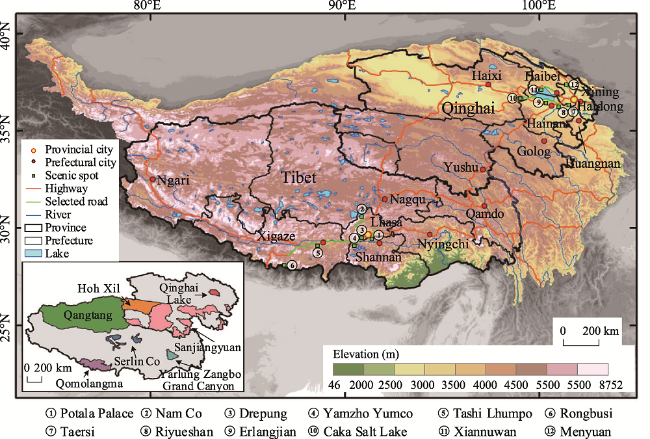
Mobile internet and wireless communication technologies have produced unprecedented location-aware data. Such big geospatial data can be used as a proxy measure of the ‘digital footprints’ left by us on the planet and provide a valuable opportunity to understand the dynamic and short-term human disturbance on the nature at fine scales. This study investigated the spatiotemporal variations of human’s digital footprints on the Qinghai-Tibet Plateau using smartphone-users-generated Tencent’s location request data. The results showed that human’s digital footprints cover less than 5% of Qinghai and Tibet, exhibiting either a U-shaped or an N-shaped temporal change pattern during the major festivals. Spatial changes of the digital footprints manifested a transition process from dispersion to concentration in Xining and Lhasa. Human disturbance assessment of seven large nature reserves on the plateau showed that the Qinghai Lake is the most disturbed one as shown by 14.6% of its area is stained with human digital footprints and the areal average of footprint intensity is 1.59, and the disturbance was significantly escalated during the National Day holiday. By contrast, the Qangtang and Hoh Xil are the least affected nature reserves with the two indices less than 1% and 0.1, respectively.
DU Yunyan , TU Wenna , LIANG Fuyuan , YI Jiawei . Human’s digital footprints on the Qinghai-Tibet Plateau: Variations during festivals and impacts on nature reserves[J]. Journal of Geographical Sciences, 2021 , 31(2) : 179 -194 . DOI: 10.1007/s11442-021-1841-0
Figure 1 Map of the Qinghai-Tibet Plateau |
Table 1 Major festivals celebrated on the Qinghai-Tibet Plateau from January 1, 2018 to February 28, 2019 |
| Festivals | Abbreviation | Start | End | Duration (days) |
|---|---|---|---|---|
| Spring Festival 2018 | SF18 | 2018-02-15 | 2018-02-21 | 7 |
| Qingming Festival | QM | 2018-04-05 | 2018-04-07 | 3 |
| May Day | MD | 2018-04-29 | 2018-05-01 | 3 |
| Dragon Boat Festival | DB | 2018-06-16 | 2018-06-018 | 3 |
| Xuedun Festival | XD | 2018-08-11 | 2018-08-17 | 7 |
| Mid-Autumn Festival | MA | 2018-09-22 | 2018-09-24 | 3 |
| National Day | ND | 2018-10-01 | 2018-10-07 | 7 |
| New Year 2019 | NY | 2018-12-30 | 2019-01-01 | 3 |
| Spring Festival 2019 | SF19 | 2019-02-04 | 2019-02-10 | 7 |
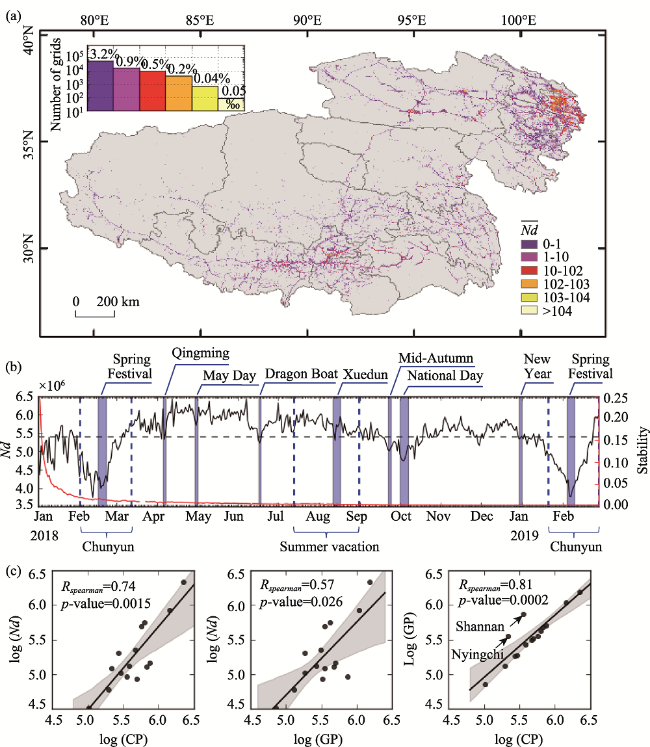
Figure 2 Mean distribution of the digital footprints on the QTP during 2018-2019. (a) the average daily NLR, (b) temporal variations in the daily NLR and the stability index, (c) correlations between daily NLR and census population at a logarithmic scale |
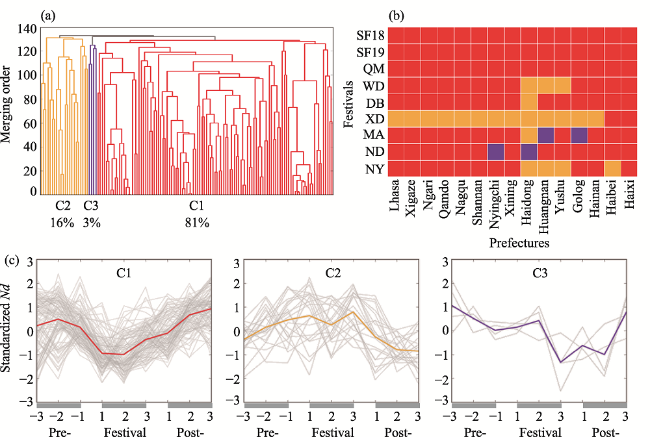
Figure 3 Temporal variation patterns of the Nd in different PAUs during 2018-2019. (a) the hierarchical clustering results, (b) the cluster categories of different cities for different festivals, (c) the temporal variations in the Nd in different city clusters |
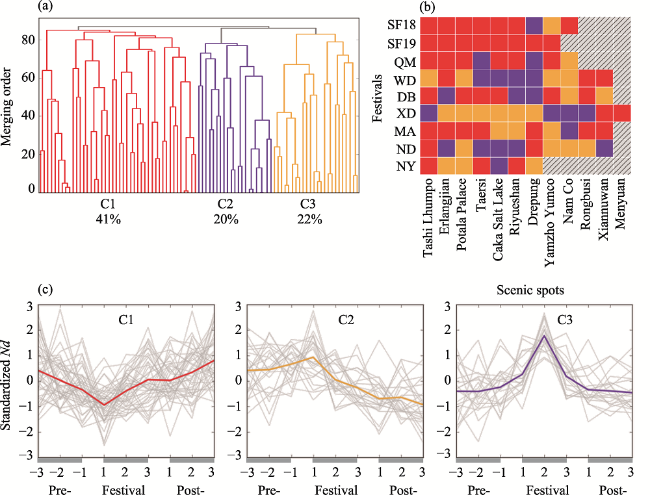
Figure 4 Temporal variation patterns of the Nd at different scenic areas during 2018-2019. (a) the hierarchical clustering results, (b) the cluster categories of different cities for different festivals, (c) the temporal variations in the Nd in different city clusters |
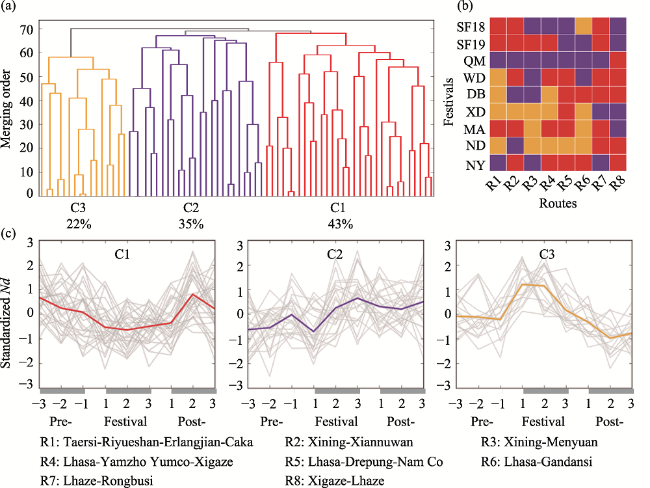
Figure 5 Temporal variation patterns of the Nd along the major routes to the scenic areas during 2018-2019. (a) the hierarchical clustering results, (b) the cluster categories of different cities on different festivals, (c) the temporal variations in the Nd in different city clusters |
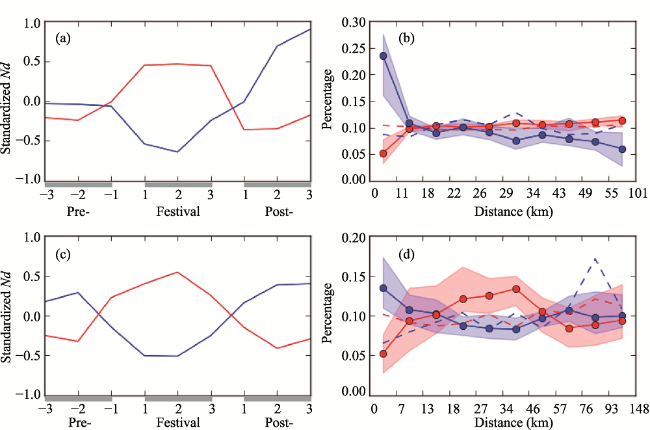
Figure 6 The U-shaped (blue line) and N-shaped (red line) variation patterns of the grids in Xining (a) and Lhasa (c). Variations in percentage of grids showing U-shaped or N-shaped variation patterns in relation to the distance to the city center of Xining (b) and Lhasa (d) during 2018-2019 |
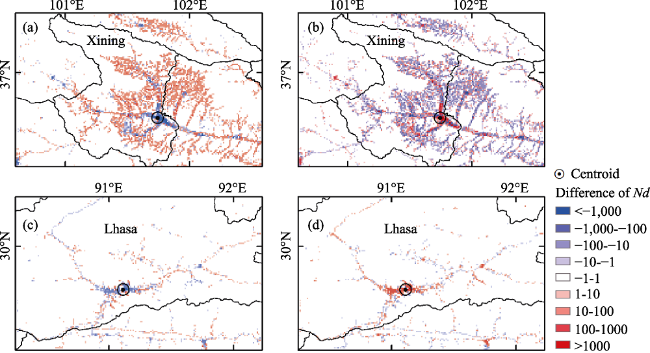
Figure 7 Difference between the festival and the pre-festival Nd (Ndfestival - Ndpre-festival) in Xining (a) and Lhasa (c) and between the festival and the post-festival Nd (Ndpost-fstival - Ndfestival) in Xining (b) and Lhasa (d) |
Table 2 Statistics of the digital footprints and population in the nature reserves during 2018-2019 |
| Nature reserves | Area (10,000 km2) | δ (%) | Population occupancy (%) | ε | Population per grid |
|---|---|---|---|---|---|
| Qangtang | 29.8 | 0.08 | 7.88 | 0.004 | 0.095 |
| Sanjiangyuan | 15.2 | 3.00 | 37.6 | 0.222 | 1.309 |
| Hoh Xil | 4.50 | 0.50 | 2.61 | 0.014 | 0.056 |
| Qomolangma | 3.38 | 5.74 | 47.9 | 0.350 | 2.159 |
| Serlin Co | 2.03 | 3.12 | 43.0 | 0.017 | 1.242 |
| Yarlung Zangbo | 0.92 | 5.28 | 36.4 | 0.916 | 1.283 |
| Qinghai Lake | 0.50 | 14.6 | 23.5 | 1.590 | 2.382 |
Table 3 Short-term changes of digital footprints in nature reserves during 2018-2019 |
| SF18 | SF19 | QM | MD | DB | XD | MA | ND | NY | MAC* | ||
|---|---|---|---|---|---|---|---|---|---|---|---|
| Qangtang | δ (%) | -0.00 | 0.00 | -0.00 | 0.00 | 0.00 | 0.00 | -0.00 | 0.00 | -0.00 | 0.00 |
| ε | -0.00 | -0.00 | -0.00 | -0.00 | -0.00 | 0.00 | -0.00 | -0.00 | -0.00 | 0.00 | |
| Sanjiangyuan | δ (%) | -0.04 | -0.04 | -0.03 | 0.05 | -0.03 | -0.06 | -0.08 | 0.06 | 0.02 | 0.04 |
| ε | 0.01 | -0.01 | 0.02 | -0.01 | -0.02 | 0.02 | 0.00 | 0.03 | -0.01 | 0.01 | |
| Hoh Xil | δ (%) | -0.06 | -0.07 | 0.05 | -0.03 | -0.07 | 0.00 | -0.05 | -0.02 | 0.04 | 0.04 |
| ε | -0.00 | -0.00 | 0.00 | -0.00 | -0.01 | 0.00 | -0.00 | 0.01 | 0.00 | 0.00 | |
| Qomolangma | δ (%) | 0.18 | 0.20 | -0.15 | -0.27 | -0.27 | 0.05 | 0.33 | -0.18 | 0.08 | 0.19 |
| ε | 0.01 | -0.01 | -0.03 | -0.05 | -0.04 | 0.00 | -0.01 | -0.04 | -0.01 | 0.02 | |
| Serlin Co | δ (%) | 0.02 | -0.11 | 0.02 | -0.18 | 0.03 | 0.39 | -0.34 | -0.33 | 0.07 | 0.16 |
| ε | 0.00 | -0.00 | -0.00 | -0.00 | -0.00 | 0.00 | -0.00 | -0.00 | -0.00 | 0.00 | |
| Yarlung Zangbo | δ (%) | 0.13 | 0.22 | -0.08 | -0.19 | 0.16 | -0.03 | -0.05 | -0.03 | 0.39 | 0.14 |
| ε | 0.05 | 0.01 | -0.05 | -0.09 | -0.12 | 0.02 | -0.19 | 0.07 | 0.05 | 0.07 | |
| Qinghai Lake | δ (%) | -1.00 | 0.59 | -0.26 | 0.72 | 0.51 | -0.10 | -0.18 | 1.12 | -0.13 | 0.51 |
| ε | -0.06 | -0.06 | 0.07 | 0.49 | 0.31 | -0.32 | -0.16 | 0.81 | -0.05 | 0.26 | |
*MAC denotes the mean absolute change of index δ or ε. |
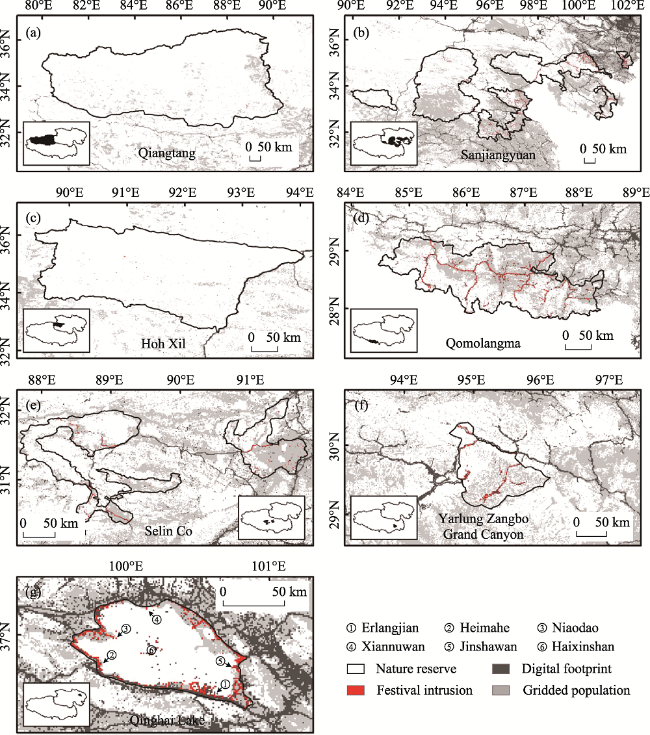
Figure 8 Spatial expansion of human’s digital footprints in the nature reserves of Qangtang (a), Sanjiangyuan (b), Hoh Xil (c), Qomolangma (d), Serlin Co (e), Yarlung Zangbo Grand Canyon (f), and Qinaghai Lake (g) during 2018-2019. The small-scale maps show the spatial area of nature reserves in black color. |
| [1] |
|
| [2] |
|
| [3] |
|
| [4] |
|
| [5] |
|
| [6] |
|
| [7] |
|
| [8] |
|
| [9] |
|
| [10] |
|
| [11] |
|
| [12] |
|
| [13] |
|
| [14] |
|
| [15] |
|
| [16] |
|
| [17] |
|
| [18] |
|
| [19] |
|
| [20] |
|
| [21] |
|
| [22] |
|
| [23] |
|
| [24] |
|
| [25] |
|
| [26] |
|
| [27] |
|
| [28] |
|
/
| 〈 |
|
〉 |