Research Articles

Heterogeneity of water-retention capacity of forest and its influencing factors based on meta-analysis in the Beijing-Tianjin-Hebei region

  • SHI Xiaoli , 1, 3 ,
  • DU Chenliang 1, 2, 3 ,
  • GUO Xudong 4 ,
  • SHI Wenjiao , 2, 5, *
Expand
  • 1. Hebei Key Laboratory of Environmental Change and Ecological Construction, College of Resources and Environmental Sciences, Hebei Normal University, Shijiazhuang 050024, China
  • 2. Key Laboratory of Land Surface Pattern and Simulation, Institute of Geographic Sciences and Natural Resources Research, CAS, Beijing 100101, China
  • 3. Hebei Technology Innovation Center for Remote Sensing Identification of Environmental Change, Shijiazhuang 050024, China
  • 4. Land Surveying and Planning Institute, Key Laboratory of Land Use, Ministry of Natural Resources, Beijing 100035, China
  • 5. College of Resources and Environment, University of Chinese Academy of Sciences, Beijing 100049, China
*Shi Wenjiao (1982–), Professor, specialized in global change and regional agriculture. E-mail:

Shi Xiaoli (1981–), Professor, specialized in global change and ecosystem. E-mail:

Received date: 2020-09-17

  Accepted date: 2020-11-30

  Online published: 2021-03-25

Supported by

National Key R&D Program of China(2017YFA0604703)

National Natural Science Foundation of China(41771111)

Hebei Natural Science Foundation(D2019205123)

Youth Innovation Promotion Association, No.(2018071)

Research Fund Project of Hebei Normal University(L052018Z09)

Key Subject of Physical Geography of Hebei Province

Investigation and Monitoring Project of Ministry of Natural Resources(JCQQ191504-06)

Copyright

Copyright reserved © 2021. Office of Journal of Geographical Sciences All articles published represent the opinions of the authors, and do not reflect the official policy of the Chinese Medical Association or the Editorial Board, unless this is clearly specified.

Abstract

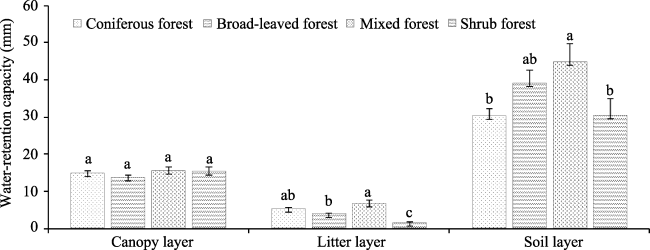
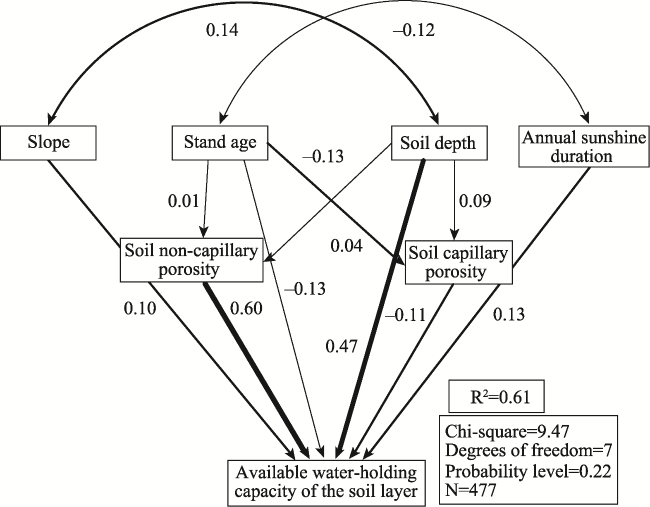
Water retention is important in forest ecosystem services. The heterogeneity analysis of water-retention capacity and its influencing factors is of great significance for the construction of water-retention functional areas, restoration of vegetation, and the protection of forest ecosystems in the Beijing-Tianjin-Hebei region. A total of 1366 records concerning water-retention capacity in the canopy layer, litter layer, and soil layer of forest ecosystem in this region were obtained from 193 literature published from 1980 to 2017. The influencing factors of water-retention capacity in each layer were analyzed, and path analysis was used to investigate the contribution of the factors to the water-retention capacity of the three layers. The results showed that mixed forests had the highest water-retention capacity, followed by broad-leaved forests, coniferous forests, and shrub forests. In addition, no matter the forest type, the ranking of the water-retention capacity was soil layer, canopy layer, and litter layer from high to low. The main influencing factors of water-retention capacity in forest canopy were leaf area index and maximum daily precipitation (R 2=0.49), and the influencing coefficients were 0.34 and 0.30, respectively. The main influencing factors of water-retention capacity in the litter layer were semi-decomposed litter (R 2=0.51), and the influencing coefficient was 0.51. The main influencing factors of water-retention capacity in the soil layer were non-capillary porosity and soil depth (R 2=0.61), the influencing coefficients were 0.60 and 0.38, respectively. This study verifies the simulation of the water balance model or inversion of remote sensing of the water-retention capacity at the site scale, and provides scientific basis for further study of the impact of global change on water retention.

Cite this article

SHI Xiaoli , DU Chenliang , GUO Xudong , SHI Wenjiao . Heterogeneity of water-retention capacity of forest and its influencing factors based on meta-analysis in the Beijing-Tianjin-Hebei region[J]. Journal of Geographical Sciences, 2021 , 31(1) : 69 -90 . DOI: 10.1007/s11442-021-1833-0

1 Introduction

The forest ecosystem, consisting of abundant species and hierarchical structures, is a unified system of interaction between forest organisms and the environment, with energy flow and matter recycling. The forest ecosystem provides services including climate regulation, water retention, wind prevention, sand fixation and so on (Lv et al., 2015; Han et al., 2019). As one of the significant functions of the forest ecosystem, water retention plays a crucial role in protecting water resources, restoring vegetation, and controlling soil desertification and erosion (Zeng et al., 2018). With the acceleration of human demand for water resources and the utilization of forest resources, the forest ecosystem and its hydrological regulation have been seriously affected. The Beijing-Tianjin-Hebei (BTH) region in China has considerable development potential, but the supply-demand contradiction of water resources is significant, which poses a threat to ecological and economic security (Bao and Zou, 2018). Research on the water retention of forest in the BTH region is essential with regard to vegetation restoration and the construction of ecological civilization. Moreover, this research also provides scientific guidance with respect to modes of forest management, improving the capacity of forest-water retention and supporting the construction of water-retention functional areas in Beijing (Ma et al., 2017a).
Much research has been conducted on the water retention of forest, mainly by means of experimental observation and system simulation (Wang et al., 2013; Hou et al., 2018a). Experimental observation primarily depends on the comprehensive water-storage capacity method; this method differentiates the water-holding capacity of the canopy layer, litter layer, and soil layer (Wu et al., 2020). Reliable data and the environmental conditions of sites can be accurately recorded using this method. However, observations are often limited to the site scale and hard to collect. Thus, the experimental observation is not suitable for the study of forest water-retention capacity on a large scale. In addition, most existing studies focus on a single layer of the forest, so comprehensive reports covering the overall canopy layer, litter layer, and soil layer are limited. However, some scholars have analyzed and compared forest water-retention capacities using a water-balance method (Zhang et al., 2008; Ma et al., 2017b; Zhai et al., 2019). With progress being made in remote sensing and geographic information systems, hydrological models are increasingly employed to evaluate water-retention capacity. For example, scholars have used the Integrated Valuation of Ecosystem Services and Tradeoffs model (InVEST) (Yu et al., 2012; Pan et al., 2013; Bao et al., 2016), Soil and Water Assessment Tool model (SWAT) (Wang et al., 2010; Zhou et al., 2013; Hou et al., 2018b; Li et al., 2019a), and the Soil Conservation Service model (SCS) (Chen et al., 2017) to evaluate the water-retention capacity of important ecological reserves, such as the Loess Plateau, the Three-River Source region, the BTH region, and the Qilian Mountains. Simulations expand the spatial scale of traditional experimental observation and have been proved suitable for the estimation of water-retention capacity at large scales, with data relatively easy to obtain. Such simulations have made possible the evaluation of the spatiotemporal changes of water-retention capacity; however, they have difficulty in analyzing and comparing differences in water-retention capacity in forest types and layers. In addition, the evaluation accuracy of such simulations principally depends on remote sensing data; and the understanding of the water cycle mechanism needs to be improved.
In previous studies, the influencing factors of forest water-retention capacity mainly focused on meteorology (precipitation, temperature, and evapotranspiration), topography (elevation, slope), and vegetation characteristics (stand density, the proportion of semi-decomposed layer). In these studies, some statistical analysis, such as correlation analysis, trend tests, and stepwise regression, have been used to explore the influencing factors of forest water-retention capacity (Niu et al., 2015; Chen et al., 2016a; Yin et al., 2016; Gong et al., 2017b). However, most studies have only focused on the influence of a specific factor on water-retention capacity, rather than comprehensively analyzing the influence of multiple factors, and the indirect effects on the water-retention capacity of the influencing factors were still hard to describe.
There are few reports that systematically summarized the general patterns of previous results, as well as the influencing factors of water-retention capacity. Based on meta-analysis of the observational-site data, the heterogeneity of forest water-retention capacity, subject to environmental gradients in the BTH region, was investigated using a comprehensive water-storage capacity method. Pearson correlation was used to analyze the most important factor of water-retention capacity, and path analysis was employed to comprehensively explore the direct and indirect effects of each influencing factor on water-retention capacity. Then, the contributions of the influencing factors were evaluated comprehensively and quantitatively. Meta-analysis overcame the spatiotemporal limitation of experimental observation, ensuring data reliability, and providing strong support for the mechanism interpretation of water retention. This study not only enriches the evaluation methods of forest water-retention capacity, but also provides a scientific basis for better understanding the heterogeneity and the influencing factors of forest water-retention capacity in the BTH region.

2 Data and methods

2.1 Study area

The BTH region is located in the North China Plain and includes Beijing, Tianjin, and Hebei Province, with an area of 21.8×10⁶ hm2. It is bordered by the Bohai Sea in the east, the Taihang Mountains in the west, and the Yanshan Mountains and Zhangbei Plateau in the north. The northwestern part is high, and the southeastern is low. The region has a temperate continental climate and four distinct seasons, with an average temperature of less than 3°C in January and 18-27°C in July. The annual sunshine duration is 2300 hours, and the frost-free period is 81-204 days. With an average annual value of 484.5 mm, the precipitation is higher in the southeast than in the northwest. The forest ecosystem is mainly distributed in the west of Taihang Mountain and the north and northeast of Yanshan Mountain. The forest areas of Beijing, Tianjin, and Hebei Province are 58.81×10⁴ hm2, 11.16×10⁴ hm2, and 439.33×10⁴ hm2, respectively, and forest coverage rates are 35.84%, 9.87%, and 23.41%, accordingly. The predominant forest types are cold-temperate coniferous forest (including Larix principis-rupprechtii, Pinus sylvestris, Pinus tabuliformis, and Platycladus orientalis), deciduous broad-leaved forest (including Quercus liaotungensis, Quercus Mongolica, Robinia pseudoacacia, and Salicaceae), temperate coniferous and broad-leaved mixed forest (including mixed Betula platyphylla and Larix principis-rupprechtii plantations, mixed Pinus tabulaeformis and Platycladus orientalis plantations), and the shrub forest (including Corylus heterophylla, Hippophae rhamnoides, Spiraea, Caragana microphylla Lam, and Rosa multifolora Thunb). There are various types of soil, mainly including chestnut soils, brown soils, cinnamon soils, and fluvo-aquic soils.

2.2 Data

2.2.1 Meta-analysis data
The meta-analysis data in the BTH region were extracted from the literature of China National Knowledge Infrastructure (https://www.cnki.net/), Web of Science (http://isiknowledge.com/), and Google Scholar (http://scholar.google.com/) for the period from 1980 to 2017. “Canopy” plus “interception,” “litter storage” plus “litter mass,” and “effective storage capacity” plus “available water-holding capacity” plus “porosity” were used as the keywords to select and collect the related literature for the canopy, litter, and soil layer of the forest, respectively. After selection and validation of related literature, the key contents identified for discussion included the canopy layer, litter layer, and soil layer which were comprised by 56 articles, 136 articles, and 104 articles, respectively.
Based on the literature, the environmental information of observational sites (observation year, site location, latitude and longitude, climate type, annual average temperature, evapotranspiration, stand type, dominant tree species, stand age, soil type), and the key parameters of the water-retention capacity for the canopy layer, litter layer, and soil layer of the forest were extracted to construct a meta-analysis water-retention database. The key parameters included canopy layer parameters (rainfall outside the forest, rainfall time, interception volume, interception rate), litter layer parameters (litter depth, litter mass, maximum water-holding ratio, maximum water-holding capacity), and soil layer parameters (soil depth, non-capillary porosity, bulk density, soil available (or non-capillary) water-holding capacity). After extraction, the number of observation sites and their records in the canopy layer, litter layer, and soil layer comprised 68 sites (203 records), 136 sites (686 records), and 112 sites (477 records), respectively. Most of the sites were in the Yanshan mountainous areas in the north, while a few sites were in the Taihang mountainous areas in the southwest of the BTH region (Figure 1).
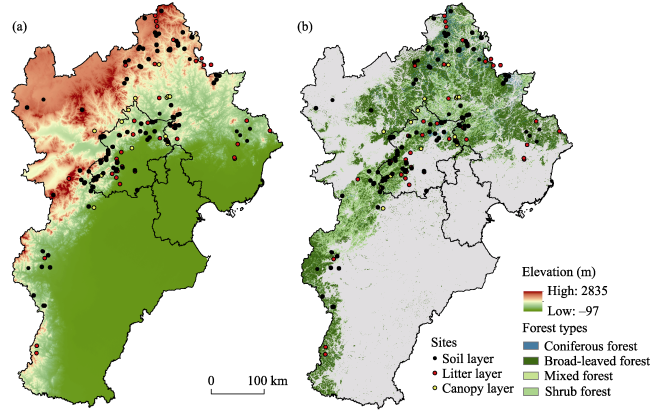
Figure 1 Site distribution in the study area
2.2.2 Spatial data
Because most observation records concentrated on the period of 2000-2015 (accounting for 96% of all the observation records), the spatial data from this period were selected to supplement the meta-analysis database (Figure 2). The precipitation data were taken from the Meteorological Science Data Center of the Information Center of China Meteorological Administration (http://data.cma.cn/) and then interpolated into 1 km resolution using the ANUSPLIN software package. The annual sunshine duration, leaf area index (LAI), evapotranspiration, and fractional vegetation coverage (FVC) were taken from the National Earth System Science Data Center of China (http://www.geodata.cn/). The resolutions of annual sunshine duration, LAI, and FVC were all 1 km, and the resolution of evapotranspiration was 5 km. Normalized difference vegetation index (NDVI) data were taken from the Resource and Environmental Science Data Center of the Chinese Academy of Sciences (CAS) (http://www.resdc.cn/), with a resolution of 1 km. Soil data were taken from the Cold and Arid Region Scientific Data Center of the CAS (http://data. casnw.net/), with a resolution of 1 km. Shuttle Radar Topography Mission (SRTM) DEM 90-m elevation data were taken from the Geospatial Data Cloud (http://www.gscloud.cn/). The land cover data from 2010 were taken from the Big Earth Data Science Engineering Project (http://data.casearth.cn/), with a resolution of 30 m. Based on the latitude and longitude of each observation site, the annual values of the climate and vegetation data of the corresponding position were extracted and supplemented to the meta-analysis database, which improved the climate, topography, and vegetation information of the experimental observation, and provided a data basis for the following study on the influencing factors of water-retention capacity.
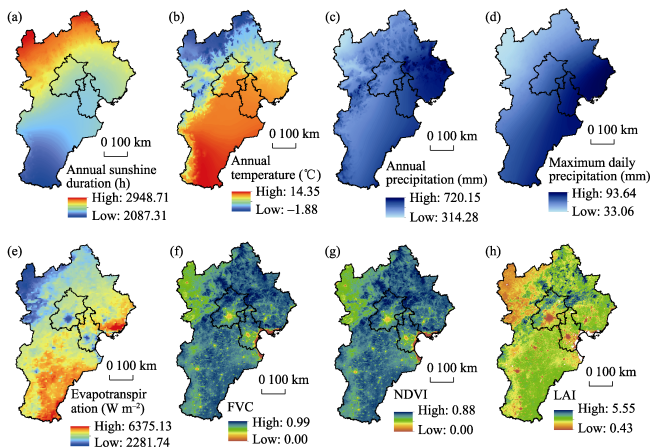
Figure 2 Spatial distributions of climate and vegetation in the BTH region

2.3 Methods

2.3.1 Evaluation of forest water-retention capacity
Differences in the precipitation-storage capacity of the canopy layer, litter layer, and soil layer can be explored using a comprehensive water-storage capacity method. The canopy is the first storage layer to intercept precipitation, and canopy interception capacity has a close relationship with tree species, leaf characteristics, precipitation intensity, and precipitation duration (Wu et al., 2016). The water-retention capacity of the forest canopy has been expressed in terms of interception capacity, with the following calculation (Liu et al., 2016):
$CI_{i}=\alpha_{i}\times R_{i}$
where CIi represents the canopy interception capacity, αi the canopy interception rate, and Ri the maximum daily precipitation—all in the ith forest sublot.
Litter intercepts precipitation, reducing soil erosion at the Earth’s surface. The water-retention capacity of the litter layer is expressed by the maximum water-holding capacity of the litter, calculated by the following (Liu et al., 2016):
$LH_{i}=\beta_{i}\times W_{i}$
where LHi represents the maximum water-holding capacity of the litter, βi the litter mass, and Wi the maximum water-holding ratio—all in the ith forest sublot.
The soil intercepts precipitation in its third layer. Non-capillary pores comprise the main channel for the movement of soil gravity water; so water storage in the soil layer is expressed as the available (non-capillary) water-holding capacity (He et al., 2011), calculated by the following (Liu et al., 2016):
$SS_{i}=\gamma_{i}\times D_{i}$
where SSi represents the available water-holding capacity of the soil, γi the soil non-capillary porosity, and Di the soil depth—all in the ith forest sublot.
2.3.2 Path analysis
Path analysis is a confirmatory statistical technique to explore the causal structure between multiple variables, and is mainly based on the covariance matrix to analyze the relationship between variables (Wang and Zhou, 2014; Sahanavin et al., 2018; Ji et al., 2019). Path analysis measures the direct and indirect effects of the influencing factors and determines the causality between variables using correlation coefficients and path coefficients, respectively (Eisenhauer et al., 2015; Fanin and Bertrand, 2016; Luo et al., 2017):
$\mu=B\mu +\Gamma\delta+\zeta$
where μ is a vector containing endogenous variables, Β is a vector representing the interactions between the components of endogenous variables μ, Γ is the influence of exogenous variables δ on endogenous variables μ, δ is a vector composed of exogenous variables, and ζ represents the residuals.
A path analysis of the influencing factors of water-retention capacity was constructed for different layers in the forest ecosystem. The dependent variables were comprised by the interception capacity of the canopy layer, maximum water-holding capacity of the litter layer, and the available (non-capillary) water-holding capacity of the soil layer. Based on a correlation analysis of the influencing factors and dependent variables of each layer in the database, factors that passed a significance test were selected as the independent variables of each layer and included in a path map.

3 Results and discussion

3.1 Spatial distribution of water-retention capacity of forest in the BTH region

In the canopy layer, the average water-retention capacity was 14.87 mm, and little difference existed among forest types (Figure 3). Well-developed shrub forest was beneficial to water retention (Jia et al., 2012). In the litter layer, mixed forest had the largest water-retention capacity (6.65 mm), closely related to litter mass and its decomposition degree. In contrast, shrub forest had the lowest water-holding capacity (1.38 mm) due to the lowest litter mass. In the soil layer, the water-retention capacity was much higher than that of canopy and litter layers. The differences in accumulation of surface soil material, distribution of root systems, and improvement in the physical properties of soil resulted in considerable heterogeneity in soil water-retention capacity. Mixed forest had the largest (45.02 mm), and coniferous forest had the lowest water-holding capacity (30.41 mm) in the soil layer. Generally, the water-retention capacity of mixed forest was the highest among all layers, followed by that of broad-leaved forest, coniferous forest, and shrub forest. No matter the forest type, the ranking of water-retention capacity was soil layer, canopy layer, and litter layer from high to low.
Figure 3 Water-retention capacities of different forest types and layers

3.2 Correlation analysis on influencing factors of forest water-retention capacity

3.2.1 Canopy layer
Canopy interception capacity was positively correlated with maximum daily precipitation, evapotranspiration, LAI, tree diameter at breast height (DBH), slope and stand age. However, the canopy interception capacity negatively correlated with annual sunshine duration, latitude, and elevation (Table 1).
Table 1 Correlation between water-retention capacity and its influencing factors of the canopy layer
Sunshine duration Maximum daily precipitation LAI Latitude Evapotranspiration Elevation DBH Slope Stand age Canopy
interception
Sunshine duration 1
Maximum daily precipitation -0.75** 1
LAI 0.00 -0.57** 1
Latitude 0.58** -0.38** 0.56* 1
Evapotranspiration -0.48 0.60** -0.23 -0.17 1
Elevation 0.54 -0.42** 0.42 0.58** -0.55** 1
DBH -0.26 0.19 0.36 0.21* -0.38** 0.25** 1
Slope -0.31 0.07 0.47* -0.22** -0.34** 0.18* -0.04 1
Stand age -0.21 0.10 0.76** -0.21* -0.06 -0.16 0.25** 0.13 1
Canopy in
terception
-0.61** 0.49** 0.47* -0.30** 0.28** -0.27** 0.24* 0.23** 0.22* 1

Note: ** indicates a significant degree of correlation of 0.01, and * indicates a significant degree of correlation of 0.05.

In the meteorological indices, the correlation coefficient between maximum daily precipitation and canopy interception capacity was 0.49, which showed that precipitation was the most important factor in water-retention capacity. In general, canopy interception is closely related with precipitation amount and intensity. Within a certain range of precipitation, the canopy interception increases with the increasing precipitation. For a given amount of precipitation, a greater precipitation intensity results in a greater scouring on branches and leaves; the amount of interception and its rate then decrease (Song, 2015). In addition, there was a positive correlation between evapotranspiration and interception capacity (0.28); interception of the canopy increased with increasing evapotranspiration, and thus, overall interception capacity was enhanced.
In the vegetation indices, the correlation coefficient between LAI and canopy interception capacity was 0.47, indicating a clear exponential-growth relationship between them (Wang et al., 2016a). The LAI determines the contact area between the branches and leaves and precipitation, and it affects interception. In addition, with increasing stand age, DBH increases (Lu et al., 2015), branches and leaves become more luxuriant, and LAI increases. These vegetation characteristics (stand age and DBH) are significantly positively correlated with interception (Park and Cameron, 2008).
In the topographic indices, the correlation coefficient between slope and canopy interception capacity was 0.23, mainly because forest coverage was relatively high and mainly distributed over mountainous areas with a slope below 20°; forest area showed an increasing trend with increasing slope. From correlation analysis, the LAI also showed an increasing trend with increasing slope (Table 1), so canopy interception capacity was enhanced. These results are consistent with those concerning large-scale regions (Gong et al., 2017b; Wang et al., 2019).
Among the factors negatively correlated with canopy interception, annual sunshine duration had the largest negative coefficient with -0.61. As one of the important factors of climate, sunlight is the main driver in temperature and precipitation change. Previous studies showed a negative correlation between sunshine duration and precipitation (Yu et al., 2011), verified by a negative correlation between sunshine duration and maximum daily precipitation (Table 1). Location or topographic indices also had a negative effect on canopy interception; the correlation coefficients between latitude, elevation and canopy interception capacity were -0.30 and -0.27, respectively. The elevation in the BTH region increased with increasing latitude and significantly negatively correlated with maximum daily precipitation and evapotranspiration. Precipitation and evapotranspiration were the main factors in canopy interception.
3.2.2 Litter layer
Litter mass had the largest correlation coefficient with the maximum water-holding capacity of the litter (0.83), in which the semi-decomposed and undecomposed layers were 0.82 and 0.71, respectively (Table 2). Litter on the Earth’s surface is the main holder of water, and the larger its mass is, the greater its water-holding capacity. In the topographic indices, elevation and slope were positively correlated with maximum water-holding capacity of the litter, and the correlation coefficients were 0.25 and 0.13, respectively. The elevation had significant correlation with litter mass, evapotranspiration and temperature. In areas of high elevation, the proportion of semi-decomposed litter is high because of low temperature and weak evapotranspiration, conducive to litter holding water (Niu et al., 2015). The positive correlation between slope and precipitation indicates that rising slope increases precipitation and promotes litter water-holding capacity. In the vegetation indices, stand age and canopy density directly affected litter mass, correlation coefficients between water-retention capacity and stand age was 0.18, higher than that of canopy density (0.15), they are the key factors in litter water-holding capacity (Ling et al., 2009). Meteorological factors had a weak correlation with the maximum water-holding capacity of the litter, and the coefficients of precipitation and temperature with the water-retention capacity were only 0.12 and -0.10, respectively.
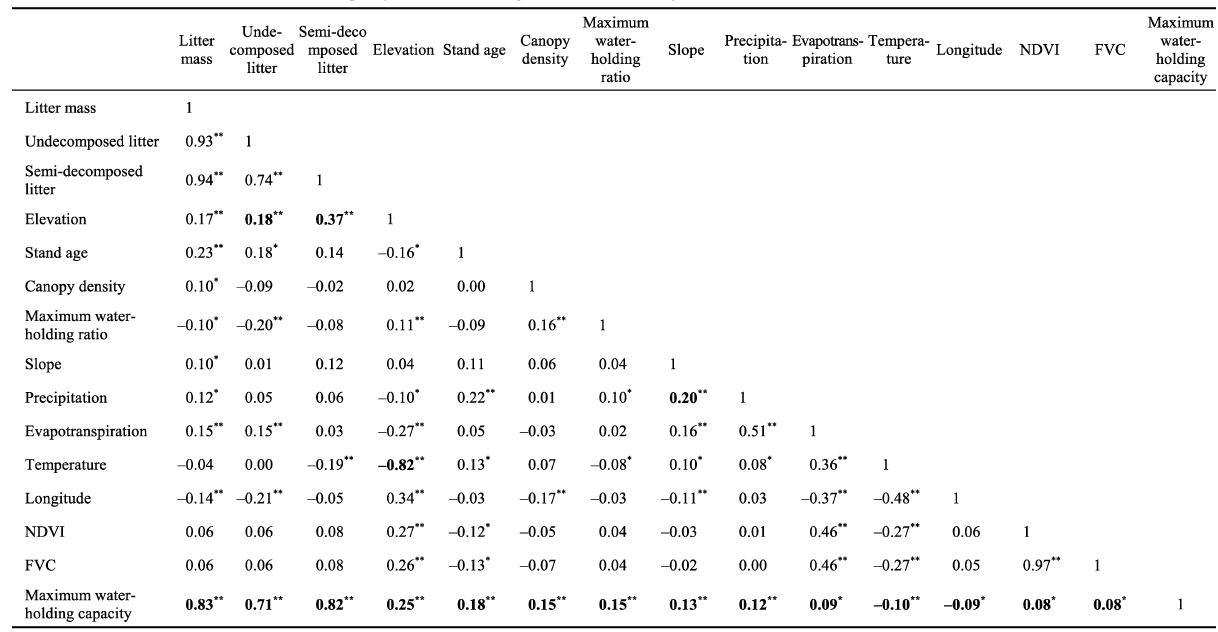
Table 2 Correlation between water-retention capacity and its influencing factors of the litter layer

Note:**indicates a significant degree of correlation of 0.01;*indicates a significant degree of correlation of 0.05.

3.2.3 Soil layer
The predominant factors in the available water-holding capacity of the soil layer were soil characteristics (Table 3). Among positive correlation factors of the soil water-retention capacity, non-capillary porosity and soil depth had the strongest correlation with water-retention capacity, with correlation coefficients of 0.58 and 0.39, respectively. Non-capillary porosity constitutes the main storage facility of soil moisture, and precipitation is mainly trapped in non-capillary pores. In general, the greater the non-capillary porosity is, the stronger the soil water-retention capacity (Lu et al., 2013).
Table 3 Correlation between water-retention capacity and its influencing factors of the soil layer

Note:**indicates a significant degree of correlation of 0.01;* indicates a significant degree of correlation of 0.05.

In the meteorological indices, the soil available water-holding capacity had strong correlation with annual sunshine duration and precipitation, with correlation coefficients of 0.32and 0.18, respectively. The effect of sunshine duration on soil water-holding capacity is mainly reflected by climate change, such as light, temperature, precipitation, and heat. In general, soil depth decreases with increasing slope, and soil water-retention capacity also decreases. However, the correlation coefficient between slope and soil available water-holding capacity was 0.20 in our study, which may be because field observations were mainly obtained by collecting soil profiles of a given depth, not the true depth of the soil. For each experimental site in the BTH region, the sampling depth of the soil profile fluctuated slightly by an average of 40 cm. In this case, the site environment and soil physical properties changed with increasing slope, and the soil available water-holding capacity also tended to increase.
In the vegetation indices, the correlation coefficient between the stand density and soil available water-holding capacity was 0.18. On the one hand, with increasing stand density, increasing litter mass inhibits the evaporation of water in the soil; on the other hand, a large amount of humus formed by litter decomposition and the development of plant roots loosens soil structure and increases non-capillary pores, increasing the available water-holding capacity of the soil layer.
Among the negative correlation factors, the correlation coefficient between capillary porosity and soil available water-holding capacity was the largest (-0.31). This is because soil pores are composed of capillary pores and non-capillary pores, and the water stored in capillary pores is needed for plant growth. In fact, the available water-holding capacity in non-capillary pores represents the soil water-retention capacity, and an increase in the number of capillary pores will inhibit the soil available water-holding capacity to a certain extent. Other soil characteristics, such as CaCO3 content and bulk density, had little influence on the water-retention capacity of the soil layer. In the meteorological indices, the impact of evapotranspiration on soil available water-holding capacity cannot be ignored—the correlation coefficient was -0.25—which proved that surface evaporation causes a loss of soil water.

3.3 Heterogeneity of forest water-retention capacity in environmental gradients

3.3.1 Canopy layer
For the canopy layer of the forest, canopy interception decreased with increasing elevation, it also increased with increasing DBH, LAI, maximum daily precipitation, and evapotranspiration. However, the canopy interception increased at first and then decreased with increasing stand age (Figure 4). Canopy interception capacity reached the highest value (15.95 mm) in an area with an elevation between 40 m to 500 m, decreasing slowly with increasing elevation (8.40 mm in the highest elevation areas) (Figure 4a). When the DBH was less than 20 cm, interception capacity did not change significantly, with an average value of 14.46 mm, and then increased with increasing DBH (23.16 mm in a DBH of 30-38 cm) (Figure 4b). Similarly, interception capacity did not change significantly when the LAI was between 0.78 and 2.50, but increased significantly when the LAI was greater than 2.50 (Figure 4c). The interception capacity increased with increasing maximum daily precipitation. However, the interception rate kept constant at 25%. Interception capacity increased rapidly when evapotranspiration was between 753 mm and 1618 mm, but the increase was no longer significant when evapotranspiration was greater than 1618 mm (Figure 4e). Stand age affects interception capacity by changing canopy structure (canopy density, branch and leaf quantity). In general, the amounts of branches and leaves increase with increasing stand age; then, interception capacity also increases. However, in this study, interception capacity increased at first and then decreased with increasing stand age. This may be because the stand ages selected from the literature were mainly below 60 years: a stand age of less than 40 years was comprised mainly by mixed forest, and stand age of 40-60 years mainly pure coniferous forest. Experimental observation showed that the average interception rate of mixed forest and pure coniferous forest were 26.92% and 23.98%, respectively. The interception capacity of mixed forest was slightly higher than that of pure coniferous forest because of the former’s multi-layer structure (Figure 4f).
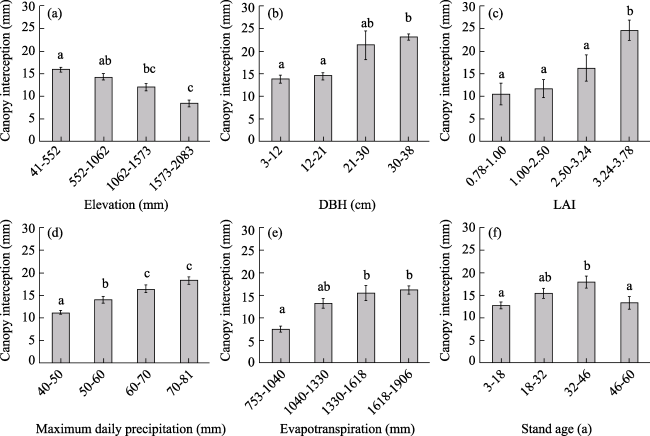
Figure 4 Water-retention capacity of the canopy layer for different environmental gradients
3.3.2 Litter layer
The maximum water-holding capacity of litter increased with increasing elevation, vegetation index, and litter mass, and first increased and then decreased with increasing stand age (Figure 5). The maximum water-holding capacity of litter fluctuated slightly for an elevation of 436-1388 m, reaching 7.18 mm when the elevation was 1388-2179 m (Figure 5a). The vegetation index, which represents vegetation growth, was closely related to litter mass. When litter mass reached a maximum (252 t/hm2), the maximum water-holding capacity also reached a maximum (10.90 mm) (Figures 5b and 5c). The change in litter maximum water-holding capacity in the age gradient was consistent with that in canopy interception capacity. The output of branches and leaves of trees for different stand ages led to different litter mass and water-holding capacities. The litter water-holding capacity reached a maximum in 33-43 years of the stand age, and then showed a downward trend (Figure 5d).
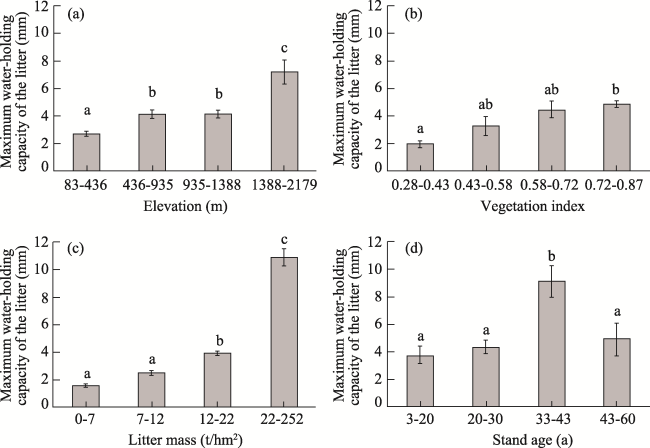
Figure 5 Water-retention capacity of the litter layer for different environmental gradients
3.3.3 Soil layer
The available water-holding capacity of soil increased with increasing non-capillary porosity and precipitation, and decreased with increasing capillary porosity and stand age (Figure 6). The range of soil non-capillary porosity in the BTH region was 0.61%-34.72%, and the highest available water-holding capacity was 66.22 mm, when non-capillary porosity was 12.18%-34.72%. The greater the available water-holding capacity was, the stronger the soil water-holding capacity (Zhao et al., 2012). Moreover, non-capillary pores had a high rainfall receptive capacity, while capillary pores stored long-term water for plant roots to absorb and soil to evaporate (Figures 6a and 6b). The soil layer was the main medium of forest water retention, and its available water-holding capacity increased with increasing precipitation. The available water-holding capacity of the soil layer was higher than that of the canopy and litter layer, and its maximum value was 47.02 mm, with a precipitation of 530-647 mm (Figure 6c). Stand age influenced the available water-holding capacity of soil mainly by improving soil characteristics. In general, with increasing stand age, the decomposition of soil surface litter produces more humus, which loosens soil texture and enhances water-retention capacity. However, in this study, the available water-holding capacity of soil decreased with increasing stand age due to differences in the litter decomposition rate with respect to tree species (Figure 6d). The surface of the coniferous forest litter was hard and rich in wax, which prevented the entry of microorganisms and decomposed slowly; in contrast, broad-leaved forest can be decomposed more easily because of its thin epidermis (Chen et al., 2016b). According to tree species statistics in the meta-analysis database, with increasing stand age, the proportion of coniferous forest increased, the average non-capillary porosity of each gradient decreased from 9.74% to 8.67%, and the improvement in soil porosity was reduced.
Figure 6 Water-retention capacity of the soil layer for different environmental gradients

3.4 Influencing factors of forest water-retention capacity

The fit index of path analysis explained 49%, 51%, and 61% of the variation in water-retention capacity for the canopy, litter and soil layer, respectively (Table 4). The significant factors affecting the water retention capacity were mainly explained by path map and effect value, and the influence effect was classified as direct effect, indirect effect, and total effect (Chen et al., 2018a; Chen et al., 2018b).
Table 4 Goodness of fit index of path analysis
Index Meaning Reference ranges Values of fit index in layers
Canopy Litter Soil
c2 Chi-square value The smaller the value, the better 7.94 3.80 9.47
c2/df Chi-square degree of freedom ratio < 2 0.16 1.27 1.35
P Probability of significance > 0.05 0.16 0.28 0.22
RMSEA The root-mean-square error of
approximation
< 0.05, very good; 0.05-0.08, good; 0.05-0.08, moderate; 0.08-0.10,
fair; > 0.10, poor
0.05 0.02 0.03
CFI Comparative fit index > 0.90 0.995 0.999 0.995
NFI Normal fit index > 0.90 0.986 0.997 0.983
3.4.1 Canopy layer
Significant factors affecting the water-retention capacity of the canopy layer include meteorological conditions, vegetation characteristics, and geographical location (Cui et al., 2019) (Figure 7). With regard to direct effects, the LAI had the strongest effect on interception capacity, and the influence coefficient was 0.39. The LAI directly affects the contact area between the branches and leaves and rainfall, which is very important for the level of canopy interception capacity (Wang et al., 2016a). The effect of maximum daily precipitation on canopy interception capacity was second to the LAI, and the direct influence coefficient was 0.30. Moreover, DBH greatly impacted the water-retention capacity of the canopy layer, and the influence coefficient was 0.21. DBH not only affected the canopy’s width and depth, but also its leaf area and interception capacity, the latter being affected by changes in canopy structure (Li et al., 2019b). The direct effect of evapotranspiration on canopy interception capacity was 0.12. Evapotranspiration occurred in the whole process of canopy interception. Rainfall intercepted and absorbed by branches and leaves continued to evaporate, and new rainfall was intercepted constantly. The evaporated part of the rainfall comprised part of the canopy interception capacity. Thus, the greater the effect of meteorological factors (temperature and wind speed) on evapotranspiration, the greater the additional interception capacity and total canopy interception capacity, especially in long-term continuous precipitation. In addition, the annual sunshine duration and elevation had negative effect on interception capacity, and the influence coefficients were -0.20 and -0.11, respectively. Differences in interception capacity were strongly dependent on meteorological conditions and geographical location (Xu et al., 2019).
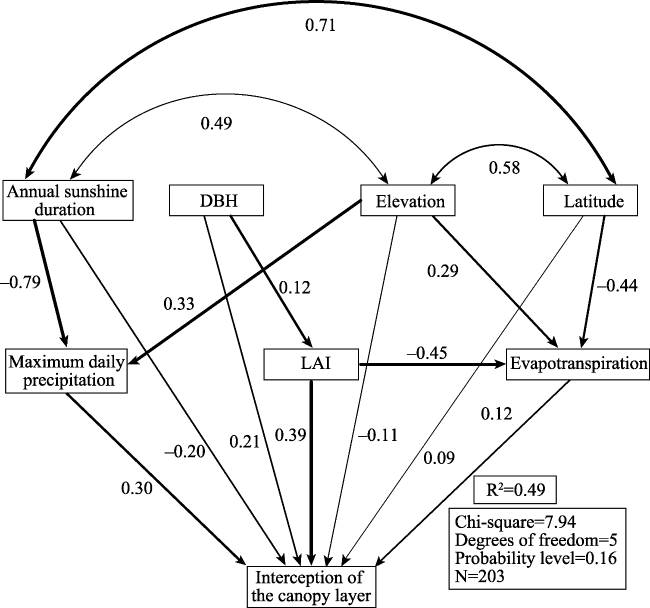
Figure 7 Fitting results of path analysis for the canopy layer
With regard to indirect effects, the interaction between sunshine duration and precipitation had a negative effect on interception capacity, and the influence coefficient was -0.24. A change in DBH led to a change in LAI, which had an indirect effect on interception capacity, and the influence coefficient was 0.12. Overall, the indirect effects on interception capacity were relatively weak.
With regard to total effects, LAI and the maximum daily precipitation were the predominant factors in water-retention capacity of the canopy layer, and the total influence coefficients were 0.34 and 0.30, respectively. Vegetation characteristics, such as the density and shape of branches and leaves, determined the interception area, while the maximum daily precipitation determined the precipitation that could be absorbed by the surface of branches and leaves. In general, interception capacity increases with increasing maximum daily precipitation (Niu et al., 2015). The influence coefficients of DBH and evapotranspiration were 0.26 and 0.12, respectively, and the influence coefficient of sunshine duration on the canopy water-retention capacity was ‒0.44.
3.4.2 Litter layer
With regard to direct effects, the maximum water-holding capacity of litter was closely related to litter mass. In general, the greater the litter mass is, the greater the water-holding capacity is (Figure 8). Many studies have shown that the water-holding capacity of litter is also related to litter decomposition, and that the water-holding capacity of the semi-decomposed layer is higher than that of the undecomposed layer (Hu et al., 2008). Experimental observation of the meta-analysis database indicated that the water-holding capacity of the semi-decomposed layer was higher than that of the undecomposed layer by 24.57%, path analysis indicated something similar. The direct influence coefficient of the undecomposed layer was only 0.19, which was obviously less than that of the semi-decomposed layer (0.51). In addition, the direct influence coefficient of canopy density was 0.12, suggesting that a high canopy density led to a high litter mass and high water-holding capacity.
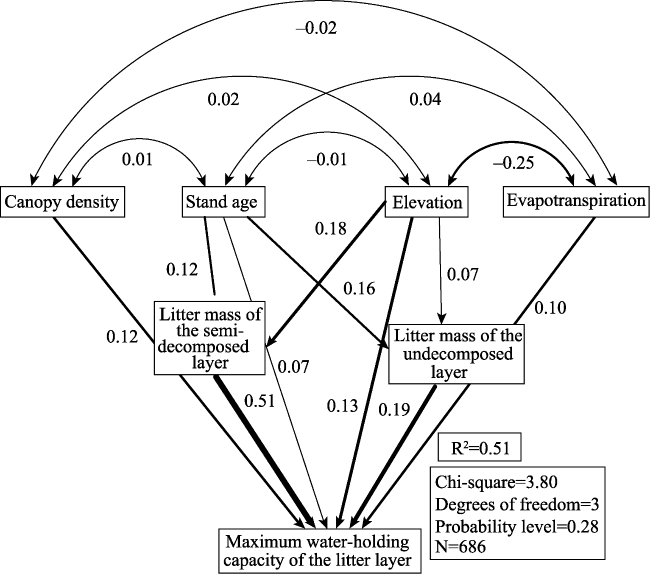
Figure 8 Fitting results of path analysis for the litter layer
With regard to indirect effects, stand age and elevation had an indirect effect on water-holding capacity of the litter layer by affecting litter mass. The influence coefficients of stand age on undecomposed and semi-decomposed litter were 0.16 and 0.12, respectively; this showed that litter mass increased with increasing stand age, and the effect of stand age on undecomposed litter was increasingly obvious. Elevation indirectly affected litter mass and the decomposition rate by changing conditions in the forest environment, such as light, temperature, and precipitation, and the predominant factors varied by region and scale. Previous studies have shown that the litter decomposition rate is significantly affected by elevation, temperature, and precipitation on a national scale: temperature decreases with increasing elevation, slowing down the litter decomposition rate (Liu et al., 2018). However, our results showed that the increased elevation accelerated the decomposition rate of litter, and the influence coefficient of the semi-decomposed layer (0.18) was larger than that of the undecomposed layer (0.07). The BTH region has the temperate continental monsoon climate, with a high temperature and rainfall in the summer. In the literature, the field sampling was mainly in July and August, and the spatial difference in temperature and rainfall on the litter decomposition rate was small. However, light conditions in high-elevation forests were better than that in low-elevation, accelerating the litter decomposition rate to a certain extent. This result was consistent with the conclusions of Wang et al. (2016b) and Lu et al. (2014).
With regard to total effects, the most important influencing factor was semi-decomposed litter, and the influence coefficient was 0.51, followed by elevation (0.24), stand age (0.16), and canopy density (0.12). The influencing factors in the water-retention capacity of the litter layer were mainly vegetation characteristics (stand age, canopy density, and litter mass) and topographic conditions (elevation). Vegetation characteristics affected litter quality and quantity—quality was reflected by decomposition degree: semi-decomposed litter could absorb water better. Quantity was reflected by the litter mass amount. Topography mainly affected the water-holding capacity of litter by affecting the litter decomposition rate (Lu et al., 2014). The effect of meteorological conditions was not significant.
3.4.3 Soil layer
With regard to direct effects, non-capillary porosity and soil depth were the predominant factors affecting the water-holding capacity of the soil layer, and the influence coefficients were 0.60 and 0.47, respectively (Figure 9). As the main store of water, the non-capillary porosity reflects the level of air permeability and infiltration capacity of the soil and is directly related to soil water-retention capacity. The water storage space increases with increasing soil depth, and water-retention capacity increases. The influence coefficients of sunshine duration and slope were 0.13 and 0.10, respectively, because light conditions affect the litter decomposition (Niu et al., 2015). Litter decomposes more easily in forests with good transparency, and when it accumulates on the Earth’s surface, it improves soil structure, loosening the soil and facilitating water retention, keeping the soil moist (Lu et al., 2013). Capillary porosity and stand age had negative effects on soil water-holding capacity, and the influence coefficients were -0.11 and -0.13, respectively. The increase in capillary porosity led to a poor infiltration capacity of precipitation, and the available water-holding capacity decreased accordingly.
Figure 9 Fitting results of path analysis for the soil layer
With regard to indirect effects, varied stand age and soil depth resulted in varying soil porosity, which affected water-holding capacity. Moreover, the surface litter composition and the degree of decomposition and root development in forests influenced the soil porosity. Overall, indirect effects were reflected by a change in the physical characteristics of the soil.
With regard to total effects, non-capillary porosity and soil depth still had the greatest impact on the water-retention capacity, and the influencing coefficients were 0.60 and 0.38, respectively. With regard to vegetation characteristics, the influence on water-holding capacity was mainly reflected by an improvement in soil physical properties. Vegetation growth increased the number of non-capillary pores in the soil, meaning root intercalation in the soil and litter decomposition led to an increase in water-holding capacity.

3.5 Discussion

Based on a meta-analysis, an evaluation of the forest water-retention capacity in the BTH region can improve the scale limitation of experimental observation and the mechanism of model simulation; as well as can obtain the evaluation of regional-scale water-retention capacity based on experimental observation. The results showed that the water-retention capacity of forest in the BTH region was between 49.82 mm and 67.64 mm, close to that of the Beijing mountainous area (39.12-82.06 mm) and Taihang mountainous area (47.61-68.19 mm) (Xu et al., 2019; Ma et al., 2017b). The forest layer with the largest water-retention capacity was the soil layer, followed by the canopy layer, and the litter layer, which was consistent with previous studies (He et al., 2011).
The maximum daily precipitation and LAI, litter mass (especially semi-decomposed litter), and soil characteristics significantly affected the water-retention capacity of the canopy, litter, and soil layer of the forest in the BTH region, respectively, which was consistent with previous research (Zhang et al., 2011; Gong et al., 2017a). In addition, several influencing factors had different effects on forest water-retention capacity, such as elevation, slope, and other topographic conditions linked to regional environment and site habitat.

4 Conclusions

Based on the literature concerning the water retention of forest in the BTH region, 1366 records were extracted and a meta-analysis database constructed to analyze water-retention capacity using the comprehensive water-storage capacity method. We compared the distributions of forest water-retention capacity for different environmental gradients and employed path analysis to explore the influencing factors of forest water-retention capacity. The following conclusions were drawn:
(1) Due to the multi-layer canopy structure, mixed forest had the maximum water-retention capacity of forest in the BTH region (67.64 mm), followed by broad-leaved forest (56.44 mm), shrub forest (54.84 mm), and coniferous forest (49.82 mm). The ranking of layers in terms of water-retention capacity was the soil layer, canopy layer, and litter layer from high to low. In terms of differences in the water-retention capacity among forest types, the soil layer was the most obvious and the canopy layer was the smallest.
(2) The influencing factors in water-retention capacity varied with forest layer. The canopy interception capacity was significantly positively correlated with maximum daily precipitation, evapotranspiration, LAI, stand age, DBH, and slope, and negatively correlated with sunshine duration, latitude, and elevation. The maximum water-holding capacity of litter was highly correlated with litter mass, and the correlation between the maximum water-holding capacity and semi-decomposed litter was greater than that of undecomposed litter. The available water-holding capacity of soil was mainly related to the soil depth and degree of non-capillary porosity.
(3) The heterogeneity of water-retention capacity was obvious in environmental gradients. The canopy interception capacity decreased with increasing elevation, increased with increasing DBH, LAI, maximum daily precipitation, and evapotranspiration, and first increased then decreased with increasing stand age. The maximum water-holding capacity of litter increased with increasing vegetation index, elevation, and litter mass, and decreased with increasing stand age. Soil available water-holding capacity increased with increasing non-capillary porosity and precipitation, and decreased with increasing capillary porosity and stand age.
(4) The R2 values of path analysis of the canopy layer, litter layer, and soil layer were 0.49, 0.51, and 0.61, respectively. The predominant factors of the canopy layer were LAI and maximum daily precipitation, and the total effects were 0.34 and 0.30, respectively. Compared with the canopy layer, the influencing coefficients of the predominant factors affecting the water-retention capacity of the litter layer and soil layer were more obvious. The litter mass was the predominant factor affecting the water-retention capacity of the litter layer, and its direct influence coefficient was 0.51. The key factors affecting soil available water-holding capacity were non-capillary porosity and soil depth, with influence coefficients of 0.60 and 0.38, respectively.
[1]
Bao C, Zou J J, 2018. Evaluation of water resource security patterns in the Beijing-Tianjin-Hebei Region urban agglomeration based on human-water relationships. Acta Ecologica Sinica, 38(12):4180-4191. (in Chinese)

[2]
Bao Y B, Li T, Liu H et al., 2016. Spatial and temporal changes of water conservation of Loess Plateau in northern Shanxi Province by InVEST model. Geographical Research, 35(4):664-676. (in Chinese)

[3]
Chen H M, Ma J Y, Wang X J et al., 2018a. Effects of biochar and sludge on carbon storage of urban green roofs. Forests, 9(7):413.

[4]
Chen H M, Ma J Y, Wei J X et al., 2018b. Biochar increases plant growth and alters microbial communities via regulating the moisture and temperature of green roof substrates. Science of the Total Environment, 635:333-342.

DOI

[5]
Chen L, Hao J M, Chen A Q et al., 2017. Study on water conservation function of cultivated land based on dualistic water cycle in Huang-Huai-Hai Plain. Acta Ecologica Sinica, 37(17):5871-5881. (in Chinese)

[6]
Chen S S, Liu K, Bao Y B et al., 2016a. Spatial pattern and influencing factors of water conservation service function in Shangluo City. Scientia Geographica Sinica, 36(10):1546-1554. (in Chinese)

[7]
Chen T, Xi M, Kong F L et al., 2016b. A review on litter decomposition and influence factors. Chinese Journal of Ecology, 35(7):1927-1935. (in Chinese)

[8]
Cui J X, Li X F, Zheng H F et al., 2019. Spatial analysis of water conservation function in northeast China under different climatic conditions. Acta Ecologica Sinica, 39(9):3026-3038. (in Chinese)

[9]
Eisenhauer N, Bowker M A, Grace J B et al., 2015. From patterns to causal understanding: Structural equation modeling (SEM) in soil ecology. Pedobiologia, 58(2/3):65-72.

DOI

[10]
Fanin N, Bertrand I, 2016. Aboveground litter quality is a better predictor than belowground microbial communities when estimating carbon mineralization along a land-use gradient. Soil Biology and Biochemistry, 94:48-60.

DOI

[11]
Gong S H, Xiao Y, Xiao Y et al., 2017a. Driving forces and their effects on water conservation services in forest ecosystems in China. Chinese Geographical Science, 27(2):216-228.

DOI

[12]
Gong S H, Xiao Y, Zheng H et al., 2017b. Spatial patterns of ecosystem water conservation in China and its impact factors analysis. Acta Ecologica Sinica, 37(7):2455-2462. (in Chinese)

[13]
Han C, Chen N, Sun S et al., 2019. A review on hydrological mediating functions and mechanisms in forest ecosystems. Chinese Journal of Ecology, 38(7):2191-2199. (in Chinese)

[14]
He S X, Li X Y, Mo F et al., 2011. The water conservation study of typical forest ecosystem in the forest transect of eastern China. Acta Ecologica Sinica, 31(12):3285-3295. (in Chinese)

[15]
Hou X C, Sun W, Li J G et al., 2018a. The progress of research and forecast on the quantification of the forest water conservation capacity. Journal of Arid Land Resources and Environment, 32(1):121-127. (in Chinese)

[16]
Hou W J, Gao J B, Dai E F et al., 2018b. The runoff generation simulation and its spatial variation analysis in Sanchahe basin as the south source of Wujiang. Acta Geologica Sinica, 73(7):1268-1282. (in Chinese)

[17]
Hu S P, Yu X X, Yue Y J, 2008. Hydrological effects of forest litter and soil layer in Baihua Mountain. Journal of Soil and Water Conservation, 22(1):146-150. (in Chinese)

[18]
Ji J P, Zou Z J, Tian Y S, 2019. Energy and economic impacts of China’s 2016 economic investment plan for transport infrastructure construction: An input-output path analysis. Journal of Cleaner Production, 238:117761.

DOI

[19]
Jia Y L, Xu Q, Xu Z Q et al., 2012. Water conservation capacity of typical plant communities in north region of Yanshan Mountain. Bulletin of Soil and Water Conservation, 32(6):16-21. (in Chinese)

[20]
Li C, Zhang X, Wu Y F et al., 2019a. Landscape pattern change of the ecological barrier zone in Beijing-Tianjin-Hebei region and its impact on water conservation. China Environmental Science, 39(6):2588-2595. (in Chinese)

[21]
Li X T, Liu J, Jiang S S et al., 2019b. Analysis of the urban tree canopy and community structure of hospitals in urban areas of Beijing. Acta Ecologica Sinica, 39(22):1-12. (in Chinese)

DOI

[22]
Ling H, Chen G S, Chen Z Q, 2009. Controlling factors of litter fall in China’s forests. Journal of Subtropical Resources and Environment, 4(4):66-71. (in Chinese)

[23]
Liu L L, Cao W, Shao Q Q, 2016. Water conservation function of forest ecosystem in the Southern and Northern Pan River Watershed. Scientia Geographica Sinica, 36(4):603-611. (in Chinese)

DOI

[24]
Liu X, Zhou T, Wu H et al., 2018. Spatial pattern and main control factors in forest litter decomposition in China: A optimal linear mixed-effect model. Journal of Beijing Normal University (Natural Science), 54(4):553-560. (in Chinese)

[25]
Lu N N, Wang X J, Zhang P et al., 2015. Path analysis between diameter at breast, height and crown of Cunninghamia lanceolata in different age. Journal of Northeast Forestry University, 43(4):12-16. (in Chinese)

[26]
Lu S W, Chen B, Pan Q H et al., 2013. Soil hydrological effects and forest litter of Platycladus orientalis plantations in the different densities in mountain of Beijing. Journal of Soil and Water Conservation, 27(1):224-229. (in Chinese)

[27]
Lu Z Q, Huang Q X, Yang X B, 2014. Research on hydrological effects of forest litter and soil of Pinus tabulaeformis plantation in the different elevations of Wuling Mountain in Hebei. Journal of Soil and Water Conservation, 28(1):112-116. (in Chinese)

[28]
Luo L, Zhao X Y, Wang Y R et al., 2017. Farmer perception of climate change based on a structural equation model: A case study in the Gannan Plateau. Acta Ecologica Sinica, 37(10):3274-3285. (in Chinese)

[29]
Lv Y H, Hu J, Sun F X et al., 2015. Water retention and hydrological regulation: Harmony but not the same in terrestrial hydrological ecosystem services. Acta Ecologica Sinica, 35(15):5191-5196. (in Chinese)

[30]
Ma C, Wang X Y, Zhang Y X et al., 2017a. Emergy analysis of ecosystem services supply and flow in Beijing ecological conservation area. Acta Geographica Sinica, 72(6):974-985. (in Chinese)

DOI

[31]
Ma W L, Shi P L, Zong N et al., 2017b. Water conservation capacity of forest ecosystems in Taihang Mountain. Chinese Journal of Eco-Agriculture, 25(4):478-489. (in Chinese)

[32]
Niu Y, Liu H L, Zhang Z Q, 2015. Effects of typical tree species and abiotic factors on the hydrological characters of forest litter in Beijing. Transactions of the Chinese Society of Agricultural Engineering, 31(8):183-189. (in Chinese)

[33]
Pan T, Wu S H, Dai E F et al., 2013. Spatiotemporal variation of water source supply service in Three Rivers Source Area of China based on InVEST model. Chinese Journal of Applied Ecology, 24(1):183-189. (in Chinese)

PMID

[34]
Park A, Cameron J L, 2008. The influence of canopy traits on throughfall and stemflow in five tropical trees growing in a Panamanian plantation. Forest Ecology and Management, 255(5/6):1915-1925.

[35]
Sahanavin N, Prueksasit T, Tantrakarnapa K, 2018. Relationship between PM10 and PM2.5 levels in high-traffic area determined using path analysis and linear regression. Journal of Environmental Sciences, 69(7):105-114.

DOI

[36]
Song D D, 2015. Study on the interception of rainfall by canopy [D]. Shandong: Shandong Agricultural University. (in Chinese)

[37]
Wang H J, Wang H X, Xie Y G, 2016b. Hydrology functions and water-holding capacity of forest litter in Taihangshan scenic area. Research of Soil and Water Conservation, 23(6): 135-139+144. (in Chinese)

[38]
Wang J D, Li Y H, Li Z T et al., 2010. Optimization of vegetation covers in Qilian Mountains based on hydrological responses by SWAT model: A case study of Zamu River Basin in upper Shiyang River Basin. Acta Ecologica Sinica, 30(21):5875-5885. (in Chinese)

[39]
Wang S L, Zhou J P, 2014. Coupling relationship between stand growth and impacting factors based on structural equation model. Journal of Beijing Forestry University, 36(5):7-12. (in Chinese)

[40]
Wang X X, Shen H T, Li X Y et al., 2013. Concepts, processes and quantification methods of the forest water conservation at the multiple scales. Acta Ecologica Sinica, 33(4):1019-1030. (in Chinese)

DOI

[41]
Wang Y, Zhang C S, Liu C L et al., 2019. Research on the pattern and change of forest water conservation in Three-North Shelterbelt Forest Program Region, China. Acta Ecologica Sinica, 39(16):5847-5856. (in Chinese)

[42]
Wu Q, Yan W D, Zhao L S et al., 2016. Canopy interception characteristics of Chinese fir plantations in central south China. Acta Ecologica Sinica, 36(13):4131-4140. (in Chinese)

[43]
Wu X, Shi W J, Guo B et al., 2020. Large spatial variations in the distributions of and factors affecting forest water retention capacity in China. Ecological Indicators, 113:106152.

DOI

[44]
Wang Y R, Wang Y H, Yu P T et al., 2016a. Simulated responses of evapotranspiration and runoff to changes in the leaf area index of a Larix principis-rupprechtii plantation. Acta Ecologica Sinica, 36(21):6928-6938. (in Chinese)

[45]
Xu J, Xiao Y, Xie G D, 2019. Analysis on the spatiotemporal patterns of water conservation services in Beijing. Journal of Resources and Ecology, 10(4):362-372.

DOI

[46]
Yin Y H, Wu S H, Zhao D S et al., 2016. Ecosystem water conservation changes in response to climate change in the Source Region of the Yellow River from 1981 to 2010. Geographical Research, 35(1):49-57. (in Chinese)

[47]
Yu H Y, Liu S H, Zhao N et al.Zhao N , 2011. Variation characteristics of the sunlight duration and its relationships with temperature, wind speed, and precipitation over recent 59 years in China. Climate and Environment Research, 16(3):389-398. (in Chinese)

[48]
Yu X X, Zhou B, Lv X Z et al., 2012. Evaluation of forest water conservation function in mountainous forest areas of Beijing based on InVEST model. Scientia Silvae Sinicae, 48(10):1-5. (in Chinese)

DOI

[49]
Zeng L, Li J, Li T et al., 2018. Optimizing spatial patterns of water conservation ecosystem service based on Bayesian belief networks. Acta Geographica Sinica, 73(9):1809-1822. (in Chinese)

DOI

[50]
Zhai Y P, Chen Y M, Gao J X et al., 2019. Division of donor and receptor areas of ecological services of water conservation in Beijing-Tianjin-Hebei region. Research of Environmental Sciences, 32(7):1099-1107. (in Chinese)

[51]
Zhang B, Li W H, Xie G D et al., 2008. Characteristics of water conservation of forest ecosystem in Beijing. Acta Ecologica Sinica, 28(11):5619-5624. (in Chinese)

[52]
Zhang B, Xie G D, Yan Y P et al., 2011. Regional differences of water conservation in Beijing’s forest ecosystem. Journal of Forestry Research, 22(2):295-300.

DOI

[53]
Zhao Y S, Han C H, Zhang H G et al., 2012. Soil hydrologic functions of main forest types in Ashi River’s Upstream Watershed. Journal of Soil and Water Conservation, 26(2):203-208. (in Chinese)

[54]
Zhou F, Xu Y P, Chen Y et al., 2013. Hydrological response to urbanization at different spatiotemporal scales simulated by coupling of CLUE-S and the SWAT model in the Yangtze River Delta Region. Journal of Hydrology, 485:113-125.

DOI

Outlines

/