
Journal of Geographical Sciences >
Spatiotemporal changes of land desertification sensitivity in northwest China from 2000 to 2017
|
Wei Wei, PhD and Associate Professor, specialized in environmental RS and GIS application. E-mail:wei-weigis2006@126.com |
Received date: 2020-08-12
Accepted date: 2020-10-20
Online published: 2021-03-25
Supported by
National Natural Science Foundation of China(41861040)
National Natural Science Foundation of China(41761047)
National Natural Science Foundation of China(41961027)
Copyright
Sensitivity assessment is useful for monitoring land desertification. Research into how to prevent and control desertification is also important. In the arid region of northwest China, desertification is becoming worse and is a serious problem that affects local sustainable development. Based on remote-sensing and geographic information system technology, this study establishes a “soil-terrain-hydrology-climate-vegetation” desertification sensitivity comprehensive evaluation system to reflect the spatiotemporal changes of land desertification, and proposes a spatial distance model to calculate a desertification sensitivity index. The spatiotemporal change characteristics of land desertification sensitivity in northwest China are quantitatively assessed from 2000 to 2017. Moreover, the main driving factors are analyzed using the geographical detector method. The results show the following. (1) Terrain, soil, climate, vegetation and hydrology affect and restrict each other, and constitute the background conditions of the distributions and changes of sensitivity to desertification in northwest China. (2) Desertification sensitivity generally displays a low distribution characteristic on the periphery of the area and a high one in the interior. The low-sensitivity regions are mainly in the five major mountain ranges (Altai Mountains, Tianshan Mountains, Kunlun Mountains, Altun Mountains and Qilian Mountains), while the high-sensitivity regions are mainly in regions such as the Junggar Basin, the Tarim Basin and the Inner Mongolia Plateau, as well as the Taklimakan Desert, Badain Jaran Desert and Tengger Desert. The spatial distribution of desertification sensitivity is obviously regional, and the high- and low-sensitivity regions have clear boundaries and a concentrated distribution. (3) With regard to spatiotemporal evolution, changes in desertification sensitivity since 2000 have been predominantly stable, and the overall sensitivity has displayed a slowly decreasing trend, indicating that potential desertification regions are decreasing annually and that some achievements have been made in the control of regional desertification. (4) Soil and climate play a direct role in the driving factors of desertification in northwest China, and these have been found to be the most important influential factors. Vegetation is the most active and basic factor in changing the sensitivity. In addition, topography and hydrology play a role in restricting desertification changes. Socio-economic factors are the most rapid factors affecting regional desertification sensitivity, and their impacts tend to be gradually increasing. In general, desertification has been effectively controlled in northwest China, and positive results have been achieved in such control. However, against the backdrop of intensified global climate change, increasingly prominent human activities and new normals of socio-economic development, the monitoring, assessment and control of desertification in China still have a long way to go.
WEI Wei , GUO Zecheng , SHI Peiji , ZHOU Liang , WANG Xufeng , LI Zhenya , PANG Sufei , XIE Binbin . Spatiotemporal changes of land desertification sensitivity in northwest China from 2000 to 2017[J]. Journal of Geographical Sciences, 2021 , 31(1) : 46 -68 . DOI: 10.1007/s11442-021-1832-1
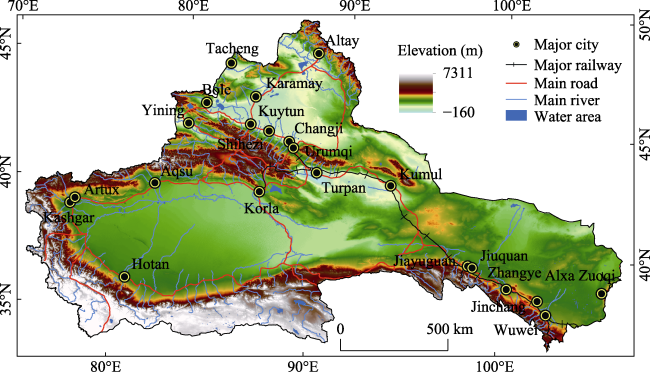
Figure 1 Map and elevation of northwest China |
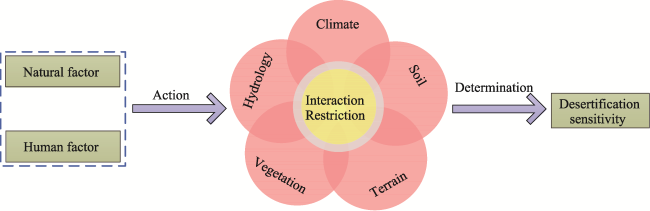
Figure 2 Analysis of the principle of desertification sensitivity |
Table 1 Evaluation index system of desertification sensitivity |
| Primary indicator | Secondary indicator layer | Standardized treatment |
|---|---|---|
| Terrain background index (TBI) | Elevation | - |
| Slope | - | |
| Aspect | + | |
| Soil background index (SBI) | Soil organic matter content | - |
| Soil erosion intensity | + | |
| Soil depth | + | |
| Gravel content of soil | + | |
| Hydrological background index (HBI) | Distance from glacier and snow | + |
| Distance from major rivers | + | |
| Distance from lakes and reservoirs | + | |
| Climatic background index (CBI) | Degree of dryness | - |
| LST | + | |
| Average wind speed | + | |
| Vegetation background index (VBI) | NDVI | - |
| Drought resistance of vegetation | + |
Note: + represents positive normalization, - represents negative normalization. |
Table 2 Construction method of each background index |
| Single background index | Calculating formula | Explanation |
|---|---|---|
| Topographic background index | $TBI=\sqrt{(E-E_{low})^{2}+(S-S_{low})^{2}+(A-A_{low})^{2}}$ | E, S and A are the altitude, slope and aspect factors, respectively; Elow, Slow and Alow are the lowest values of sensitivity represented by the three-dimensional space composed of altitude, slope and aspect, respectively. The reference point (Elow, Slow, Alow) is (0, 0, 0). The higher the TBI value, the higher the sensitivity of land desertification at the terrain factor level. Elevation (in meters) is directly obtained based on the DEM, while slope and aspect are extracted with the ArcGIS10.2 Slope and Aspect tool. Aspect was ranked from low sensitivity to high sensitivity as follows: flat land < west, northwest and north < northeast and east < southeast, south and southwest, with values ranging from 1 to 4. |
| Soil background index | $SBI=\sqrt{(SOMC- SOMC_{low})^{2}+(SEI-SEI_{low})^{2}+(SSC-SSC_{low})^{2}+(SD-SD_{low})^{2}}$ | SOMC, SEI, SSC and SD are soil organic matter content, soil erosion intensity, soil sand content and soil depth, respectively. The reference point (SOMClow, SEIlow, SSClow, SDlow) is (0, 0, 0, 0). The soil organic matter content was converted into a percentage by dividing the soil organic carbon in the world soil database by 0.58. Soil erosion intensity was rated as 1-6 according to the following erosion types: micro erosion, light erosion, moderate erosion, intense erosion, extreme intense erosion and severe erosion. The soil sand content was directly provided by the Data Center of Resources and Environmental Sciences. Soil depth was quantified according to soil type. |
| Hydrological background index | $HBI=\sqrt{(DS-DS_{low})^{2}+(DR-DR_{low})^{2}+(DLR-DLR_{low})^{2}}$ | DS, DR and DLR are the distance from glaciers and snow, distance from major rivers, and distance from lakes and reservoirs, respectively. The reference point (DSlow, DRlow, DLRlow) is (0,0,0). The higher the HBI value, the lower the regional water resource quantity, and the higher the sensitivity of land desertification. The distances from glaciers and snow, major rivers, and lakes and reservoirs were calculated using the Euclidean distance tool in ArcGIS10.2. |
| Climatic background index | $AI=\frac{P}{t^{0}+10}CBI=\sqrt{(AWV-AWV_{low})^{2}+(AI-AI_{low})^{2}+(LST-LST_{low})^{2}}$ | AI, P and t0 are dry degree, annual average precipitation and annual average temperature, respectively. AWV and LST are mean wind speed and land surface temperature, respectively. The reference point (AWVlow, AIlow, LSTlow) is (0, 0, 0). The higher the CBI value, the higher the sensitivity of land desertification. The surface temperature came from the MODIS data product, and the dryness and average wind speed were provided by 112 meteorological stations in the research area and surrounding areas. The spatial distribution map was obtained by Kriging interpolation. Average wind speed can be directly obtained from the meteorological dataset. |
| Vegetation background index | $VBI=\sqrt{(NDVI-NDVI_{low})^{2}+(DR-DR_{low})^{2}}$ | NDVI and DR are normalized vegetation index and drought resistance of vegetation. The reference point (NDVIlow, DRlow) is (0, 0). The higher the VBI value, the lower the vegetation cover and the higher the desertification sensitivity. The NDVI was derived from MODIS data products, and vegetation drought resistance ability was based on quantitative extraction of vegetation types, according to the desertification sensitivity from low to high: needle broad-leaved forest, coniferous forest, broad-leaved mixed forest and water < marshes, planting vegetation, alpine vegetation and thickets < grassland, meadow and pasture and grass < desert, rock and vegetation coverage, with values ranging from 1 to 4. |
Table 3 Classification standards for desertification sensitivity in northwest China |
| Category | Sensitivity | Range |
|---|---|---|
| 1 | Nonsensitive | <1.561 |
| 2 | Slightly sensitive | 1.561-1.842 |
| 3 | Moderately sensitive | 1.842-2.131 |
| 4 | Highly sensitive | 2.131-2.386 |
| 5 | Extremely sensitive | ≥2.386 |
Table 4 Classification of each sensitivity conversion type |
| Conversion type | Code | Value | Description |
|---|---|---|---|
| Stable type | 1111 | 1 | Type of desertification sensitivity did not change from 2000 to 2017 |
| Continuously increasing type | 0001, 0111, 0011 | 2 | This sensitivity type was increased by other type conversions |
| Continuously decreasing type | 1000, 1100, 1110 | 3 | This sensitivity type was decreased because of conversion |
| Fluctuating type | 0010, 0100, 0110, 1001, 1011, 1101 | 4 | The desertification sensitivity fluctuated irregularly from 2000 to 2017 |
| Increasing fluctuating type | 0101 | 5 | This displayed an increasing trend from 2000 to 2017 |
| Decreasing fluctuating type | 1010 | 6 | This displayed a decreasing trend from 2000 to 2017 |
| Other type | 0000 | 0 | There was no regular change |
Table 5 Classification table of conversion types of desertification sensitivity assignment codes and their meaning |
| Assignment | Code | Meanings |
|---|---|---|
| 1 | 00001 | Sensitivity type has always been extremely sensitive |
| 2 | 00010 | Sensitivity type has always been highly sensitive |
| 3 | 00023, 00056 | Sensitivity type changed from extremely sensitive to highly sensitive |
| 4 | 00044 | Sensitivity type fluctuated between extremely sensitive and highly sensitive |
| 5 | 00032, 00065 | Sensitivity type reversed from highly sensitive to extremely sensitive |
| 6 | 00100 | Sensitivity type has always been moderately sensitive |
| 7 | 00230, 00560 | Sensitivity type changed from highly sensitive to moderately sensitive |
| 8 | 00440 | Sensitivity type fluctuated between highly sensitive and moderately sensitive |
| 9 | 00320, 00650 | Sensitivity type reversed from moderately sensitive to highly sensitive |
| 10 | 01000 | Sensitivity type has always been slightly sensitive |
| 11 | 02300, 05600 | Sensitivity type changed from moderately sensitive to slightly sensitive |
| 12 | 04400 | Sensitivity type fluctuated between moderately sensitive and slightly sensitive |
| 13 | 03200, 06500 | Sensitivity type reversed from slightly sensitive to moderately sensitive |
| 14 | 10000 | Sensitivity has always been nonsensitive |
| 15 | 23000, 56000 | Sensitivity type changed from slightly sensitive to nonsensitive |
| 16 | 44000 | Sensitivity type fluctuated between slightly sensitive and nonsensitive |
| 17 | 32000, 65000 | Sensitivity type reversed from nonsensitive to slightly sensitive |
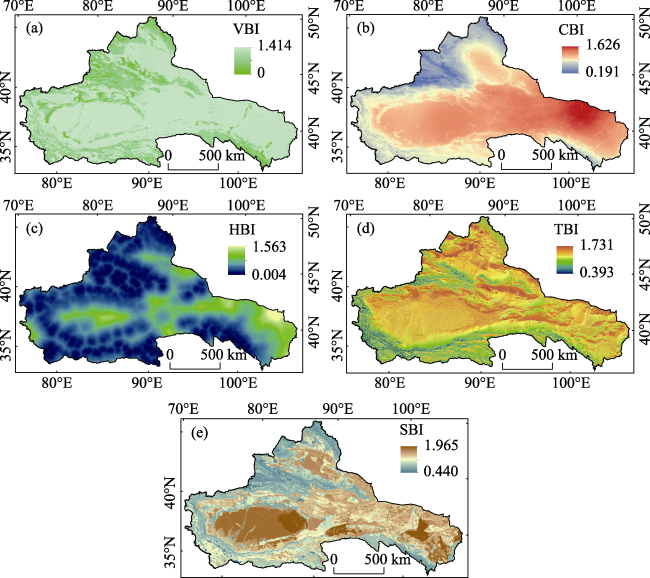
Figure 3 Spatial distribution maps of background elements in 2017 |
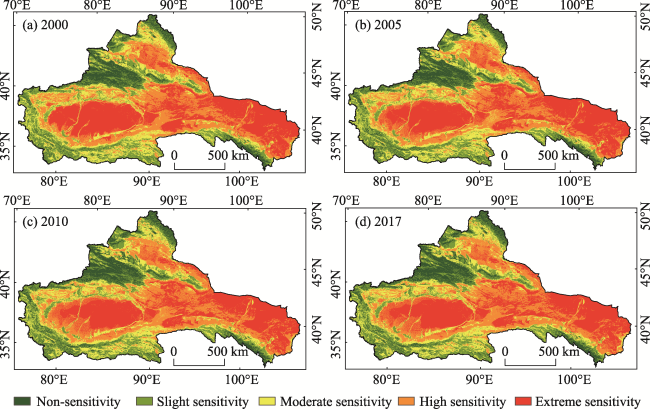
Figure 4 Spatial distribution of desertification sensitivity in northwest China |
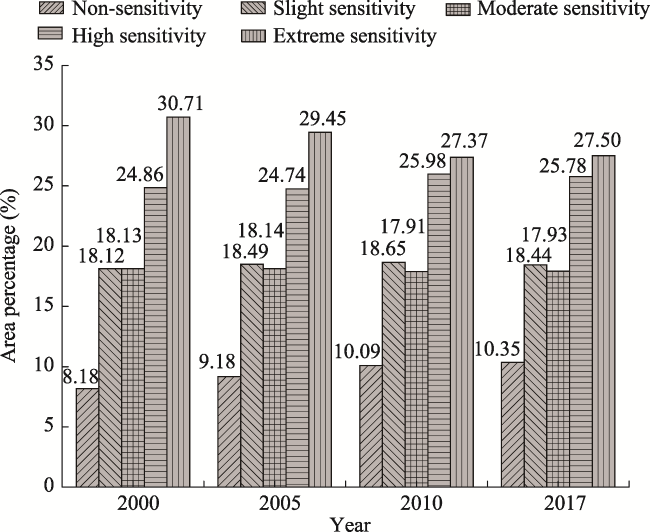
Figure 5 Area statistics of desertification sensitivity in northwest China |
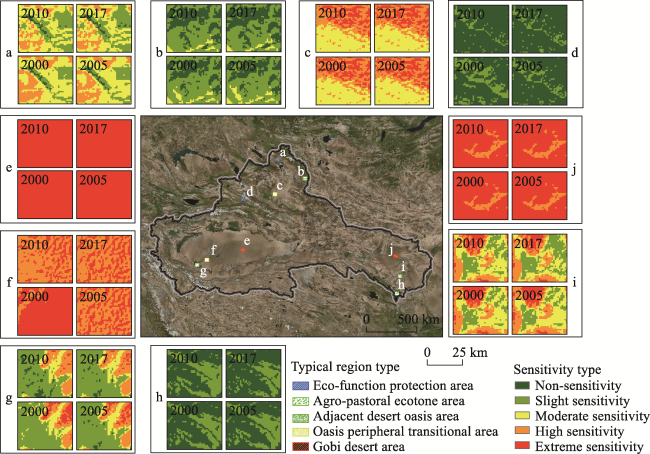
Figure 6 Spatial distributions of typical regions in northwest China. Note: This study selected typical regions from the northwest arid region for comparative analysis. Among them, a and d are eco-function protection areas located in Tianshan Mountains and Altai Mountains. b and h are the farming-pastoral ecotone located in Qinghe County and Tianzhu Tibetan Autonomous County. g and i are adjacent desert oasis areas located in Hotan Oasis and Minqin Oasis. e and j are located in the Gobi Desert area of Taklimakan Desert and Badain Jilin Desert. c and f are transitional areas around oases located in Urumqi and Hotan regions. |
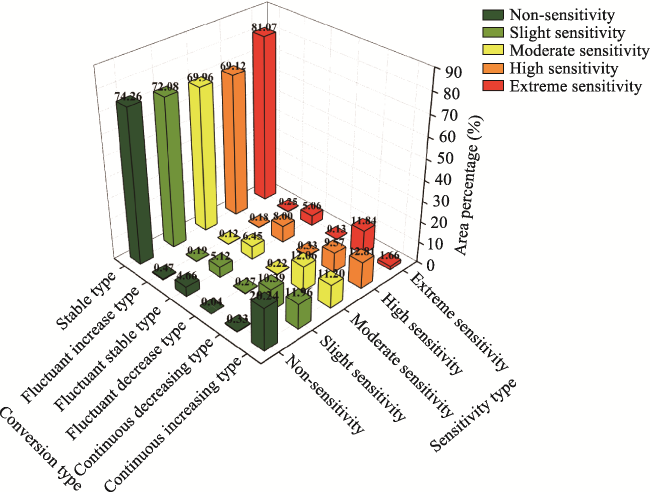
Figure 7 Area statistics of different conversion types of desertification sensitivity in northwest China |
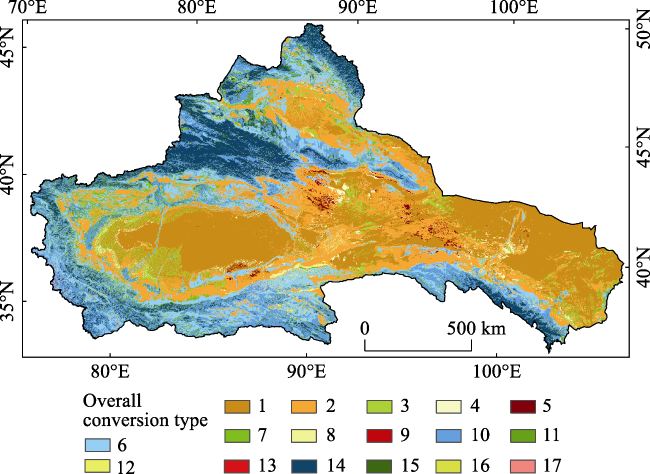
Figure 8 Spatial distribution of overall conversion types for desertification sensitivity in northwest China |
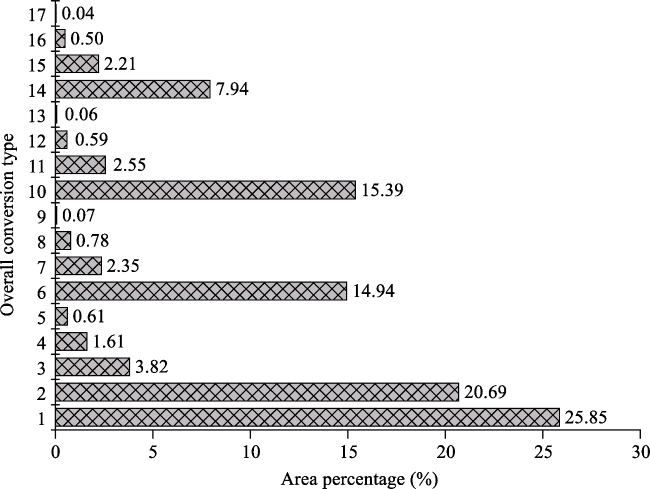
Figure 9 Area statistics of overall conversion types for desertification sensitivity in northwest China |
Table 6 Geographical detector method results of natural factors |
| Primary indicator | 2000 | 2005 | 2010 | 2017 | ||||
|---|---|---|---|---|---|---|---|---|
| q value | p value | q value | p value | q value | p value | q value | p value | |
| SBI | 0.714 | 0.000*** | 0.710 | 0.000*** | 0.712 | 0.000*** | 0.715 | 0.000*** |
| TBI | 0.311 | 0.000*** | 0.322 | 0.000*** | 0.308 | 0.000*** | 0.301 | 0.000*** |
| CBI | 0.704 | 0.000*** | 0.710 | 0.000*** | 0.710 | 0.000*** | 0.711 | 0.000*** |
| HBI | 0.435 | 0.000*** | 0.431 | 0.000*** | 0.433 | 0.000*** | 0.417 | 0.000*** |
| VBI | 0.612 | 0.000*** | 0.610 | 0.000*** | 0.608 | 0.000*** | 0.609 | 0.000*** |
Note: A significant p value, when p > 0.10, means that the significance test has not been passed. *** denotes p < 0.01, which means the 1% significance test has been passed. |
Table 7 Correlation analyses of socio-economic factors and DSI |
| DSI | 2000 | 2005 | 2010 | 2017 | ||||
|---|---|---|---|---|---|---|---|---|
| r | p | r | p | r | p | r | p | |
| Population density | -0.105 | 0.270 | -0.107 | 0.261 | -0.111 | 0.243 | -0.089 | 0.350 |
| Per capita GDP | 0.135 | 0.155 | 0.217 | 0.021** | 0.323 | 0.001** | 0.334 | 0.000*** |
Note: A significant p value, when p > 0.10, means that the significance test has not been passed. ** denotes 0.01 < p < 0.05, which means the 5% significance test has been passed; *** denotes p < 0.01, which means the 1% significance test has been passed. |
| [1] |
|
| [2] |
|
| [3] |
|
| [4] |
|
| [5] |
|
| [6] |
|
| [7] |
|
| [8] |
|
| [9] |
|
| [10] |
|
| [11] |
|
| [12] |
|
| [13] |
|
| [14] |
|
| [15] |
|
| [16] |
|
| [17] |
|
| [18] |
|
| [19] |
|
| [20] |
|
| [21] |
|
| [22] |
|
| [23] |
|
| [24] |
|
| [25] |
|
| [26] |
|
| [27] |
|
| [28] |
|
| [29] |
|
| [30] |
|
| [31] |
|
| [32] |
|
| [33] |
|
| [34] |
|
| [35] |
|
| [36] |
|
| [37] |
|
| [38] |
|
| [39] |
|
| [40] |
|
/
| 〈 |
|
〉 |