
Journal of Geographical Sciences >
Spatial pattern of location advantages of ports along the Maritime Silk Road
|
Mou Naixia (1973–), Professor, specialized in data mining, big data analysis, tourism and transport geography. E-mail: mounaixia@163.com |
Received date: 2020-03-19
Accepted date: 2020-09-11
Online published: 2021-03-25
Supported by
Major Program of National Social Science Fund of China(20&ZD070)
Copyright
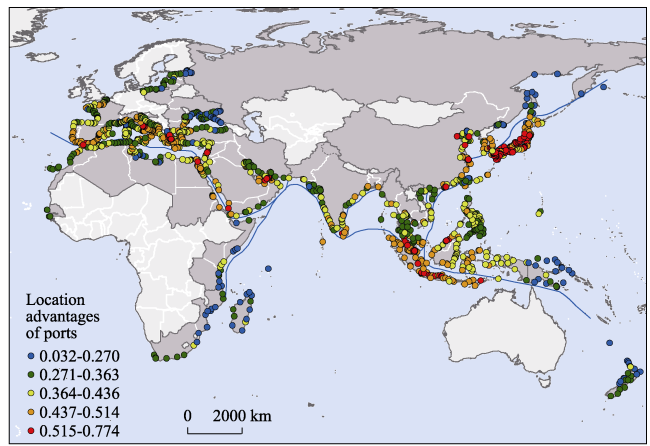
Location advantages of ports refer to the current developments of ports based on their conditions, such as geographic location, traffic accessibility and hinterland economy, etc., and the spatial pattern of ports’ location advantages reflects the spatial distributions, the regularities and the correlations among their conditions for development. A good understanding of the spatial patterns of ports’ location advantages can help to better identify the relative advantages of ports, position ports’ functions and make strategic plans for development. This paper selected 1259 ports from 63 countries along the Maritime Silk Road as research objects and builds an accessing model to analyze their location advantages on the bases of six factors: the influence of strategic shipping pivot, the competitiveness of port location potential, port network status, the influence of city, the influence of traffic trunk, and road network density in hinterland. The study has the following three findings. Firstly, the location advantages of ports show a “high-low-high” distribution pattern from the west to the east, displaying an obvious “core-periphery” regionalized distribution. Secondly, most ports have high location advantages, mainly located in Strait of Malacca, the United Arab Emirates, northern Mediterranean coastal region and China-Japan region, the top 10 ports are mainly located in Singapore, China, Malaysia and Japan, indicating that the shipping industry in Asia-Pacific region has stepped to the far front of the global competition; slow economic growths, wars, far away from the Belt and Road countries or bad climate have low location advantages, mainly located in African coastal areas, Oceania, Northeast Europe and Russia. Thirdly, compared with the landward location advantages, the seaward location advantages have a higher influence, and different indicators of location advantages have different influences on the evaluation results, the competitiveness of port location potential being the core indicator.
Key words: Maritime Silk Road; location advantages; ports; shipping network; spatial patterns
MOU Naixia , WANG Chunying , CHEN Jinhai , YANG Tengfei , ZHANG Lingxian , LIAO Mengdi . Spatial pattern of location advantages of ports along the Maritime Silk Road[J]. Journal of Geographical Sciences, 2021 , 31(1) : 149 -176 . DOI: 10.1007/s11442-021-1837-9
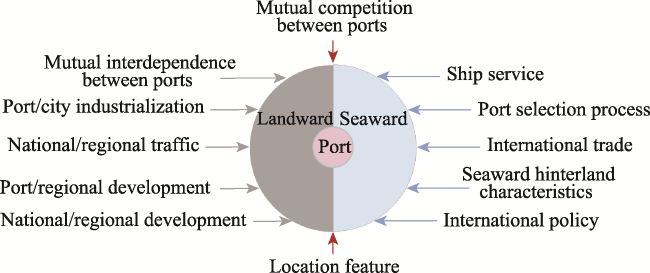
Figure 1 Contents of related studies on port location |
Table 1 Summary of the main research on location advantages |
| Reference | Research content | Conclusions | Related indicator |
|---|---|---|---|
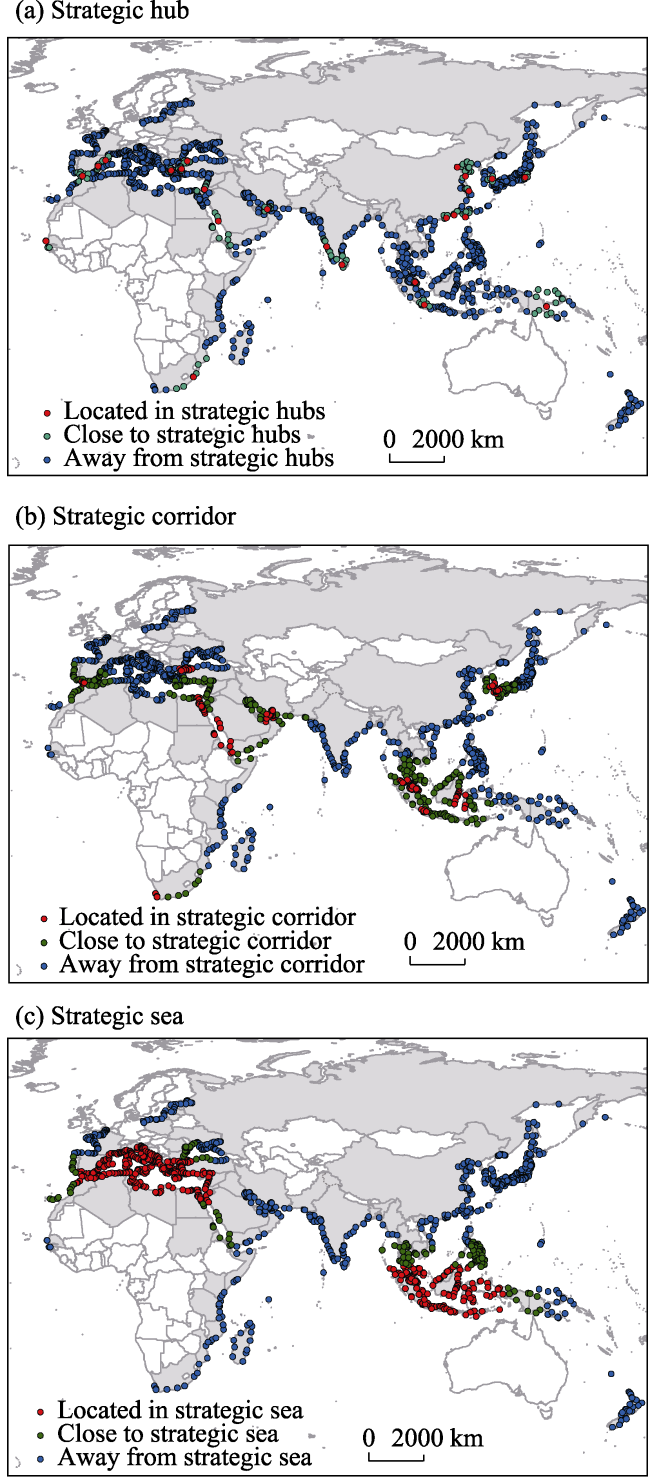
| Wang et al., 2018b | The correlation between port location and strategic position | Port will exert more influence on the trades and the transportation of strategic supplies within its area if it belongs to a strategic hub, a strategic corridor or a strategic sea | The influence of strategic shipping pivot |
| An et al., 2000 | Analyze the development situation of large- scale container ports and fierce competition in the world | Discuss the blueprint of China’s container hub ports, and verify the correlation between port location conditions and cargo source competitiveness | The competitiveness of port location potential |
| Peng et al., 2018b | Use weighted degree centrality, weighted closeness centrality and weighted betweenness centrality to evaluate the networks status of ports | Network status index plays a decisive role in the comprehensive competitiveness of a port: the higher a port’s ranking in network status, the stronger its comprehensive competitiveness | Port network status |
| Lu and Chen, 2008 | Evaluate the location advantages of Wuhan city circle based on the gravity scale of administrative division elements and traffic factors | Wuhan city circle has significant location advantages compared with other counties and cities in the province | The influence of city |
| Jin et al., 2008 | Select the density of traffic network, the influence degree of traffic trunk line and the degree of location advantages to identify the traffic location advantages of each regional unit in China from the three dimensions of point, line and surface | The distribution of regional traffic advantage in China is “partial normal” | The influence of traffic trunk and road network density in hinterland |
| Yang et al., 2008 | Select the length of national railway, inland waterway and highway to quantitatively analyze the development of China’s inter provincial comprehensive transportation | There are serious differences of the transportation development in China | Road network density in hinterland |
Figure 2 The schematic diagram of location advantages of ports |
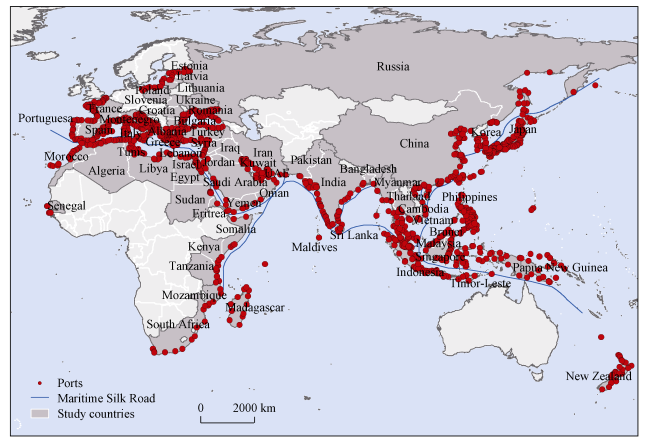
Figure 3 The study countries and ports |
Table 2 The data source |
| Assessment index | Data | Data sources |
|---|---|---|
| The influence of strategic shipping pivot | The distribution of strategic hubs, strategic corridors and strategic sea | See reference (Wang et al., 2018b) (44 strategic hubs, 7 strategic corridors and 3 strategic seas are in worldwide) |
| The competitiveness of port location potential | The hinterland economic data, the throughputs of ports, port sizes | The economic data is from https://www.yidaiyilu.gov.cn/ and http://www.worldbank.org/; The throughputs data of ports are from http://www.worldbank.org/ and http://data.stats.gov.cn/gjwz.htm; Ports’ sizes are from World Port Index (http://www.nga.mil/) |
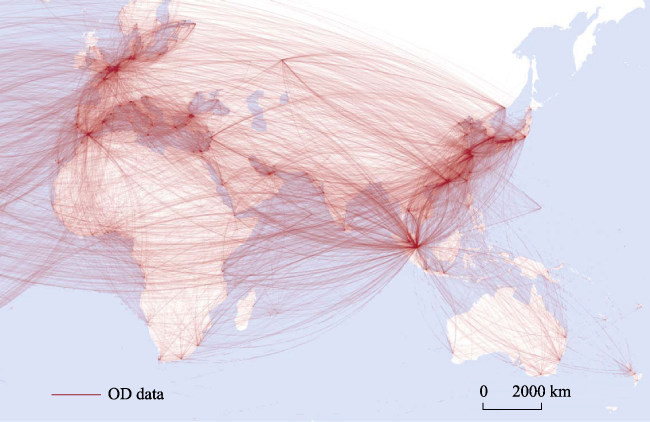
| Port network status | AIS data | Global AIS data of 2014 |
| The influence of city | City information | From OpenStreetMap (http://www.openstreetmap.org/) |
| The influence of traffic trunk | Road network information | From OpenStreetMap (http://www.openstreetmap.org/) |
| Road network density in hinterland | The length of road network, hinterland areas | From https://www.yidaiyilu.gov.cn/ and https://www.cia.gov/index.html |
Note: Regardless of the impact of hinterland cross and mutual competition, the port hinterland is defined as the entire administrative division of the country to which the port belongs. |
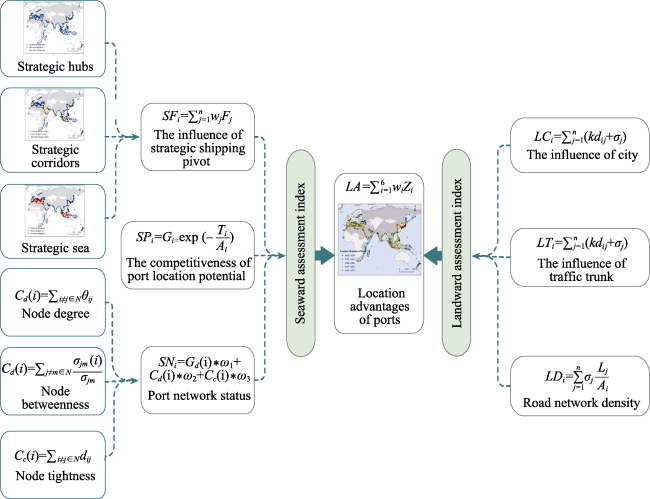
Figure 4 The evaluation index system of location advantages of ports |
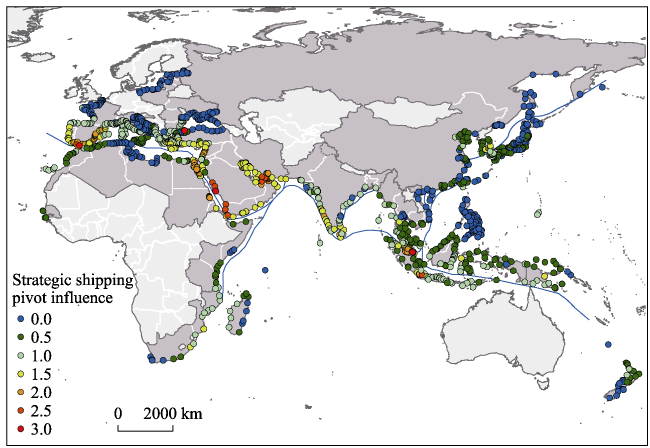
Figure 5 Space distribution of strategic shipping pivot |
Figure 6 The influence of strategic shipping pivot in maritime transport |
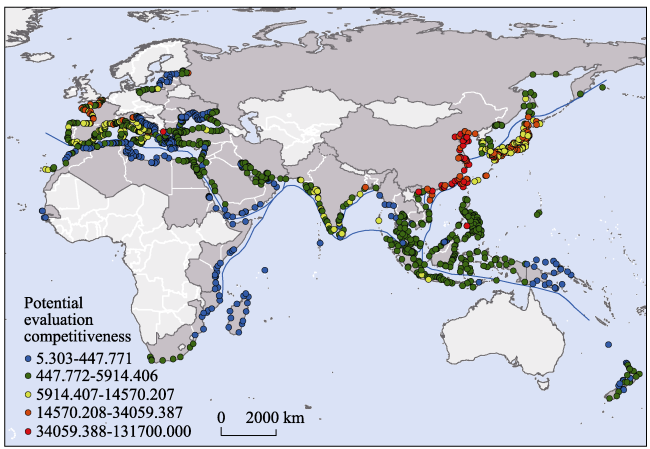
Figure 7 The competitiveness of location potential in maritime transport |
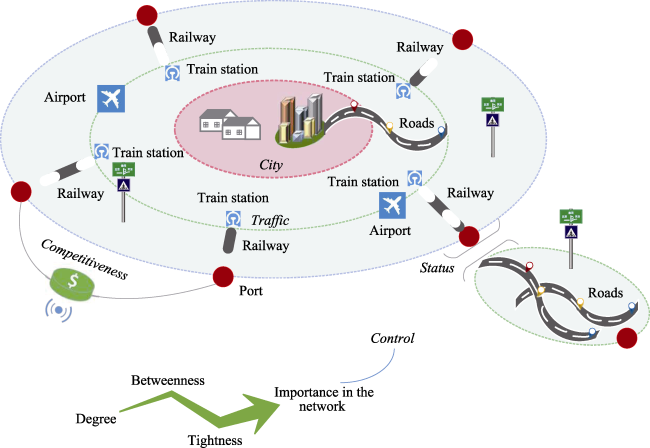
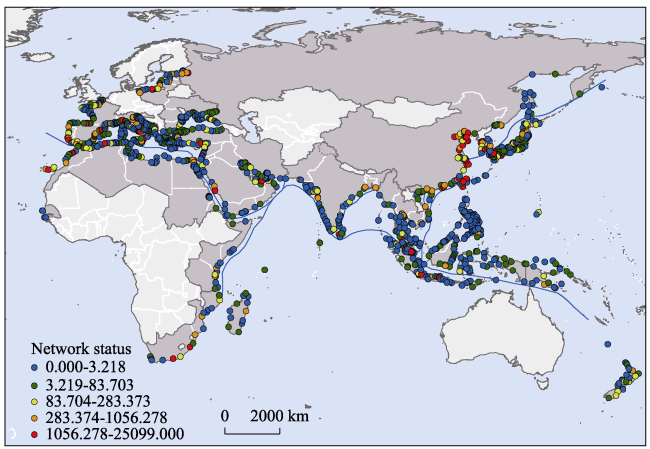
Figure 8 Structure of shipping network |
Figure 9 The importance of the network status in maritime transport |
Table 3 Calculation parameter of the influence of city |
| Respects | Range of influence (km) | Attenuation coefficient | Weight |
|---|---|---|---|
| Capital | 400 | -1/10000 | 40 |
| First-level administrative center | 100 | -2/10000 | 20 |
| Second-level administrative center | 50 | -3/10000 | 15 |
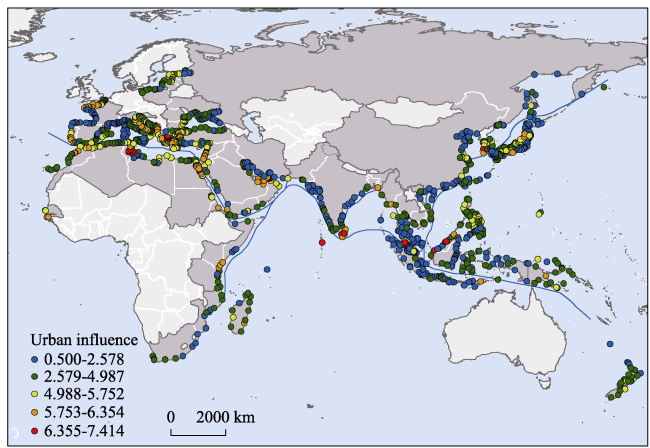
Figure 10 The influence of city in harbor hinterland |
Table 4 Calculation parameter of traffic trunk influence |
| Respects | Range of influence(km) | Attenuation coefficient | Weight |
|---|---|---|---|
| Railway (Railway Station) | 60 | -1/30 | 2 |
| Highway | 45 | -1/30 | 1.5 |
| Trunk | 15 | -1/15 | 1 |
| Airport | 10 | -1/10 | 1 |
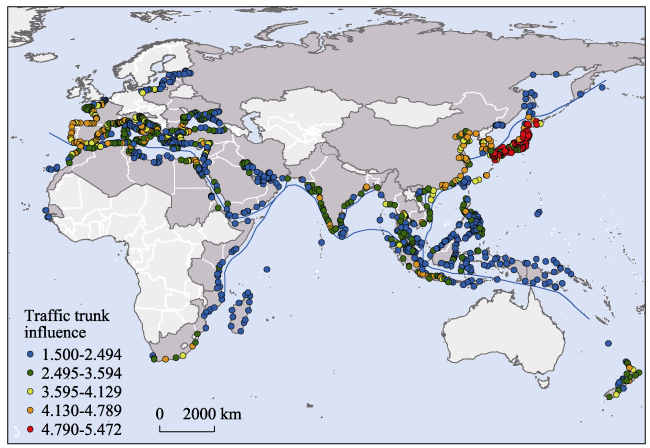
Figure 11 The influence of traffic trunk in harbor hinterland |
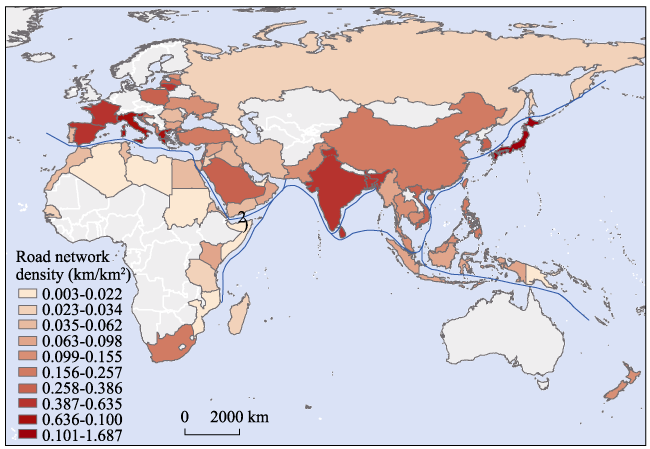
Figure 12 Road network density in harbor hinterland |
Table 5 The weight of evaluation index |
| Seaward index | Indicators | Weights | Landward index | Indicators | Weights |
| tde influence of strategic shipping pivot | 0.164 | tde influence of city | 0.156 | ||
| tde competitiveness of port location potential | 0.196 | tde influence of traffic trunk | 0.134 | ||
| Port network status | 0.185 | Road network density in hinterland | 0.165 |
Figure 13 Location advantages of ports along the Maritime Silk Road |
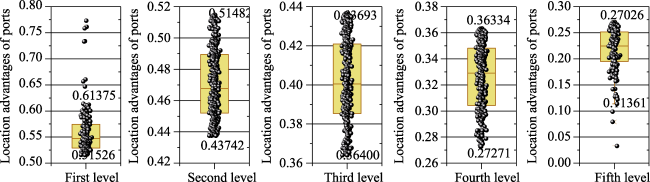
Figure 14 Level distribution box plot of location advantages of ports |
Table 6 Top 10 ports in location advantages |
| Rank | Port | Country | Rank in SF | Rank in SP | Rank in SN | Rank in LC | Rank in LT | Rank in LD | Score |
|---|---|---|---|---|---|---|---|---|---|
| 1 | Singapore | Singapore | 1 | 25 | 7 | 5 | 133 | 1 | 0.774 |
| 2 | Pulau Bukom | Singapore | 2 | 75 | 9 | 6 | 134 | 2 | 0.761 |
| 3 | Jurong Island | Singapore | 3 | 26 | 11 | 2 | 136 | 3 | 0.759 |
| 4 | Serangoon | Singapore | 4 | 86 | 94 | 4 | 132 | 4 | 0.734 |
| 5 | Pulau Sebarok | Singapore | 5 | 83 | 123 | 3 | 135 | 5 | 0.733 |
| 6 | Hong Kong | China | 189 | 2 | 1 | 48 | 57 | 36 | 0.660 |
| 7 | Shanghai | China | 190 | 1 | 3 | 47 | 18 | 17 | 0.657 |
| 8 | Port Klang | Malaysia | 6 | 127 | 8 | 54 | 279 | 228 | 0.647 |
| 9 | Shingu | Japan | 78 | 44 | 295 | 67 | 1 | 6 | 0.614 |
| 10 | Hannan Ko | Japan | 79 | 45 | 336 | 74 | 2 | 7 | 0.612 |
Table 7 Last 10 ports in location advantages |
| Rank | Port | Country | Rank in SF | Rank in SP | Rank in SN | Rank in LC | Rank in LT | Rank in LD | Score |
|---|---|---|---|---|---|---|---|---|---|
| 1250 | Petropavlovsk | Russia | 1259 | 921 | 1236 | 1257 | 1258 | 1121 | 0.157 |
| 1251 | Nikol Skoye | Russia | 1258 | 920 | 1237 | 1256 | 1259 | 1122 | 0.142 |
| 1252 | De Kastri | Russia | 1201 | 918 | 1190 | 1236 | 1249 | 1123 | 0.132 |
| 1253 | Nikolayevsk Na Amur | Russia | 1200 | 911 | 1196 | 1237 | 1250 | 1124 | 0.127 |
| 1254 | Okha | Russia | 1193 | 912 | 1197 | 1238 | 1251 | 1125 | 0.127 |
| 1255 | Vitaz Marine Terminal | Russia | 1194 | 919 | 1203 | 1255 | 1252 | 1126 | 0.122 |
| 1256 | Okhotsk Iy Reyd | Russia | 1256 | 910 | 1214 | 1258 | 1257 | 1127 | 0.114 |
| 1257 | Bukhta Nagayeva | Russia | 1257 | 916 | 1234 | 1259 | 1258 | 1128 | 0.099 |
| 1258 | Whangaroa | New Zealand | 907 | 1041 | 1239 | 1253 | 928 | 894 | 0.079 |
| 1259 | Kingston | New Zealand | 1157 | 1042 | 1240 | 1254 | 1209 | 895 | 0.032 |
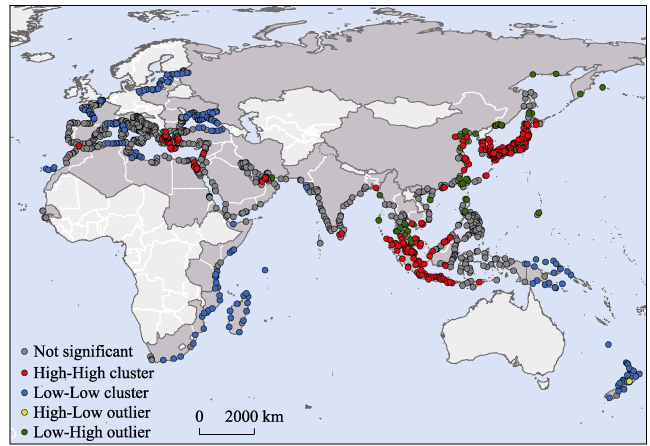
Figure 15 The high/low clustering of location advantages of ports |
| [1] |
|
| [2] |
|
| [3] |
|
| [4] |
|
| [5] |
|
| [6] |
|
| [7] |
|
| [8] |
|
| [9] |
|
| [10] |
|
| [11] |
|
| [12] |
HKTDC, Belt and Road, 2017. Retrieved from http://beltandroad.hktdc.com/en/about-the-belt-androad-initiative/ about-the-belt-and-road-initiative.aspx.
|
| [13] |
|
| [14] |
|
| [15] |
|
| [16] |
|
| [17] |
|
| [18] |
|
| [19] |
|
| [20] |
|
| [21] |
|
| [22] |
|
| [23] |
|
| [24] |
|
| [25] |
|
| [26] |
|
| [27] |
|
| [28] |
|
| [29] |
|
| [30] |
|
| [31] |
|
| [32] |
|
| [33] |
|
| [34] |
|
| [35] |
|
| [36] |
|
| [37] |
|
| [38] |
|
| [39] |
|
| [40] |
|
| [41] |
|
| [42] |
|
| [43] |
|
| [44] |
|
| [45] |
|
| [46] |
|
| [47] |
|
| [48] |
|
| [49] |
|
| [50] |
|
| [51] |
|
| [52] |
|
| [53] |
|
| [54] |
|
| [55] |
|
| [56] |
|
| [57] |
|
/
| 〈 |
|
〉 |