
Journal of Geographical Sciences >
Multidimensional measurement of poverty and its spatio-temporal dynamics in China from the perspective of development geography
|
Dong Yin (1992–), PhD Candidate, specialized in land resource evaluation and national land management. E-mail: dongy_simlab@163.com |
Received date: 2020-08-16
Accepted date: 2020-09-30
Online published: 2021-03-25
Supported by
National Natural Science Foundation of China(71974070)
National Natural Science Foundation of China(41501593)
National Key R&D Project(2016YFA0602500)
Humanities and Social Sciences Foundation of Ministry of Education of China(19YJCZH068)
Copyright
Exploring the spatio-temporal dynamics of poverty is important for research on sustainable poverty reduction in China. Based on the perspective of development geography, this paper proposes a panel vector autoregressive (PVAR) model that combines the human development approach with the global indicator framework for Sustainable Development Goals (SDGs) to identify the poverty-causing and the poverty-reducing factors in China. The aim is to measure the multidimensional poverty index (MPI) of China’s provinces from 2007 to 2017, and use the exploratory spatio-temporal data analysis (ESTDA) method to reveal the characteristics of the spatio-temporal dynamics of multidimensional poverty. The results show the following: (1) The poverty-causing factors in China include the high social gross dependency ratio and crop-to-disaster ratio, and the poverty-reducing factors include the high per capita GDP, per capita social security expenditure, per capita public health expenditure, number of hospitals per 10,000 people, rate of participation in the new rural cooperative medical scheme, vegetation coverage, per capita education expenditure, number of universities, per capita research and development (R&D) expenditure, and funding per capita for cultural undertakings. (2) From 2007 to 2017, provincial income poverty (IP), health poverty (HP), cultural poverty (CP), and multidimensional poverty have been significantly reduced in China, and the overall national poverty has dropped by 5.67% annually. there is a differentiation in poverty along different dimensions in certain provinces. (3) During the study period, the local spatial pattern of multidimensional poverty between provinces showed strong spatial dynamics, and a trend of increase from the eastern to the central and western regions was noted. The MPI among provinces exhibited a strong spatial dependence over time to form a pattern of decrease from northwestern and northeastern China to the surrounding areas. (4) The spatio-temporal networks of multidimensional poverty in adjacent provinces were mainly negatively correlated, with only Shaanxi and Henan, Shaanxi and Ningxia, Qinghai and Gansu, Hubei and Anhui, Sichuan and Guizhou, and Hainan and Guangdong forming spatially strong cooperative poverty reduction relationships. These results have important reference value for the implementation of China’s poverty alleviation strategy.
DONG Yin , JIN Gui , DENG Xiangzheng , WU Feng . Multidimensional measurement of poverty and its spatio-temporal dynamics in China from the perspective of development geography[J]. Journal of Geographical Sciences, 2021 , 31(1) : 130 -148 . DOI: 10.1007/s11442-021-1836-x
Table 1 The candidate set of poverty measurement indicators |
| Dimension | Indicator | Meaning | Symbol |
|---|---|---|---|
| Income poverty A | A0 Per capita annual savings (yuan per person) | Represents income poverty | lnPSD |
| A1 Per capita GDP (yuan per person) | Reflects the level of regional economic development | lnPGDP | |
| A2 Proportion of non-agricultural industries (%) | Reflects the regional industrial structure and employment structure | lnIS | |
| A3 Per capita social security expenditure (yuan per person) | Reflects the level of social security treatment for residents | lnPSSE | |
| A4 Social gross dependency ratio (%) | Reflects the burden on the working-age population | lnGDR | |
| A5 Crop-to-disaster ratio (%) | Reflects the probability and vulnerability to natural disasters | lnFCA | |
| Healthy poverty B | B0 Rate of disease incidence (‱) | Represents health poverty | lnIDI |
| B1 Per capita public health expenditure (yuan per person) | Reflects the government’s investment in public health care | lnPPHE | |
| B2 Number of hospitals per 10,000 people (unit per 10,000 persons) | Reflects accessibility to basic public health services in the region | lnPHOS | |
| B3 Rate of participation in new rural cooperative medical scheme (%) | Reflects the level of rural medical coverage | lnNCMS | |
| B4 Health insurance coverage rate of urban residents (%) | Reflects the coverage of basic medical care services for residents | lnUHI | |
| B5 Vegetation coverage (%) | Reflects the quality of the regional environment | lnFCR | |
| Cultural poverty C | C0 Illiteracy rate (%) | Represents cultural poverty | lnIR |
| C1 Per capita education expenditure (yuan per person) | Reflects the intensity of financial investment in public education | lnPEF | |
| C2 Number of universities (unit) | Reflects the level of higher education | lnHEDU | |
| C3 Student-teacher ratio (%) | Reflects the regional educational human resource allocation | lnSTR | |
| C4 Per capita research and development (R&D) expenditure (yuan per person) | Reflects the intensity of investment in regional scientific and technological financial resources | lnPRD | |
| C5 Funding per capita for cultural undertakings (yuan per person) | Reflects the level of public cultural services for the mass | lnPMCE |
Table 2 Results of estimation of the relationship between indicator variables |
| Variables | h_dlnPSD | Variables | h_dlnIDI | Variables | h_dlnIR |
|---|---|---|---|---|---|
| Lag.h_dlnPSD | 0.371*** (-5.91) | Lag.h_dlnIDI | -0.062 (-0.57) | Lag.h_dlnIR | -0.182*** (-2.88) |
| Lag.h_dlnPGDP | 0.109*** (-3.25) | Lag.h_dlnPPHE | -0.199** (-2.54) | Lag.h_dlnPEF | -0.138 (-1.24) |
| Lag.h_dlnIS | 0.234 (-0.68) | Lag.h_dlnPHOS | -0.363** (-1.96) | Lag.h_dlnHEDU | -0.394 (-0.57) |
| Lag.h_dlnPSSE | 0.096*** (-4.00) | Lag.h_dlnNCMS | -1.497*** (-3.79) | Lag.h_dlnSTR | 0.060 (-0.12) |
| Lag.h_dlnGDR | -0.027 (-0.97) | Lag.h_dlnUHI | 0.056 (-1.15) | Lag.h_dlnPRD | -0.373** (-2.08) |
| Lag.h_dlnFCA | -0.006*** (-4.66) | Lag.h_dlnFCR | -0.237*** (-4.01) | Lag.h_dlnPMCE | -0.197*** (-3.06) |
| Lag2.h_dlnPSD | 0.032 (-0.97) | Lag2.h_dlnIDI | -0.027 (-0.37) | Lag2.h_dlnIR | -0.029 (-0.57) |
| Lag2.h_dlnPGDP | 0.070** (-2.12) | Lag2.h_dlnPPHE | -0.058 (-0.88) | Lag2.h_dlnPEF | -0.231** (-2.53) |
| Lag2.h_dlnIS | 0.088 (-0.37) | Lag2.h_dlnPHOS | -0.334** (-2.14) | Lag2.h_dlnHEDU | -5.987*** (-6.14) |
| Lag2.h_dlnPSSE | 0.019 (-1.15) | Lag2.h_dlnNCMS | 0.620 (-1.02) | Lag2.h_dlnSTR | 0.084 (-0.30) |
| Lag2.h_dlnGDR | -0.071*** (-2.87) | Lag2.h_dlnUHI | -0.039 (-1.07) | Lag2.h_dlnPRD | -0.094 (-0.86) |
| Lag2.h_dlnFCA | -0.005*** (-4.34) | Lag2.h_dlnFCR | 0.051 (-0.49) | Lag2.h_dlnPMCE | -0.056 (-1.23) |
Notes: Lag. is first-period lag and Lag2. is second-period lags; in brackets are the t-test values, * * *, * *, and * indicating significant at levels of 1%, 5%, and 10%, respectively. |
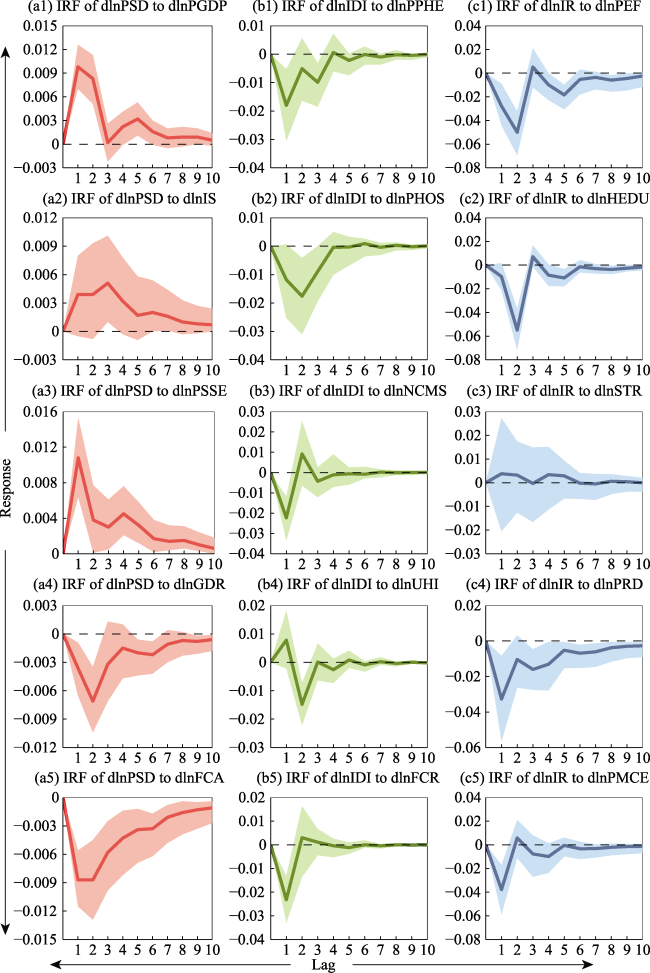
Figure 1 Results of impulse response of variables to characteristic indicators of multidimensional poverty |
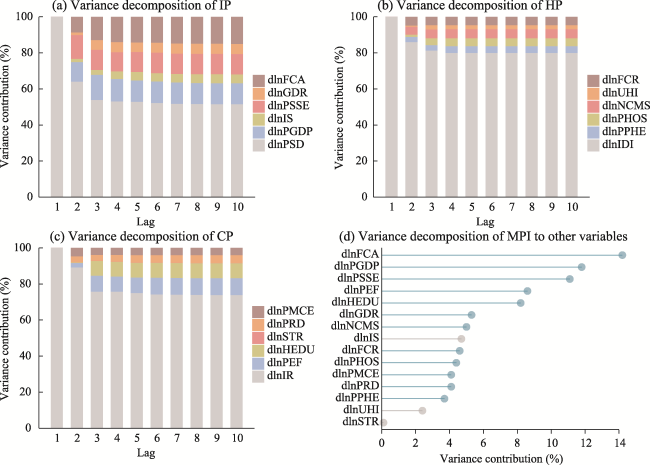
Figure 2 Results of variance decomposition of the poverty indicators |
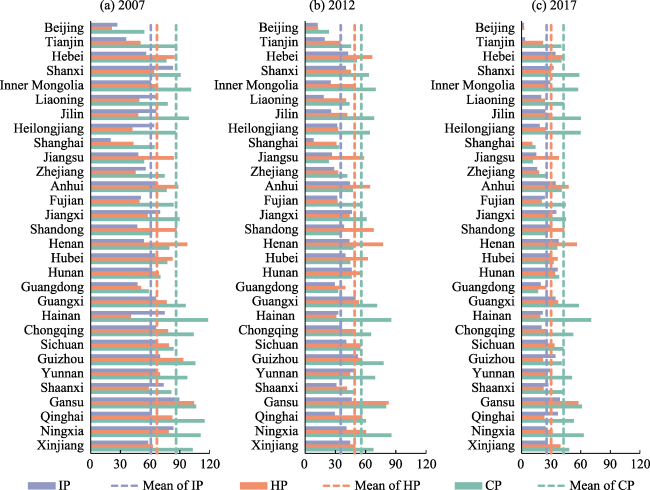
Figure 3 Results of measurement of provincial single-dimensional poverty in 2007, 2012, and 2017 |
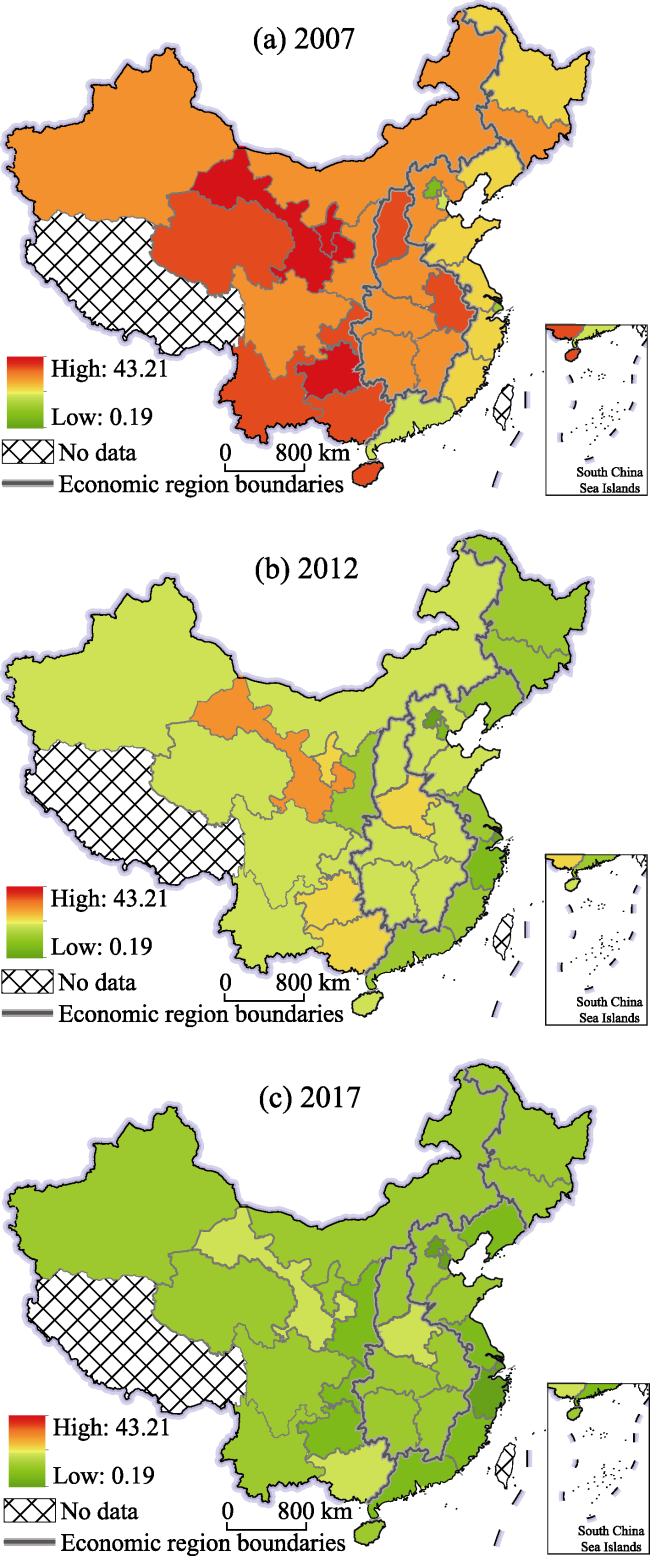
Figure 4 Results of comprehensive measurement of multidimensional poverty in China in 2007, 2012, and 2017 |
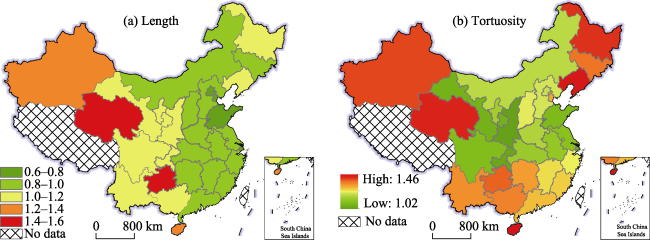
Figure 5 Spatial distribution of geometric features of the LISA time path in China |
Table 3 Spatio-temporal transition matrices of multidimensional poverty |
| Period | HH | LH | LL | HL | |
|---|---|---|---|---|---|
| 2007-2011 | HH | Type Ⅰ (Shanxi, Henan, Hubei, Guangxi, Chongqing, Sichuan, Guizhou, Yunnan, Gansu, Qinghai, Ningxia, Xinjiang) | Type Ⅱ (Inner Mongolia, Shaanxi) | Type Ⅳ(1) | Type Ⅲ |
| LH | Type Ⅱ (Shandong, Hunan) | TypeⅠ(Liaoning, Guangdong) | Type Ⅲ (Heilongjiang) | Type Ⅳ(2) | |
| LL | Type Ⅳ(1) | Type Ⅲ | Type Ⅰ (Beijing, Tianjin, Jilin, Shanghai, Jiangsu, Zhejiang, Fujian) | Type Ⅱ | |
| HL | Type Ⅲ | Type Ⅳ(2) | Type Ⅱ | Type Ⅰ (Hebei, Anhui, Jiangxi, Hainan) | |
| 2012-2017 | HH | Type Ⅰ (Shanxi, Shandong, Henan, Hubei, Hunan, Sichuan, Yunnan, Gansu, Qinghai, Ningxia, Xinjiang) | Type Ⅱ (Chongqing, Guizhou) | Type Ⅳ(1) | Type Ⅲ (Guangxi) |
| LH | Type Ⅱ (Inner Mongolia) | TypeⅠ(Liaoning, Guangdong, Shaanxi) | Type Ⅲ | Type Ⅳ(2) | |
| LL | Type Ⅳ(1) (Heilongjiang) | Type Ⅲ | Type Ⅰ (Beijing, Tianjin, Shanghai, Jiangsu, Zhejiang, Fujian) | Type Ⅱ (Jilin) | |
| HL | Type Ⅲ | Type Ⅳ(2) | Type Ⅱ | Type Ⅰ (Hebei, Anhui, Jiangxi, Hainan) | |
| 2007-2017 | HH | Type Ⅰ (Shanxi, Inner Mongolia, Henan, Hubei, Sichuan, Yunnan, Gansu, Qinghai, Ningxia, Xinjiang) | Type Ⅱ (Chongqing, Guizhou, Shaanxi) | Type Ⅳ(1) | Type Ⅲ (Guangxi) |
| LH | Type Ⅱ (Heilongjiang, Shandong, Hunan) | TypeⅠ(Liaoning, Guangdong) | Type Ⅲ | Type Ⅳ(2) | |
| LL | Type Ⅳ(1) | Type Ⅲ | TypeⅠ(Beijing, Tianjin, Shanghai, Jiangsu, Zhejiang, Fujian) | Type Ⅱ (Jilin) | |
| HL | Type Ⅲ | Type Ⅳ(2) | Type Ⅱ | TypeⅠ(Hebei, Anhui, Jiangxi, Hainan) |
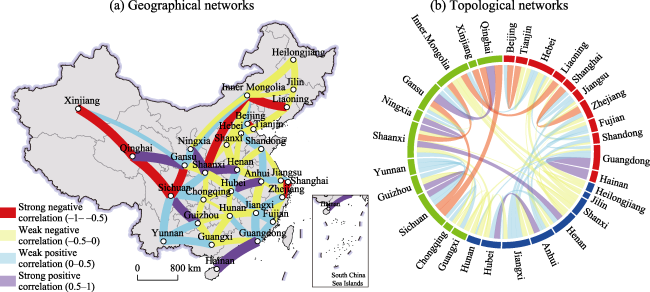
Figure 6 Spatio-temporal network of multidimensional poverty dynamics among provinces in China |
| [1] |
|
| [2] |
|
| [3] |
|
| [4] |
|
| [5] |
|
| [6] |
|
| [7] |
|
| [8] |
|
| [9] |
|
| [10] |
|
| [11] |
|
| [12] |
|
| [13] |
|
| [14] |
|
| [15] |
|
| [16] |
|
| [17] |
|
| [18] |
|
| [19] |
|
| [20] |
|
| [21] |
|
| [22] |
|
| [23] |
|
| [24] |
|
| [25] |
|
| [26] |
|
| [27] |
|
| [28] |
|
| [29] |
|
| [30] |
|
| [31] |
|
| [32] |
|
| [33] |
|
| [34] |
|
| [35] |
|
| [36] |
|
| [37] |
|
| [38] |
|
| [39] |
|
| [40] |
|
| [41] |
|
| [42] |
|
| [43] |
|
| [44] |
|
| [45] |
|
| [46] |
|
| [47] |
Wang,
|
| [48] |
|
| [49] |
|
| [50] |
|
| [51] |
|
/
| 〈 |
|
〉 |