Research Articles

Revealing ecosystem services relationships and their driving factors for five basins of Beijing

  • GAO Jiangbo , 1 ,
  • ZUO Liyuan 1, 2
Expand
  • 1. Key Laboratory of Land Surface Pattern and Simulation, Institute of Geographic Sciences and Natural Resources Research, CAS, Beijing 100101, China
  • 2. University of Chinese Academy of Sciences, Beijing 100049, China

Gao Jiangbo, PhD, specialized in ecosystem services at river basin. E-mail:

Received date: 2020-08-05

  Accepted date: 2020-10-10

  Online published: 2021-03-25

Supported by

National Natural Science Foundation of China(41671098)

National Natural Science Foundation of China(42071288)

National Key Research and Development Program of China(2018YFC1508900)

National Key Research and Development Program of China(2018YFC1508801)

Beijing Environmental Quality Monitoring Project (2018)(Y88M1800AL)

Copyright

Copyright reserved © 2021. Office of Journal of Geographical Sciences All articles published represent the opinions of the authors, and do not reflect the official policy of the Chinese Medical Association or the Editorial Board, unless this is clearly specified.

Abstract

A clear understanding of the relationships among multiple ecosystem services (ESs) is the foundation for sustainable urban ecosystem management. Quantitatively identifying the factors that influence ES trade-offs and synergies can contribute to deepening ES research, from knowledge building to decision making. This study simulated soil conservation, water yield and carbon sequestration in Beijing, China, from 2015-2018. The spatial trade-offs and synergies of these three ESs within the five major river basins in Beijing were explored using geographically weighted regression. Furthermore, geographical detector was applied to quantitatively identify the driving mechanism of the environmental factors for the ES trade-offs and synergies. The results show the following: (1) the spatial relationships between soil conservation and water yield, as well as between water yield and carbon sequestration, were mainly trade-offs. There was a spatial synergy between soil conservation and carbon sequestration. (2) Regarding the spatial trade-off/synergy between soil conservation and water yield in Beijing, the dominant influencing factor was temperature/elevation, and the dominant interactions of the spatial trade-off and synergy between these two ESs in Beijing and the Chaobai River Basin are all manifested in the superposition of precipitation and potential evapotranspiration, temperature, and elevation. (3) Topographic factors were the dominant factors influencing the spatial relationship between soil conservation and carbon sequestration in Beijing and its five major river basins. As a result of the distribution of water systems and hydrological characteristics of the basins, differences were observed in the effects of different combinations of interaction factors on the spatial relationship between these two ESs in different basins. (4) Temperature had the strongest explanatory power in terms of the spatial trade-offs and synergies between water yield and carbon sequestration. The interactions between precipitation and temperature and between precipitation and elevation were the dominant interactions affecting the spatial relationship between water yield and carbon sequestration in Beijing. Overall, the explanatory power of influencing factors on the trade-offs and synergies and the degree of interaction between factors coexist in different basins with consistency and differences. Therefore, understanding the quantitative characteristics of basin-scale spatial trade-offs and synergies between ESs is important for ecosystem management and the promotion of synergy in different basins.

Cite this article

GAO Jiangbo , ZUO Liyuan . Revealing ecosystem services relationships and their driving factors for five basins of Beijing[J]. Journal of Geographical Sciences, 2021 , 31(1) : 111 -129 . DOI: 10.1007/s11442-021-1835-y

1 Introduction

Ecosystem services (ESs) refer to the natural conditions and utilities provided and maintained by ecosystems that sustain human life (Daily, 1997). It has been increasingly recognized that ESs are not independent of each other (Rodriguez et al., 2006). Human intervention and domination of one or more ESs will intentionally or unintentionally affect the provision of other ESs, resulting in trade-offs and synergies between ESs (Bennett et al., 2009). Ignoring the trade-offs and synergies between ESs may lead to a decline in the supply of some ESs and even threaten the stability and security of entire ecosystems (Holling and Meffe, 1996). To realize the sustainable supply of various ESs and the orderly development of society, economy and ecology, we should not only pursue the benefits of a certain ES, but also take into account various ESs to maximize their comprehensive benefits (Li et al., 2013; Zheng et al., 2013). Scientifically understanding the complex relationships between ESs and quantitatively identifying the driving mechanisms behind the trade-offs and synergies are essential to minimize the negative effects of trade-offs and achieve synergies between multiple ESs (Dade et al., 2019). Such an understanding could also aid in finding a balance between ecological protection, social development and economic growth (Dai et al., 2016).
A coupling mechanism of coercion and constraint exists between urban development and the ecological environment (Huang and Fang, 2003). Since the 1990s, the rapid urbanization of Beijing came from the deprivation of the ecological environment and resources. In the context of substantial development pressures and fragile ecological conditions, coordinating conflicts between urban development and ecological conservation and achieving a harmonious coexistence between humans and nature are focal concerns in global economic and social development (Markus, 2002; Hubacek et al., 2009). Over the past ten years, China has clearly defined a strategic goal for Beijing to become a worldwide first-class capital city of harmony and livability. Beijing developed and implemented a series of macro policies to enhance the positive feedback of urban development and ecological protection. For example, the “One Million-Mu (666 km2) Plain Afforestation Project” was launched in 2012 (http://www.gov.cn/xinwen/2015-12/30/content_5029570.htm). The goal of this project was to enhance the ecological carrying capacity of the capital city and improve the urban environment. The Beijing City Master Plan (2016-2035), which was approved in 2017, called for enhanced management of the ecological bottom line to use the carrying capacity of the resources and environment to enforce city reforms and development (http://www.beijing.gov. cn/gongkai/guihua/wngh/cqgh/201907/t20190701_100008.html). The Beijing Ecological Conservation Red Line Plan, which was issued in 2018, divided Beijing's ecological conservation red line areas into four categories, including soil conservation, water retention, biodiversity maintenance and important rivers and wetlands based on the dominant ecological functions (http://www.gov.cn/xinwen/2018-07/13/content_5306150.htm), thereby promoting the collaborative optimization of multiple ESs. Thus, the concept of integrating ESs into the sustainable development of large cities and city clusters, such as Beijing, has been deepened and practiced.
Currently, because of the rising human demands for ESs in cities and surrounding areas, research concerning urban ESs has mainly focused on hot topics such as the identification, manifestation, spatiotemporal dynamics and driving mechanisms of ES trade-offs and synergies (Dai et al., 2016; Egoh et al., 2011). However, analysis of the correlation and differentiation of different spatial scale patterns in cities is still weak. The spatiotemporal heterogeneity of the natural geographic environment results in regional differentiation in the relationships between ESs (Su and Fu, 2013). The trade-offs and synergies between the same pair of ESs change across different regions along with the spatiotemporal changes (Bai et al., 2011). Simultaneously, revealing the distribution patterns of trade-offs and synergies between ESs could enhance our comprehensive understanding of an entire region, coordinate the supply of services across different regions and achieve a balance in the supply of and demand for ESs in the entire region (Peng et al., 2017). As regions where natural processes and human activities interact strongly, basins have complex ecosystem structures and diverse service types that reflect the complete characteristics of society and ecology (Liu et al., 2019). Basin-scale work and conclusions also contribute to systematic guidance and optimization of ecological development and safety patterns. In view of the above, this study comprehensively considered Beijing and its five major basins as the study area and simulated three key ESs: soil conservation, water yield and carbon sequestration. Spatial trade-offs and synergies among these three ESs were calculated by geographically weighted regression (GWR). The dominant factors affecting the spatial relationships between ESs and the degree of interaction between factors are quantitatively identified by the geographical detector to achieve an analysis of the mechanisms of urban ESs, building a scientific foundation for efficient ecosystem management and the improvement of living environment when implementing the above policies.

2 Study area and methods

2.1 Study area

Beijing is located at the northern edge of the North China Plain (between 39°28°-41°05°N, 115°25°-117°30°). It covers an area of 16,410.54 km², of which 62% is mountainous. The city is surrounded by mountains to the west, north and northeast, and its southeast is a alluvial plain inclining to the Bohai Sea, with an elevation range from -27 to 2262 m, presenting a terrain distribution of high northwest and low southeast (Figure 1). The climate in Beijing is characterized by a typical warm temperate semi-humid continental monsoon climate, with hot and rainy summers, cold and dry winters, and short spring and autumn. The annual average temperature is 10-12℃, and the precipitation is mainly concentrated in June to August, with an annual average precipitation of 600 mm. The five major river basins in Beijing connect the entire water system of the city: North Canal Basin, Daqing River Basin, Chaobai River Basin, Ji Canal Basin and Yongding River Basin.
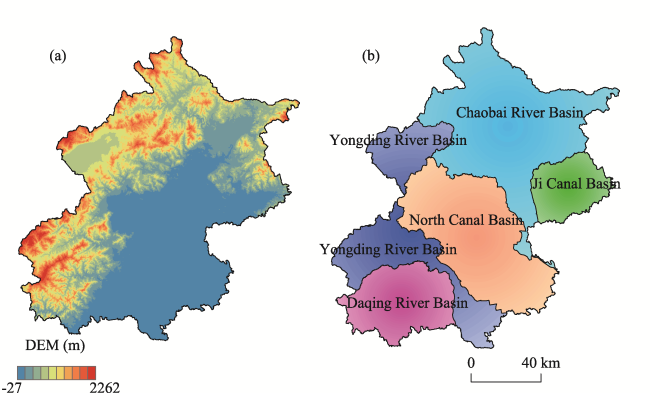
Figure 1 Location of the study area

2.2 Data sources

The Digital Elevation Model (DEM) came from Google Earth with a spatial resolution of 9 m. Meteorological data such as temperature and precipitation came from the National Climate Center of the China Meteorological Administration. In this paper, 35 meteorological stations in Beijing and its surrounding areas were selected, and the professional meteorological interpolation software ANUSPLIN was used to interpolate the raster data. Land use type was obtained from the Beijing Municipal Ecology and Environment Bureau, at a resolution of 15 m. Using HJ1A/B CCD (30 m), GF1 WFV (16 m) (http://www.cresda.com/CN/) and MODIS MOD09GQ (250 m) (https://lpdaac.usgs.gov) product data as the data source, the Normalized Differential Vegetation Index (NDVI) data is preprocessed by radiometric calibration, atmospheric correction, orthorectification, and obtained by linear combination of near-infrared and red band reflectance, with a spatial resolution of 30 m. Soil mechanical composition data were provided by the Harmonized World Soil Database (HWSD) (v1.2) (http://webarchive.iiasa.ac.at), and soil depth data came from the Soil Data Center, National Earth System Science Data Sharing Infrastructure, National Science and Technology Infrastructure of China (http://soil.geodata.cn), for both soil datasets, the spatial resolution was 1 km × 1 km. Vegetation type data with 1-km resolution was derived from the Resource and Environment Data Cloud Platform, Chinese Academy of Sciences (http://www.resdc.cn). Regarding the differences in the source and spatial resolution of the basic data, this study uses the spatial resolution of the NDVI data (30 m) as the benchmark. Due to the relatively low spatial heterogeneity of soil types and vegetation types within a range of 1 km, in order to match with other data scales, they are downscaled to a 30-m resolution. The DEM data with a resolution of 9 m and the land use data with a resolution of 15 m is upscaled to 30 m.

2.3 Methods

2.3.1 Revised Universal Soil Loss Equation model
In this study, the Revised Universal Soil Loss Equation (RUSLE) model was used to evaluate the soil conservation of the study area. RUSLE model is the most commonly used method for calculating soil erosion and soil conservation due to its easy access to input parameters and good simulation results (Feng et al., 2016; Bai et al., 2012). The model first evaluates the potential soil erosion according to the topography and climatic conditions, and then calculates the actual soil erosion in consideration of vegetation coverage and engineering measures. The difference between the two is the soil conservation. The mathematical expression is as follows:
$A_{c}= A_{p}- A_{m}=R\times K\times LS\times (1-C\times P)$
where Ac, Ap and Am are the amount of soil conservation, potential soil erosion, and actual soil erosion (t·hm‒2·yr‒1), respectively; R is the rainfall erosivity index (MJ·mm·hm‒2·h‒1·yr‒1); K refers to soil erosion factor (t·hm2·h·hm‒2·MJ‒1·mm‒1); LS is the slope length-gradient factor; C is the crop/vegetation and management factor; and P is the support practice factor. The LS, C, and P factors are dimensionless.
2.3.2 Integrated Valuation of ESs and Tradeoffs model
The water yield module in the Integrated Valuation of ESs and Tradeoffs (InVEST) model is mainly based on the Budyko framework and the principle of water balance (Sharp et al., 2016). It calculates the annual water yield combined with factors such as annual average precipitation, annual average potential evapotranspiration, plant available water capacity, root depth, land use type and other factors in the study area. Compared with other hydrological models, InVEST model relies on geographic information system (GIS) and has advantages in visualization and spatialization (Leh et al., 2013). The calculation is as follows:
$Y(x)=\lgroup 1-\frac{AET(x)}{P(x)}\rgroup \cdot P(x)$
where Y(x), AET(x), and P(x) are respectively the annual water yield, annual actual evapotranspiration, and annual precipitation on grid unit x. For vegetated land use and land cover, the evapotranspiration portion of the water balance, \frac{AET(x)}{P(x)}, was calculated from the Budyko curve (Fu, 1981; Zhang et al., 2004).
2.3.3 Carnegie-Ames-Stanford Approach
The Carnegie-Ames-Stanford Approach (CASA) model is a process model based on the utilization of light energy. It couples environmental variables, remote sensing data and vegetation physiological parameters to achieve the calculation of large-scale vegetation net primary productivity (NPP) and the study of global carbon cycle (Crabtree et al., 2009). The CASA model obtains a variety of vegetation parameters through remote sensing, and can estimate the interannual and seasonal dynamics of NPP at regional and global scales (Mohamed et al., 2004). The equation is expressed as:
$NPP_{t}=APAR_{t}\times \varepsilon_{t}$
where t is the period over the NPP accumulated; APARt (MJ·m‒2) is the photosynthetically active radiation absorbed by vegetation; εt (gC·MJ‒1) is the maximal light utilization efficiency of the vegetation in ideal conditions.
2.3.4 Geographically weighted regression
GWR model is a method for local spatial analysis proposed by Brunsdon et al. (1996). It is used to study the local non-stationarity of independent variables in space and is an extension of traditional regression models. This method adds the spatial geographic location of the data to the parameters, and evaluates the variation of the relationship between the independent variable and the dependent variable on the spatial scale by obtaining local parameters (Brunsdon et al., 1998). The GWR model is mainly used in this study to measure the trade-off and synergy of the three ESs of soil conservation, water yield, and carbon sequestration. A negative regression coefficient means a trade-off relationship, and a positive regression coefficient means a synergy relationship. In order to ensure the comparability of the trade-offs and synergy coefficients between ESs in Beijing and its different basins, this paper first standardized the three ESs, and then used the standardized values as independent variables and dependent variables for spatial regression analysis. The model takes this form:
$y_{i}=\beta_{0}(\mu_{i},v_{i})+\sum_{k=1}^{p}\beta_{k}(\mu_{i},v_{i})x_{ik}+\varepsilon_{i}$
where (μi, vi) refers to the spatial position of point i; p represents the number of independent variables; yi, xik, and εi are the dependent variables, independent variables, and random errors, respectively; β0 (μi, vi) is the intercept at point i; and βk (μi, vi) is the regression coefficient.
2.3.5 Geographical detector
Geographical detector is a new statistical method that detects the spatial stratified heterogeneity of features and reveals the driving force behind it. Its core hypothesis is that if an independent variable X has an important influence on a dependent variable Y, then there is a similar spatial distribution between them (Wang and Xu, 2017). Geographical detector includes four detectors: factor detector, interaction detector, ecological detector, and risk detector. The q statistics can be used to measure spatial stratified heterogeneity, detect explanatory factors, and analyze the interaction between variables (Wang and Hu, 2012). In this study, the factor detector is used to detect the degree of interpretation of the independent variable X (environmental factor) to the dependent variable Y (trade-off and synergy), and the interaction detector is used to detect whether environmental factors would increase or decrease the explanatory power of trade-offs and synergies when taken together, as well as the strength, direction, linearity or nonlinearity of the interaction (Table 1) (Wang et al., 2010). The exploration of the correlation between X and Y can be demonstrated as follows:
$q=1-\frac{\sum_{h=1}^{L}N_{h}\sigma_{h}^{2}}{N \sigma^{2}}$
Table 1 Types of interaction between two covariates
Description Interaction
q(X1∩X2) <Min(q(X1), q(X2)) Weaken, nonlinear
Min(q(X1), q(X2)) <q(X1∩X2) < Max(q(X1), q(X2)) Weaken, single factor nonlinear
q(X1∩X2)> Max(q(X1), q(X2)) Enhance, double factors
q(X1∩X2) =q(X1) + q(X2) Independent
q(X1∩X2)>q(X1) + q(X2) Enhance, nonlinear
where h=1, 2, …, L refers to the strata of variables; N and $\sigma^{2}$ represent the total number of sample units and the variance, respectively; and Nh and $\sigma_{h}^{2}$ are respectively the number of sample units and the variance in stratum h. The term $\sum_{h=1}^{L}N_{h}\sigma_{h}^{2}$ is the sum of the strata variance, $ N \sigma^{2}$ is the total sum of the variance.

3 Results and analysis

3.1 The pattern of ecosystem services and their spatial relationships in Beijing

3.1.1 Spatio-temporal characteristics of ecosystem services
In this study, we simulated three ESs, including soil conservation, water yield and carbon sequestration, in Beijing from 2015-2018. We analyzed the spatial patterns of the mean value of the three ESs in four years (Figure 2). The amount of soil conservation ranged from 0.30 to 3396.22 t·hm‒2·yr‒1, with an average of 227.98 t·hm‒2·yr‒1. The high-value regions were mainly spread over mountainous areas in western, northern and northeastern Beijing. The low-value areas were mainly distributed over the plains in the southeast. The results are consistent with those reported in a study by Zhou et al. (2010) that was conducted in the mountainous areas in Beijing. The main reason for these results is that large areas of forest and grassland are distributed in these mountainous areas, and the erosion resistance of the vegetation roots and litter reduced soil loss in these areas (Xiong et al., 2007).
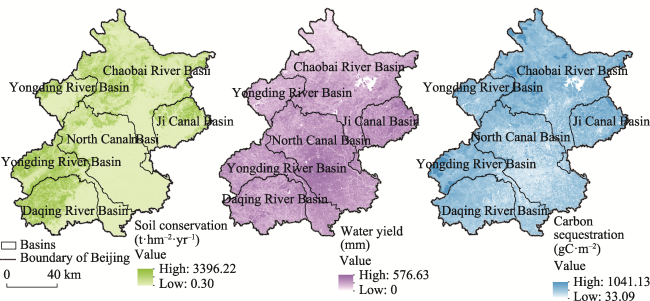
Figure 2 The spatial distribution of ecosystem services in Beijing
The range of the annual water yield in Beijing was 0-576.63 mm, with a mean of 238.63 mm. The simulation results of the InVEST model show that the total water yield in Beijing in 2015 was approximately 2.761 billion m3. This result was close to the number reported in the 2015 Beijing Water Resources Bulletin, which was 2.676 billion m3. Simultaneously, the simulation results in the five major river basins were similar to the statistics of the Beijing Water Authority. The spatial distribution of the water yield showed a gradual increase from the northwest to the southeast. The main reason is that the northwest part of Beijing consists of suburbs, while the southeast part is an urban area with a faster urbanization process. Temperature in the urban area is higher than that in the suburb, which is conducive to the strengthening and development of thermals. Tall buildings also promote airflow, favoring the formation and development of clouds and precipitation. Thus, there is more precipitation in the southeast. Simultaneously, urban ground surfaces are mostly hardened and impermeable. The annual evapotranspiration volume in the urban areas is greater than that in the natural underlying surfaces (Tang et al., 2013). Thus, the water yield in the urban areas of southeastern Beijing is larger.
The amount of carbon sequestration ranged from 33.09 to 1041.13 gC·m‒2, with a mean of 401.94 gC·m‒2. This range was mostly consistent with the carbon sequestration range (0.5‒880.7 gC·m‒2) in the Beijing-Tianjin-Hebei region estimated by Shen et al. (2020) using the CASA model. The spatial distribution of carbon sequestration was noticeably differentiated and consistent with the distribution of land use in the study area. Specifically, areas with densely distributed forests and grasslands had a larger amount of carbon sequestration, and areas such as urban construction sites and water bodies had a lower volume of carbon sequestration. This result is consistent with the spatial distribution of NPP in Beijing reported in a previous study (Yin et al., 2015).
3.1.2 Exploration of relationships between ecosystem services
The GWR coefficients between the three ESs, i.e., soil conservation, water yield, and carbon sequestration, in Beijing showed significant spatial heterogeneity (Figure 3). The spatial relationships of the three pairs of ESs demonstrated the coexistence of trade-offs and synergies. Figure 3 shows trade-offs between soil conservation and water yield and between water yield and carbon sequestration in the plain area. The main reason is that the type of land use in the plain area in Beijing is mainly urban construction land, with low levels of soil conservation and carbon sequestration but a large water yield. The trade-offs and synergies between soil conservation and water yield varied less in the percentage of the area in Beijing and its five river basins (Table 2), which indicated that the spatial coexistence of the trade-offs and synergies between soil conservation and water yield in the study area was evident. The spatial relationship between soil conservation and carbon sequestration in the study area was mainly synergistic and occurred in more than 62% of the area within Beijing and its basins, indicating a stable spatial relationship between these two ESs. Regarding Beijing overall, the spatial relationship between water yield and carbon sequestration was mainly a trade-off, which accounted for 64.94% of the total area of Beijing. However, in different basins, the spatial relationship between water yield and carbon sequestration showed obvious spatial variability. Specifically, the trade-offs and synergies between water yield and carbon sequestration occupied similar proportions in the Chaobai River Basin, while in the other four basins, the spatial relationship between the two ESs was mainly a trade-off.
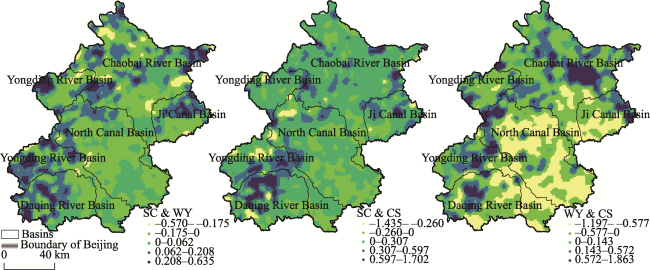
Figure 3 Spatial correlation coefficient between ecosystem services (SC: soil conservation; WY: water yield; CS: carbon sequestration)
Table 2 Area percentage of ecosystem services trade-offs and synergies
Regions Soil conservation & water yield (%) Soil conservation & carbon sequestration (%) Water yield & carbon sequestration (%)
Trade-offs Synergies Trade-offs Synergies Trade-offs Synergies
Beijing 45.61 54.39 22.79 77.21 64.94 35.06
North Canal Basin 56.31 43.69 37.06 62.94 82.88 17.12
Chaobai River Basin 44.59 55.41 14.25 85.75 49.03 50.97
Daqing River Basin 33.40 66.60 18.76 81.24 69.11 30.89
Ji Canal Basin 43.94 56.06 20.63 79.37 76.22 23.78
Yongding River Basin 41.68 58.32 21.50 78.50 60.43 39.57

3.2 Results of driving factor identification

The results of the factor detector showed that environmental factors had various degrees of influence on the spatial trade-offs and synergies between ESs in Beijing and its five major river basins (Figures 4 and 5). Since temperature affects evapotranspiration and vegetation growth, which in turn affects water yield and soil conservation, it had the greatest explanatory power in terms of the spatial trade-offs between soil conservation and water yield in Beijing, with a q value of 0.205. Elevation was the dominant influencing factor of the spatial synergy between these two ESs, and its q value was 0.259. The dominant factor influencing the spatial trade-offs between soil conservation and water yield in the North Canal Basin was relief amplitude, which had a q value of 0.268. Their spatial synergies were mainly influenced by elevation, potential evapotranspiration, temperature, relief amplitude and slope, and their explanatory powers were all greater than 45%. In the Ji Canal Basin, the main influencing factor of spatial trade-off/synergy between soil conservation and water yield was precipitation/relief amplitude, and its q value was 0.170/0.239. Compared with the other factors, elevation and temperature had a significant impact on the spatial trade-offs and synergies between soil conservation and water yield in the Yongding River Basin. The dominant factors influencing the spatial trade-offs and synergies between soil conservation and water yield in the Chaobai River Basin were both potential evapotranspiration. Elevation had the greatest explanatory power in terms of the spatial trade-offs and synergies within the Daqing River Basin.
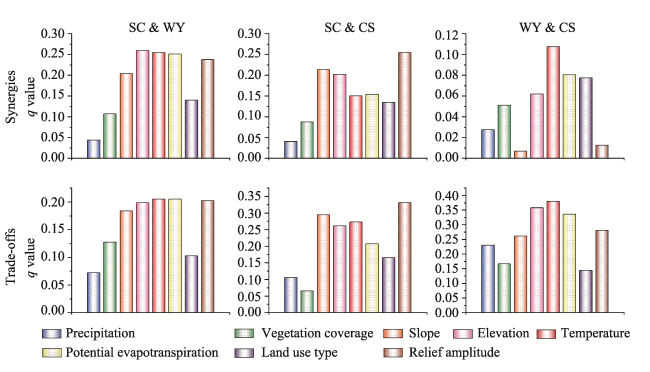
Figure 4 The q values of factors influencing the spatial trade-offs and synergies of ecosystem services in Beijing (SC: soil conservation; WY: water yield; CS: carbon sequestration)
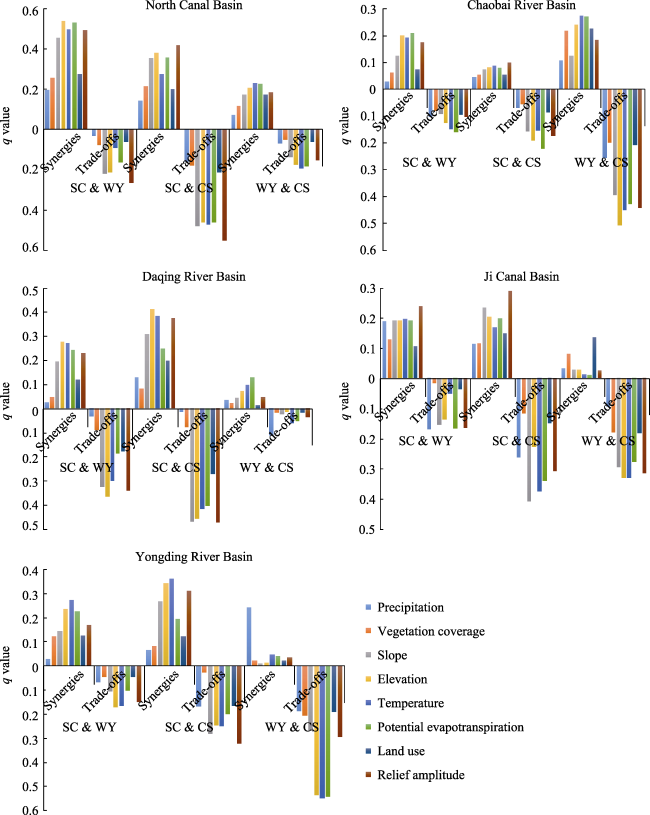
Figure 5 Statistics of q value affecting trade-offs and synergies within the five river basins of Beijing (SC: soil conservation; WY: water yield; CS: carbon sequestration)
Relief amplitude had the greatest explanatory power for the trade-offs and synergies between soil conservation and carbon sequestration in Beijing. It could explain 33.1% of the spatial trade-off and 25.4% of the spatial synergy. Slope had the second largest influence on the trade-offs and synergies. This result was closely related to the macro controlling effects of topographic factors on soil mineralization rates, solar radiation, the distribution of vegetation and other environmental conditions and ecological processes (Zhao et al., 2018). Relief amplitude, slope, temperature, elevation and potential evapotranspiration all had an explanatory power greater than 46% for the spatial trade-offs between soil conservation and carbon sequestration in the North Canal Basin. The q value of relief amplitude was the greatest, which was 0.555. Simultaneously, relief amplitude was the dominant influencing factor for the spatial synergies in the North Canal Basin. Potential evapotranspiration had the most significant effect on the spatial trade-offs between soil conservation and carbon sequestration in the Chaobai River Basin. Regarding the synergies, the eight environmental factors selected in this study all had a relatively small impact. In the Daqing River Basin, the impact of relief amplitude, slope, elevation, temperature and potential evapotranspiration on the spatial trade-offs between soil conservation and carbon sequestration were the most significant. The effect of elevation on their synergies was significantly distinguishable from that of the other factors, with a q value of 0.412. Slope had the greatest explanatory power on the spatial trade-offs between soil conservation and carbon sequestration in the Ji Canal Basin, while the relief amplitude had the greatest impact on their synergies. In the Yongding River Basin, the dominant factors affecting the spatial trade-offs/synergies between soil conservation and carbon sequestration was relief amplitude/temperature, and its q value was 0.325/0.361.
Regarding the spatial relationship between water yield and carbon sequestration, the eight environmental factors all had a strong explanatory power for the trade-offs. Among these factors, temperature could explain 38% of the spatial trade-offs. Simultaneously, temperature was the dominant factor influencing the spatial synergies between water yield and carbon sequestration. Other environmental factors had a lower explanatory power for this synergy, which might be due to the influence of temperature on evapotranspiration and the direct effect on vegetation growth. For the spatial trade-offs and synergies between water yield and carbon sequestration in the North Canal Basin, the top four explanatory factors were temperature, potential evapotranspiration, elevation and relief amplitude. In the Chaobai River Basin, the dominant factors affecting the spatial trade-offs and synergies between water yield and carbon sequestration were elevation and temperature, respectively, and their q values were 0.510 and 0.274, accordingly. The dominant factors influencing the spatial trade-offs and synergies between the water yield and carbon sequestration in the Daqing River Basin were precipitation and potential evapotranspiration, respectively, while the other factors all had a lower explanatory power. Temperature had the highest explanatory power on the spatial trade-offs between water yield and carbon sequestration in the Ji Canal Basin. In the Yongding River Basin, the effects of temperature, potential evapotranspiration and elevation on the spatial trade-offs between water yield and carbon sequestration were significantly higher than those of the other factors, with an explanatory power greater than 53%. For the synergies within this basin, precipitation was the dominant influencing factor, with a q value of 0.241.

3.3 Dominant interactions affecting trade-off and synergy

The results of the interaction detector showed that the interactions between influencing factors enhanced the explanatory power of the corresponding individual factors on the spatial trade-offs and synergies between ESs. The statistics of the top three interactions that had the strongest explanatory power were obtained, as shown in Tables 3 and 4. The spatial trade-offs and synergies between soil conservation and water yield were mostly affected by precipitation, temperature, potential evapotranspiration and elevation. Among these factors, the effects of precipitation were the most pronounced, and the three interactions between the influencing factors that had the highest explanatory power were all manifested as the superposition of precipitation and the other factors. In the North Canal Basin, the top three interaction between the influencing factors that had the strongest explanatory power on the spatial trade-offs between soil conservation and water yield were the interactions between relief amplitude and other influencing factors. This result is consistent with the result from the factor detector showing that the relief amplitude was the dominant factor in the North Canal Basin. The interaction factors of the spatial trade-off and synergy between soil conservation and water yield in the Chaobai River Basin were relatively consistent, and their interactions were all manifested in the superposition of precipitation and temperature, potential evapotranspiration, and elevation. The spatial synergy between soil conservation and water yield in the Daqing River Basin was influenced by the interactions of potential evapotranspiration with other factors. The top three interactions in the explanatory power for the spatial trade-offs between soil conservation and water yield in the Ji Canal Basin were all manifested in the interaction of potential evapotranspiration and other factors. Spatial synergies were manifested as the interactions between relief amplitude and other factors. Among these factors, the interaction between potential evapotranspiration and relief amplitude had a more pronounced effect on both spatial trade-offs and synergies, with explanatory powers of 34.9% and 35.6%, respectively. In the Yongding River Basin, precipitation was one of the dominant interaction factors influencing the trade-off between soil conservation and water yield. Temperature was one of the dominant interaction factors influencing spatial synergies. The interaction that had the strongest explanatory power was the superposition of precipitation and temperature, and the explanatory powers for spatial trade-offs and synergies were 36.1% and 35.2%, respectively.
Table 3 The dominant interaction factors affecting ESs trade-offs
Beijing North Canal Basin Chaobai River Basin Daqing River Basin Ji Canal Basin Yongding River Basin
Soil conservation & water yield Dominant interaction1 P∩T RA∩P P∩T E∩S PE∩S P∩T
q value 0.378 0.397 0.433 0.527 0.385 0.361
Dominant interaction2 P∩PE RA∩T P∩PE T∩P PE∩P P∩E
q value 0.358 0.367 0.395 0.510 0.367 0.300
Dominant interaction3 P∩E RA∩E P∩E E∩P PE∩RA P∩RA
q value 0.333 0.360 0.374 0.507 0.349 0.296
Soil conservation & carbon sequestration Dominant interaction1 P∩T RA∩LU P∩PE E∩S S∩T RA∩P
q value 0.452 0.646 0.540 0.676 0.651 0.524
Dominant interaction2 P∩RA RA∩E P∩T E∩VC S∩RA RA∩T
q value 0.436 0.641 0.511 0.621 0.610 0.516
Dominant interaction3 RA∩PE RA∩T P∩E RA∩T S∩PE S∩E
q value 0.422 0.623 0.483 0.616 0.603 0.502
Water yield & carbon sequestration Dominant interaction1 P∩T P∩T E∩P P∩PE P∩T P∩T
q value 0.457 0.304 0.574 0.287 0.453 0.654
Dominant interaction2 P∩E P∩PE E∩RA P∩T P∩E P∩PE
q value 0.423 0.276 0.536 0.248 0.425 0.644
Dominant interaction3 P∩PE P∩E E∩T P∩E E∩RA P∩E
q value 0.422 0.251 0.536 0.207 0.394 0.632

P: precipitation; E: elevation; T: temperature; PE: potential evapotranspiration; RA: relief amplitude; LU: land use; VC: vegetation coverage; S: slope

Table 4 The dominant interaction factors affecting ESs synergies
Beijing North Canal Basin Chaobai River Basin Daqing River Basin Ji Canal Basin Yongding River Basin
Soil conservation & water yield Dominant interaction1 P∩PE E∩RA P∩PE PE∩E RA∩PE T∩P
q value 0.327 0.579 0.366 0.358 0.356 0.352
Dominant interaction2 P∩T E∩T P∩E PE∩P RA∩P T∩RA
q value 0.319 0.577 0.357 0.353 0.347 0.313
Dominant interaction3 P∩E PE∩LU P∩T PE∩T RA∩E T∩E
q value 0.308 0.575 0.353 0.342 0.324 0.308
Soil conservation & carbon sequestration Dominant interaction1 P∩RA RA∩E P∩T PE∩E RA∩PE P∩T
q value 0.324 0.488 0.243 0.491 0.384 0.536
Dominant interaction2 P∩E RA∩P P∩PE PE∩T RA∩E P∩E
q value 0.318 0.487 0.239 0.488 0.343 0.498
Dominant interaction3 RA∩T RA∩T P∩E P∩T RA∩LU T∩RA
q value 0.301 0.468 0.202 0.474 0.342 0.480
Water yield & carbon sequestration Dominant interaction1 P∩T T∩RA P∩PE PE∩RA LU∩RA P∩T
q value 0.219 0.371 0.429 0.237 0.258 0.438
Dominant interaction2 P∩E T∩LU LU∩T PE∩T LU∩E P∩PE
q value 0.212 0.362 0.409 0.235 0.256 0.429
Dominant interaction3 T∩LU PE∩LU LU∩PE PE∩P LU∩T P∩E
q value 0.196 0.361 0.405 0.223 0.218 0.388

P: precipitation; E: elevation; T: temperature; PE: potential evapotranspiration; RA: relief amplitude; LU: land use; VC: vegetation coverage; S: slope

The results of the interaction detector showed that relief amplitude had a significant effect on the spatial relationship between soil conservation and carbon sequestration. The interaction between relief amplitude and precipitation explained 43.6% of the spatial trade-off and 32.4% of the spatial synergy. In the North Canal Basin, relief amplitude was one of the dominant interaction factors in the spatial trade-offs and synergies between soil conservation and carbon sequestration. The top three interactions that had the strongest explanatory power were all interactions of relief amplitude with other influencing factors. For the spatial trade-off and synergy between soil conservation and carbon sequestration in the Chaobai River Basin, the most explanatory interactions were those between precipitation and potential evapotranspiration, temperature, and elevation. In the Ji Canal Basin, slope was one of the dominant interaction factors in the spatial trade-offs between soil conservation and carbon sequestration. Relief amplitude was one of the dominant interaction factors in the spatial synergies. This result is consistent with the single-factor dominating effect shown by the factor detector. The spatial trade-offs and synergies between soil conservation and carbon sequestration in the Daqing River Basin and Yongding River Basin were influenced by multiple environmental factors, and the combinations of interactions showed significant differences.
Due to the decisive effects of precipitation on water yield and the significant controlling effects of the allocation of hydrothermal resources on the spatial distribution of vegetation, the first and second dominant interactions influencing the trade-offs and synergies between water yield and carbon sequestration manifested in the interactions between precipitation and temperature, as well as the interaction between precipitation and elevation. The third dominant interaction showed noticeable differences. Specifically, the interaction between precipitation and potential evapotranspiration had a great impact on the spatial trade-offs. The third dominant interaction of the spatial synergy was the superposition of temperature and land use. In the North Canal Basin, the Daqing River Basin and the Yongding River Basin, the interactions between factors influencing the spatial trade-offs between water yield and carbon sequestration manifested in the superposition of precipitation and temperature, potential evapotranspiration, and elevation. The interactions between influencing factors of the spatial synergies between water yield and carbon sequestration showed significant differences in different basins. Specifically, in the Ji Canal Basin, the interactions of influencing factors that had the strongest explanatory power on spatial synergies were the interactions of land use with relief amplitude, elevation, and temperature. The interactions of potential evapotranspiration with relief amplitude, temperature, and precipitation were the strongest for the spatial synergies in the Daqing River Basin. Precipitation was one of the dominant interaction factors influencing the spatial synergies in the Yongding River Basin.

4 Discussion

Topographic factors have macro controlling effects on the occurrence and development of surface processes. Topographic factors, such as relief amplitude, slope and elevation, had the most significant impact on the spatial relationship between soil conservation and carbon sequestration in Beijing and its five river basins, which might be due to the complexity of the topographic structure in areas with large amplitudes. The differences in the climate and elevation gradient further complicated the factors affecting the spatial relationship between soil conservation and carbon sequestration. The study by Jin (2001) showed that the steep slopes of the mountains in Beijing provided a driving force for soil loss. The distribution of vegetation and forest carbon density also showed a vertical pattern of regional differentiation with elevation changes (Xiao et al., 2014). Therefore, topographic factors influence the spatial distribution of ESs by affecting their substrate and thereby act on the spatial relationships between ESs. Regarding the spatial relationship between water yield and carbon sequestration in Beijing and its basins, temperature was the dominant factor influencing the spatial trade-offs and synergies between these two ESs, which is consistent with the result of Zhang et al. (2004), who showed that the relationship between plant growth and temperature was most closely related in Beijing. The results of this study also suggest that elevation was an important factor influencing the spatial relationship between soil conservation and water yield in Beijing and its basins. The stratification of elevation embodies the combined differences in climate, vegetation, and topography. On the one hand, there are large areas of forest in higher elevation areas in Beijing, and plant roots have a significant inhibitory effect on the process of soil erosion. On the other hand, the amount of water yield in forest ecosystems is reflected in the impact of forests on annual runoff. Experiments in some basins in China have suggested that the existence of forests will increase water yield (Zhou et al., 2001), which can explain why elevation had the most significant effect on the synergies between soil conservation and water yield to a certain extent.
The relationships between ESs exhibit regional differences (Bai et al., 2011). A clear difference was observed in the area proportions between ESs in different basins in Beijing. Specifically, the relationship between soil conservation and water yield in the North Canal Basin was largely a trade-off, while in Beijing and its four other basins, spatial synergies accounted for a greater proportion. In the Chaobai River Basin, the spatial trade-off and synergy between water yield and carbon sequestration accounted for nearly the same proportion, while in Beijing and its four other basins, the proportion of the spatial area of the trade-off was more than 60%. Differences in topology, climate conditions, basin characteristics and socioeconomic conditions in Beijing and its five major basins determine the heterogeneity of the landscape. For example, there are differences in the macro topography among the plain, low mountains, and high mountains. Climate conditions, such as temperature, precipitation and other conditions, vary significantly in the western and northern mountainous areas and in the central and eastern plain areas. Differences also exist in the geography of the basins, the distribution of water systems and the hydrological features. The socioeconomic development conditions of the 16 districts in Beijing all differ. Various factors resulted in strong spatial heterogeneity of ESs and their relationships in different basins. Consistency and differentiation coexisted in the influencing factors of trade-offs and synergies in different basins. In Beijing and four of the river basins (Chaobai River, Yongding River, Daqing River, and Ji Canal basins) where the spatial relationship between soil conservation and water yield was predominantly synergistic, the main influencing factor on this pair of ESs was elevation. In the Chaobai River Basin, where synergy and trade-off between water yield and carbon sequestration had similar area proportions, the dominant influencing factor of the trade-off between this pair of ESs was elevation. In Beijing and four other river basins, which are dominated by trade-offs, temperature had a strong impact. The difference is that the dominant factor influencing the synergistic relationship between soil conservation and carbon sequestration was relief amplitude in Beijing, the North Canal Basin, the Chaobai River Basin and the Ji Canal Basin, while elevation and temperature had the strongest explanatory power in the other two basins, respectively. Thus, based on the homogeneity of influencing factors among different basins, a citywide management approach can increase the synergies between ESs. In terms of differentiation, adaptive ecosystem management approaches can be applied to each basin to make management decisions based on specific locations.
Nature and socioeconomics are widely distributed in the geographical space. The spatial autocorrelation and heterogeneity corresponding to the gradual and abrupt changes both violate the basic hypothesis of independence and identical distributions in classical statistics (Wang et al., 2010). The GWR method considers local parameters in evaluating the spatial variation in the relationship between independent and dependent variables (Fotheringham et al., 2002). This method improves the reliability of the relationships among ESs by reducing the spatial autocorrelation of residuals (Zhang et al., 2005; Gao et al., 2012). The geographical detector is a method used to detect heterogeneity in the spatial strata of a feature and reveal the driving forces behind it. The independent variables are immune to collinearity (Wang and Xu, 2017). Therefore, the combination of the two approaches can effectively reduce the possible impact of information redundancy on the results in influencing factor detection. Furthermore, the spatial correlation coefficients of ESs calculated by GWR and the factors influencing trade-offs and synergies revealed by the geographical detector can both be characterized quantitatively, which can compensate for the shortcomings in trade-offs and synergies evaluated only by calculating the extent of interannual changes in ESs.
By focusing on the spatial relationship among ESs, this study conducted quantitative attribution of the spatial trade-offs and synergies of multiple ESs. However, the trade-offs between ESs can also be studied from the aspects of time and reversibility. Therefore, future research needs to focus on spatial and dynamic trade-offs and synergies and identify the dominant driving factors of the spatiotemporal differences in the relationships between ESs. Regarding the data, this study selected a 9-m resolution DEM data for the calculation of LS factors in the RUSLE model. The 30-m resolution NDVI data were applied to compute the C factor and APAR factor in the RUSLE model and the CASA model, respectively. Land use data at a 15 m resolution were applied to the assignment of the P factor in the RUSLE model and the input of land use/land cover in the InVEST model. The abovementioned high-resolution basic data improved the accuracy of ESs simulation. However, because ecological processes are very complex and involve many parameters, improving the accuracy of the parameter data and the localization of the parameters remain focal concerns in research. Future research should also optimize the simulation process in conjunction with conducting field experiments and micro-monitoring. For example, the field monitoring of the C and P factors in the study area can be enhanced to make them more consistent with the actual ecological processes in cities and basins. Simultaneously, this study identified the factors influencing ES trade-offs and synergies at the basin scale and analyzed the spatial patterns, relationships, differences and similarities across the factors that influence ESs in different basins. Research has shown that this method is suitable for the quantitative identification of factors that influence soil and water retention in different ecological red line areas and the attribution of soil erosion in different geomorphological and lithological zones (Gao et al., 2020; Gao et al., 2018). Future extension studies can apply this research methodology to different climatic zones and administrative areas to achieve a balance between the supply of and demand for regional ESs. Furthermore, in studies on the scale effect of ES trade-offs and synergies, in addition to a comparative analysis on the same scale, cross-scale research based on small, medium and large scales and a comprehensive analysis of multiscale synergies and trade-offs among ESs are needed.

5 Conclusions

Aiming at the coordinated improvement of multiple ESs, which have been highlighted by many policies in Beijing, the GWR model in this study was used to reveal trade-offs and synergies among three ESs, namely, soil conservation, water yield and carbon sequestration, in Beijing and its five river basins. The geographical detector was used to analyze the dominant factors and their interactions that affect the spatial trade-offs and synergies of the three ESs. The main conclusions are as follows:
(1) There was a clear spatial trade-off between soil conservation and water yield, as well as between water yield and carbon sequestration in the plain area of Beijing. Soil conservation and carbon sequestration were manifested in a clear spatial synergy in Beijing and its five river basins, and the proportion of the synergy area was greater than 62%.
(2) For the spatial relationship between soil conservation and water yield in Beijing, temperature was the dominant factor influencing the trade-off, and elevation was the dominant factor influencing the synergy. Influenced by geographic location and natural conditions, the dominant factor influencing the spatial relationship between soil conservation and water yield showed distinct spatial heterogeneity among different basins. Therefore, the development of water and soil conservation measures in the five river basins in Beijing and the implementation of the Beijing Ecological Conservation Red Line should comprehensively consider the internal characteristics of basins and the differences in influencing factors.
(3) Topographic factors were the dominant factors in the spatial relationships between soil conservation and carbon sequestration in Beijing and its five river basins. The interaction of precipitation and relief amplitude could explain 43.6% of the trade-off and 32.4% of the synergy between soil conservation and carbon sequestration. Measures such as the prohibition of steep-slope farming, Grain to Green, and plain of forestation can effectively combat soil loss and protect and nurture forests and grasslands.
(4) Temperature had the most significant effect on the spatial relationship between water yield and carbon sequestration in Beijing and its five river basins. The interaction of precipitation and temperature and the interaction of precipitation and elevation were the dominant interactions influencing the spatial relationship between water yield and carbon sequestration in Beijing. Thus, priority should be given to the impact of hydrothermal conditions on ESs in measuring the combined benefits of water yield and carbon sequestration.
[1]
Bai Y, Ouyang Z Y, Zheng H et al., 2012. Modeling soil conservation, water conservation and their tradeoffs: A case study in Beijing. Journal of Environmental Sciences, 24(3):419-426.

[2]
Bai Y, Zhuang C W, Ouyang Z Y et al., 2011. Spatial characteristics between biodiversity and ecosystem services in a human-dominated watershed. Ecological Complexity, 8(2):177-183.

DOI

[3]
Bennett E M, Peterson G D, Gordon L J, 2009. Understanding relationships among multiple ecosystem services. Ecology Letters, 12:1394-1404.

DOI PMID

[4]
Brunsdon C, Fotheringham A S, Charlton M, 1996. Geographically weighted regression: A method for exploring spatial nonstationarity. Geographical Analysis, 28(4):281-298.

DOI

[5]
Brunsdon C, Fotheringham A S, Charlton M, 1998. Geographically weighted regression: Modelling spatial non-stationarity. Journal of the Royal Statistical Society. Series D: The Statistician, 47(3):431-443.

[6]
Crabtree R, Potter C, Mullen R et al., 2009. A modeling and spatio-temporal analysis framework for monitoring environmental change using NPP as an ecosystem indicator. Remote Sensing of Environment, 113(7):1486-1496.

DOI

[7]
Dade M C, Mitchell M G E, McAlpine C A et al., 2019. Assessing ecosystem service trade-offs and synergies: The need for a more mechanistic approach. AMBIO A Journal of the Human Environment, 48:1116-1128.

DOI

[8]
Dai E F, Wang X L, Zhu J J et al., 2016. Methods, tools and research framework of ecosystem services trade-offs. Geographical Research, 35(6):1005-1016. (in Chinese)

[9]
Daily G C, 1997. Nature’s Services: Societal Dependence on Natural Ecosystems. Washington DC: Island Press.

[10]
Egoh B N, Reyers B, Rouget M et al., 2011. Identifying priority areas for ecosystem service management in South African grasslands. Journal of Environmental Management, 92(6):1642-1650.

DOI PMID

[11]
Feng T, Chen H S, Polyakov V O et al., 2016. Soil erosion rates in two karst peak-cluster depression basins of northwest Guangxi, China: Comparison of the RUSLE model with 137Cs measurements. Geomorphology, 253:217-224.

DOI

[12]
Fotheringham A S, Brundson C, Charlton M, 2002. Geographically Weighted Regression: The Analysis of Spatially Varying Relationships. New York: Wiley.

[13]
Fu B P, 1981. On the calculation of the evaporation from land surface. Chinese Journal of Atmospheric Sciences, 5:23-31. (in Chinese)

DOI

[14]
Gao J B, Jiang Y, Wang H et al., 2020. Identification of dominant factors affecting soil erosion and water yield within ecological red line areas. Remote Sensing, 12(3):399.

DOI

[15]
Gao J B, Li S C, Zhao Z Q et al., 2012. Investigating spatial variation in the relationships between NDVI and environmental factors at multi-scales: A case study of Guizhou Karst Plateau, China. International Journal of Remote Sensing, 33(7):2112-2129.

DOI

[16]
Gao J B, Wang H, Zuo L Y, 2018. Spatial gradient and quantitative attribution of karst soil erosion in Southwest China. Environmental Monitoring and Assessment, 190(12):730.

DOI PMID

[17]
Holling C S, Meffe G K, 1996. Command and control and the pathology of natural resource management. Conservation Biology, 10(2):328-337.

DOI

[18]
Huang J C, Fang C L, 2003. Analysis of coupling mechanism and rules between urbanization and eco-environment. Geographical Research, 22(2):211-220. (in Chinese)

[19]
Hubacek K, Guan D, Barrett J et al., 2009. Environmental implications of urbanization and lifestyle change in China: Ecological and water footprints. Journal of Cleaner Production, 17(14):1241-1248.

DOI

[20]
Jin H C, 2001. Soil and water loss in Beijing and its prevention. Research of Soil and Water Conservation, 8(4):154-157. (in Chinese)

[21]
Leh M D K, Matlock M D, Cummings E C et al., 2013. Quantifying and mapping multiple ecosystem services change in West Africa. Agriculture Ecosystem and Environment, 165:6-18.

DOI

[22]
Li S C, Zhang C Y, Liu J L et al., 2013. The tradeoffs and synergies of ecosystem services: Research progress, development trend, and themes of geography. Geographical Research, 32(8):1379-1390. (in Chinese)

[23]
Liu Y, Bi J, Lv J S, 2019. Classification of ecosystem services and a reclassification framework of watershed ecosystem services. Resources Science, 41(7):1189-1200. (in Chinese)

DOI

[24]
Markus P, 2002. Technical progress, structural change, and the environment Kuznets curve. Ecological Economics, 42(3):381-389.

DOI

[25]
Mohamed M A, Babiker I S, Chen Z M et al., 2004. The role of climate variability in the inter-annual variation of terrestrial net primary production (NPP). Science of the Total Environment, 332(1):123-137.

DOI

[26]
Peng J, Hu X X, Zhao M Y et al., 2017. Research progress on ecosystem services trade-offs: From cognition to decision-making. Acta Geographica Sinica, 72(6):960-973. (in Chinese)

DOI

[27]
Rodríguez J P, Beard T D J, Bennett E M et al., 2005. Trade-offs across space, time, and ecosystem services. Ecology and Society, 11(1):709-723.

[28]
Sharp R, Tallis H T, Ricketts T et al., 2016. InVEST + VERSION + User’s Guide. The Natural Capital Project, Stanford University, University of Minnesota, The Nature Conservancy, and World Wildlife Fund. Stanford (CA): Stanford University.

[29]
Shen J S, Li S C, Liang Z et al., 2020. Exploring the heterogeneity and nonlinearity of trade-offs and synergies among ecosystem services bundles in the Beijing-Tianjin-Hebei urban agglomeration. Ecosystem Services, 43:101103.

DOI

[30]
Su C H, Fu B J, 2013. Evolution of ecosystem services in the Chinese Loess Plateau under climatic and land use changes. Global and Planetary Change, 101:119-128.

DOI

[31]
Tang T, Ran S H, Tan M H, 2013. Urbanization and its impact on the evapotranspiration in Beijing-Tianjin-Tangshan area. Journal of Geo-Information Science, 15(2):233-240. (in Chinese)

DOI

[32]
Wang J F, Hu Y, 2012. Environmental health risk detection with GeogDetector. Environmental Modelling and Software, 33:114-115.

DOI

[33]
Wang J F, Li X H, Christakos G et al., 2010. Geographical detectors-based health risk assessment and its application in the neural tube defects study of the Heshun region, China. International Journal of Geographical Information Science, 24(1):107-127.

[34]
Wang J F, Xu C D, 2017. Geodetector: Principle and prospective. Acta Geographica Sinica, 72(1):116-134. (in Chinese)

[35]
Xiao Y, An K, Yang Y et al., 2014. Forest carbon storage trends along altitudinal gradients in Beijing, China. Journal of Resources and Ecology, 5(2):148-156.

[36]
Xiong Y M, Xia H P, Li Z A et al., 2007. Effects and mechanisms of plant roots on slope reinforcement and soil erosion resistance: A research review. Chinese Journal of Applied Ecology, 18(4):193-202. (in Chinese)

[37]
Yin K, Tian Y C, Yuan C et al., 2015. NPP spatial and temporal pattern of vegetation in Beijing and its factor explanation based on CASA model. Remote Sensing for Land and Resources, 27(1):133-139. (in Chinese)

[38]
Zhang L, Hickel K, Dawes W R et al., 2004. A rational function approach for estimating mean annual evapotranspiration. Water Resources Research, 40:89-97.

[39]
Zhang L J, Gove J H, Heath L S, 2005. Spatial residual analysis of six modeling techniques. Ecological Modelling, 186(2):154-177.

DOI

[40]
Zhang X X, Zheng J Y, Ge Q S et al., 2004. Relationships between climate change and vegetation in Beijing using remote sensed data and phenological data. Journal of Plant Ecology, 28(4):499-506. (in Chinese)

[41]
Zhao W W, Liu Y, Feng Q et al., 2018. Ecosystem services for coupled human and environment systems. Progress in Geography, 37(1):139-151. (in Chinese)

DOI

[42]
Zheng H, Li Y F, Ouyang Z Y et al., 2013. Progress and perspectives of ecosystem services management. Acta Ecologica Sinica, 33(3):702-710. (in Chinese)

DOI

[43]
Zhou B, Yu X X, Chen L H et al., 2010. Soil erosion simulation in mountain areas of Beijing based on InVEST model. Research of Soil and Water Conservation, 17(6):9-13. (in Chinese)

[44]
Zhou X F, Zhao H X, Sun H Z, 2001. Proper assessment for forest hydrological effect. Journal of Natural Resources, 16(5):420-426. (in Chinese)

DOI

Outlines

/