
Journal of Geographical Sciences >
Dynamic transition mechanism analysis of the impact of energy development on urbanization in Central Asia
|
Zhou Yannan (1992–), PhD Candidate, specialized in energy geography and regional studies.E-mail: zhouyn.20b@igsnrr.ac.cn |
Received date: 2020-03-19
Accepted date: 2020-07-22
Online published: 2021-01-25
Supported by
Priority Research of the CAS(XDA20040400)
National Natural Science Foundation of China(41871118)
National Natural Science Foundation of China(42022007)
Copyright
Energy development has a significant impact on urbanization. This study employs the entropy method to evaluate the level of urbanization in Central Asia and further analyzes the possible dynamic transition mechanisms of the impact of energy development (characterized by energy development scale, energy trade, energy consumption, and energy endowment) on urbanization using the Panel Smooth Transition Regression model (PSTR). The results demonstrate that energy development in this region is characterized by “three highs and one low”, namely, high production volume, high export volume, high endowment, and low self-consumption, and plays a crucial role in the progress of urbanization. A nonlinear relationship is found to exist between energy development and comprehensive urbanization in the transition economies of Central Asia. Generally speaking, as energy development continues to expand, its impact on urbanization in this region has shifted from constraint to promotion, with the latter gradually tending to flatten out. Energy development characterized by energy development scale, energy consumption, and energy trade can prove the point, whose threshold is 1.47 million tons oil equivalent (Mtoe), 0.29 tons oil equivalent (toe) per capita, and 20.95 Mtoe, respectively. However, not all energy development models exhibit this behavior. Energy development characterized by energy endowment is such a case where the positive effect of it on comprehensive urbanization will be restrained when it exceeds 3.18. These findings can aid decision makers in seeking a better energy development model to promote the sustainable development of urbanization in Central Asia, avoiding energy resources waste and disorderly development.
ZHOU Yannan , YANG Yu , SONG Zhouying , HE Ze , XIA Siyou , REN Yawen . Dynamic transition mechanism analysis of the impact of energy development on urbanization in Central Asia[J]. Journal of Geographical Sciences, 2020 , 30(11) : 1825 -1848 . DOI: 10.1007/s11442-020-1814-8C
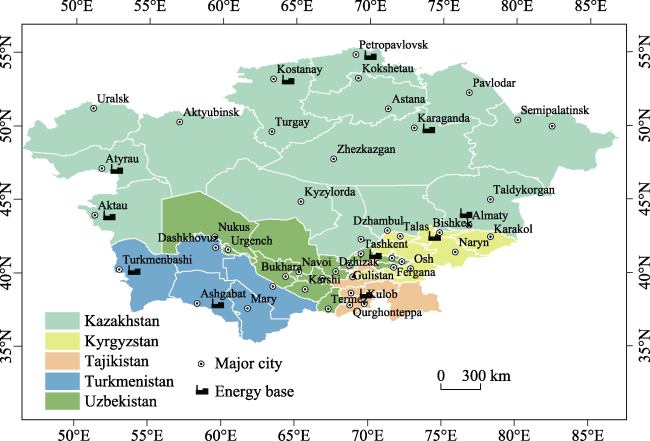
Figure 1 The Central Asian region |
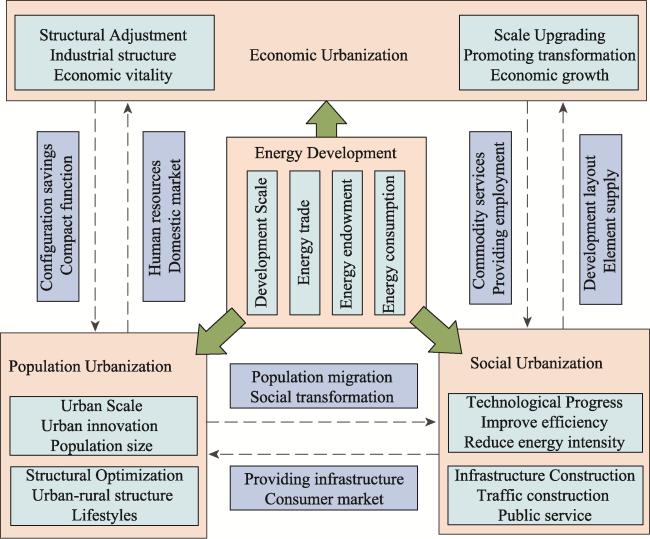
Figure 2 Transmission mechanism from energy development to urbanization |
Table 1 Central Asia’s comprehensive urbanization indicator system |
| Target level | Standard level | Index level | Definition | Unit |
|---|---|---|---|---|
| Comprehensive urbanization | Population urbanization | Urban population | Scale of people living in urban areas | Person |
| Urban population rate | Urban population as percentage of total population | % | ||
| Urban population growth | Growth rate of urban population | % | ||
| Economic urbanization | Industrial structure | Share of secondary and tertiary industry added value over total GDP | % | |
| GDP per capita | Gross domestic product divided by population | Constant 2010 USD | ||
| GDP growth | Growth rate of GDP | % | ||
| Social urbanization | Transportation development | Energy consumption of transport | Mtoe | |
| Employment structure | Percentage of population employed in secondary and tertiary industries | % | ||
| Technology level | Economic output (GDP) per energy consumption | Ten thousand 2010 USD per toe |
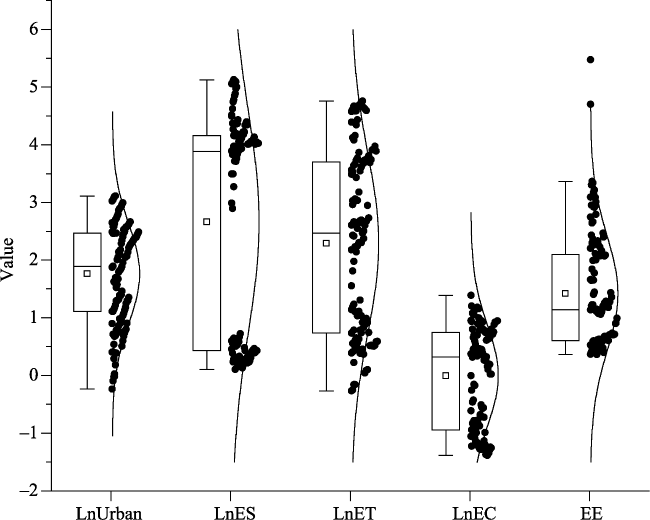
Figure 3 Statistical box chart of data |
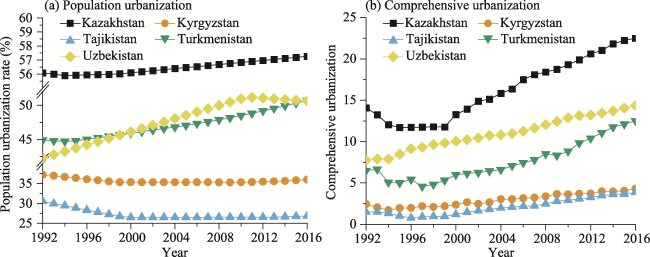
Figure 4 Changes in population urbanization rate and comprehensive urbanization in Central Asia during 1992-2016 |
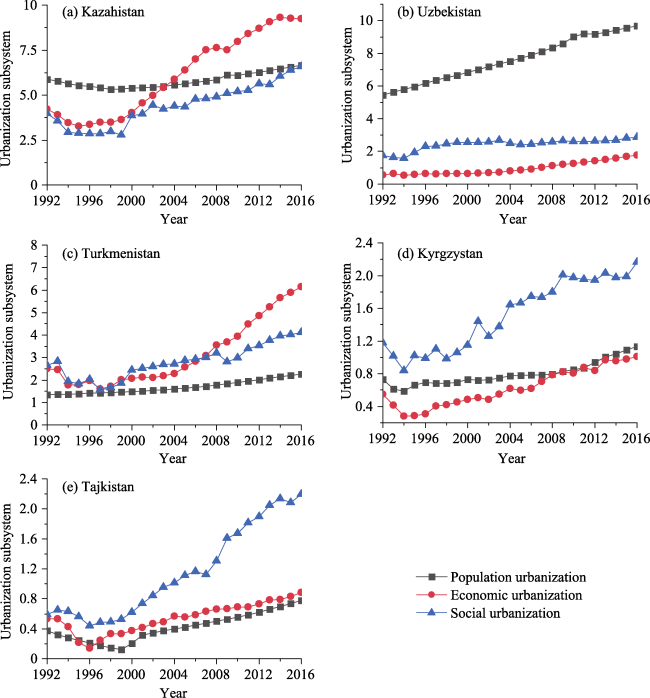
Figure 5 Evolution of three subsystems (population, economy, and society) of comprehensive urbanization in Central Asia during 1992-2016 |
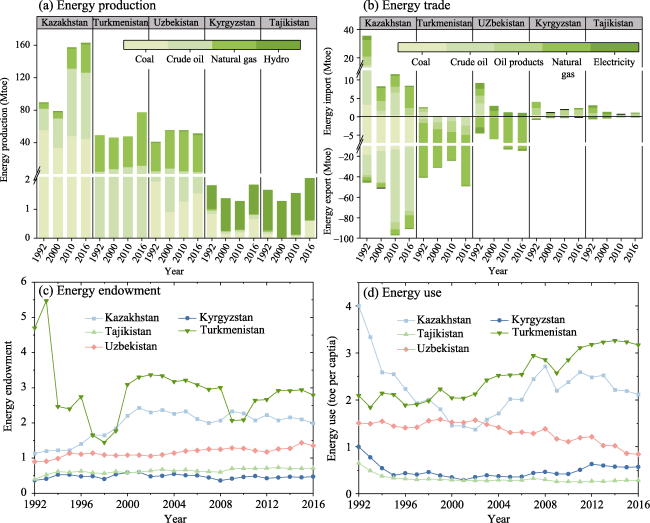
Figure 6 Energy development during 1992-2016 in Central Asia |
Table 2 LMf tests for determining the remaining nonlinearity of the number of location parameters |
| Model Number of location parameters | Energy development scale | Energy trade | Energy consumption | Energy endowment | ||||
|---|---|---|---|---|---|---|---|---|
| m = 1 | m = 2 | m = 1 | m = 2 | m = 1 | m = 2 | m = 1 | m = 2 | |
| H0: r = 0 vs H1: r = 1 | 11.75 | 7.43 | 35.37 | 20.79 | 12.07 | 5.98 | 15.87 | 11.46 |
| (0.00) | (0.00) | (0.00) | (0.00) | (0.00) | (0.00) | (0.00) | (0.00) | |
| H0: r = 1 vs H1: r = 2 | 0.03 | 1.92 | 6.35 | 3.89 | 1.20 | 9.93 | 11.22 | 0.00 |
| (0.85) | (0.15) | (0.01) | (0.02) | (0.27) | (0.00) | (0.00) | (0.99) | |
| H0: r = 2 vs H1: r = 3 | — | — | 0.02 | 0.44 | — | 0.01 | 0.63 | — |
| — | — | (0.88) | (0.64) | — | (0.99) | (0.43) | — | |
| AIC | -3.02 | -2.98 | -2.83 | -2.63 | -2.53 | -2.35 | -2.83 | -2.43 |
| Schwarz | -2.93 | -2.87 | -2.66 | -2.43 | -2.44 | -2.43 | -2.67 | -2.32 |
Notes: The corresponding p-values are reported in parentheses. |
Table 3 Parameter estimates for the final PSTR model |
| Model (m, r*) | Energy development scale (1,1) | Energy trade (1,2) | Energy consumption (1,1) | Energy endowment (1,2) |
|---|---|---|---|---|
| β0 | -0.74** | -0.66*** | -0.43*** | -1.62*** |
| (-2.18) | (-4.48) | (-3.55) | (-6.38) | |
| β1 | 1.39*** | 0.86*** | 0.68*** | 2.06*** |
| (4.21) | (6.30) | (5.87) | (8.57) | |
| β2 | — | -0.59*** | — | -0.26*** |
| — | (-7.06) | — | (-6.29) | |
| γ1 | 4047.80 | 33.52 | 47.17 | 33.36 |
| γ2 | — | -1.04 | — | 8.76 |
| c1 | 0.386 | 0.77 | -1.24 | 0.66 |
| c2 | — | 3.04 | — | 3.18 |
Notes: The corresponding t-statistics are reported in parentheses. ** and *** indicate data that have passed significance tests at confidence levels 1% and 5%, respectively. |
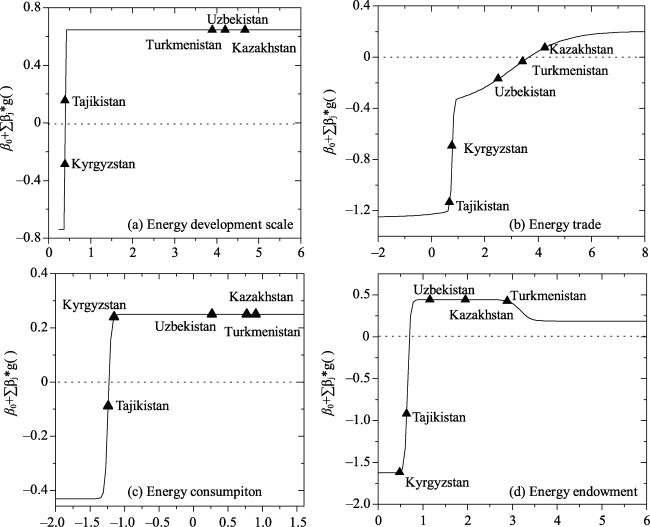
Figure 7 Estimated relationship coefficients between energy development and urbanization in Central Asia |
| 1 |
|
| 2 |
|
| 3 |
Asian Development Bank (ADB), 2018. Key Indicators for Asia and the Pacific 2018. Mandaluyong: Asian Development Bank.
|
| 4 |
Asian Development Bank Institute(ADBI), 2014. Connecting Central Asia with Economic Centers. Washington: Brookings Institution Press.
|
| 5 |
|
| 6 |
|
| 7 |
|
| 8 |
|
| 9 |
|
| 10 |
|
| 11 |
|
| 12 |
|
| 13 |
|
| 14 |
|
| 15 |
|
| 16 |
|
| 17 |
|
| 18 |
|
| 19 |
|
| 20 |
|
| 21 |
|
| 22 |
|
| 23 |
|
| 24 |
|
| 25 |
Economic and Social Commission for Asia and the Pacific(ESCAP), 2013. Urbanization in Central Asia: Challenge, Issues and Prospects. Tashkent: Center for Economic Research.
|
| 26 |
|
| 27 |
|
| 28 |
|
| 29 |
|
| 30 |
|
| 31 |
|
| 32 |
|
| 33 |
|
| 34 |
|
| 35 |
|
| 36 |
|
| 37 |
|
| 38 |
|
| 39 |
|
| 40 |
|
| 41 |
|
| 42 |
Ministry of Commerce of the People’s Republic of China (MOFCOM), 2016. Raw Material Countries Need to Adapt to Crisis II: Kazakhstan. http://kz.mofcom.gov.cn/article/ztdy/201604/20160401307788.shtml.
|
| 43 |
|
| 44 |
|
| 45 |
|
| 46 |
|
| 47 |
|
| 48 |
|
| 49 |
|
| 50 |
The World Bank, 2019. World Development Indicators (WDI). https://databank.worldbank.org/, accessed 2019-08-10.
|
| 51 |
The International Energy Agency(IEA), 2019. World Energy Balances. https://www.iea.org/statistics/, accessed 2019-08-10.
|
| 52 |
|
| 53 |
United Nations Conference on Trade and Development (UNCTD), 2011. Economic development in Africa: Foster industrial development in Africa in the new global environment: Report 2011. New York: UNCTD.
|
| 54 |
|
| 55 |
|
| 56 |
|
| 57 |
|
| 58 |
|
| 59 |
|
| 60 |
|
| 61 |
|
| 62 |
|
| 63 |
|
| 64 |
|
| 65 |
|
| 66 |
|
/
| 〈 |
|
〉 |