
Journal of Geographical Sciences >
Exploring temporal heterogeneity in an intercity travel network: A comparative study between weekdays and holidays in China
|
Li Tao, PhD and Associate Professor, specialized in transport geography. E-mail: taoli-2008@163.com |
Received date: 2020-09-02
Accepted date: 2020-10-30
Online published: 2021-02-25
Supported by
National Natural Science Foundation of China(41501120)
National Natural Science Foundation of China(41722103)
The Fundamental Research Funds for the Central Universities(18SZYB01)
China Postdoctoral Science Foundation(2020M670429)
Copyright
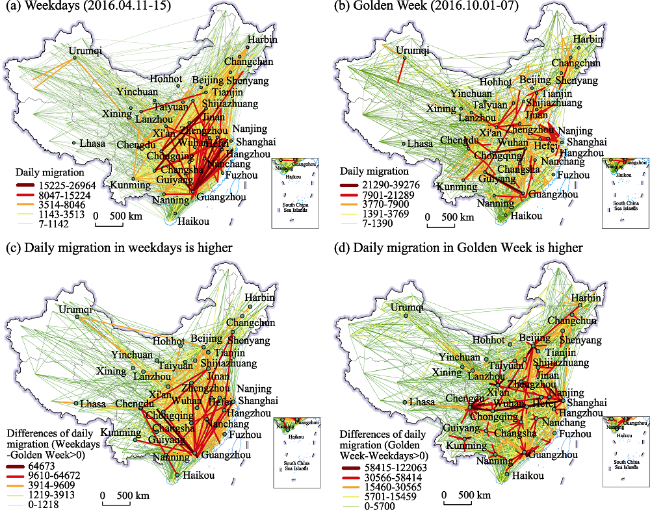
A largely unexplored application of “Big Data” in urban contexts is using human mobility data to study temporal heterogeneity in intercity travel networks. Hence, this paper explores China’s intercity travel patterns and their dynamics, with a comparison between weekdays and holidays, to contribute to our understanding of these phenomena. Using passenger travel data inferred from Tencent Location Big Data during weekdays (April 11-15, 2016) and National Golden Week (October 1-7, 2016), we compare the spatial patterns of Chinese intercity travel on weekdays and during Golden Week. The results show that the average daily intercity travel during Golden Week is significantly higher than that during weekdays, but the travel distance and degree of network clustering are significantly lower. This indicates temporal heterogeneity in mapping the intercity travel network. On weekdays, the three major cities of Beijing, Shanghai, and Guangzhou take prominent core positions, while cities that are tourism destinations or transportation hubs are more attractive during Golden Week. The reasons behind these findings can be explained by geographical proximity, administrative division (proximity of cultural and policy systems), travel distance, and travel purposes.
Key words: big data; weekdays; National Golden Week; human mobility; travel time heterogeneity; China
LI Tao , WANG Jiaoe , HUANG Jie , GAO Xingchuan . Exploring temporal heterogeneity in an intercity travel network: A comparative study between weekdays and holidays in China[J]. Journal of Geographical Sciences, 2020 , 30(12) : 1943 -1962 . DOI: 10.1007/s11442-020-1821-9
Table 1 Descriptive statistics of intercity travel networks for weekdays and Golden Week |
| Periods | Number of nodes | Number of edges | Total linked value | Average | Maximum | Minimum | CV |
|---|---|---|---|---|---|---|---|
| Weekdays | 362 | 8430 | 34 817 749 | 4130 | 191 590 | 7 | 2.22 |
| Golden Week | 362 | 8588 | 72 681 843 | 8463 | 263 724 | 7 | 1.94 |
Figure 1 Differences in intercity travel networks between weekdays and Golden Week |
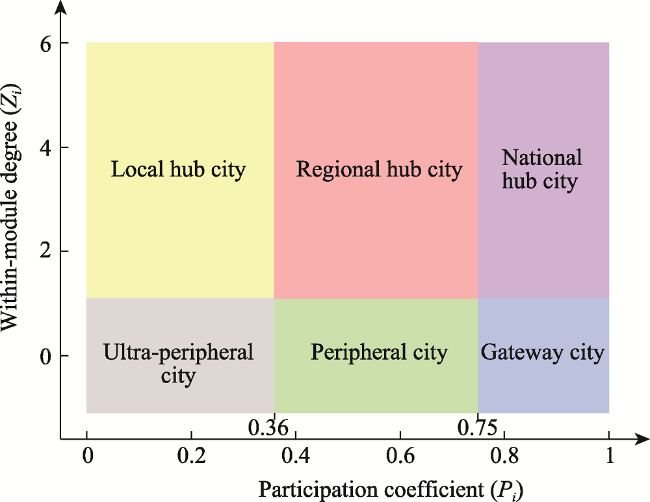
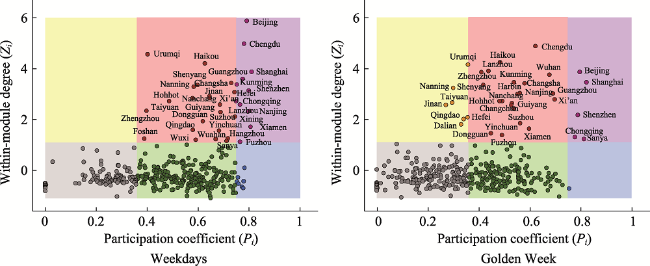
Figure 2 Diagram of city roles based on the method of the intra-inter group importance parameter |
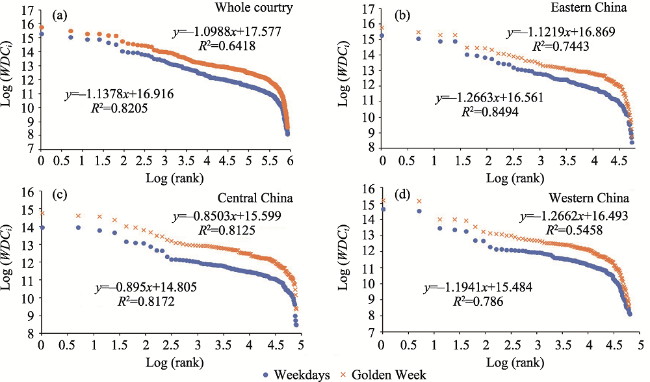
Figure 3 Rank-size distribution of WDCi of intercity travel network for weekdays and Golden Week |
Table 2 Statistical characteristics of intercity travel network for weekdays and Golden Week |
| Region | Period | Zipf | R2 | WDCi | DITi | ODIc |
|---|---|---|---|---|---|---|
| Whole country | Weekdays | 1.1378 | 0.8205 | 185 200 | 3.91 | 0.84 |
| Golden Week | 1.0988 | 0.6418 | 386 605 | 5.09 | 0.88 | |
| Eastern China | Weekdays | 1.2663 | 0.8494 | 305 006 | 6.48 | 0.80 |
| Golden Week | 1.1219 | 0.7443 | 581 193 | 7.67 | 0.85 | |
| Central China | Weekdays | 0.8950 | 0.8172 | 130 740 | 2.72 | 0.89 |
| Golden Week | 0.8503 | 0.8125 | 322 530 | 4.21 | 0.91 | |
| Western China | Weekdays | 1.1941 | 0.7860 | 126 287 | 2.65 | 0.79 |
| Golden Week | 1.2662 | 0.7458 | 265 015 | 3.47 | 0.83 |
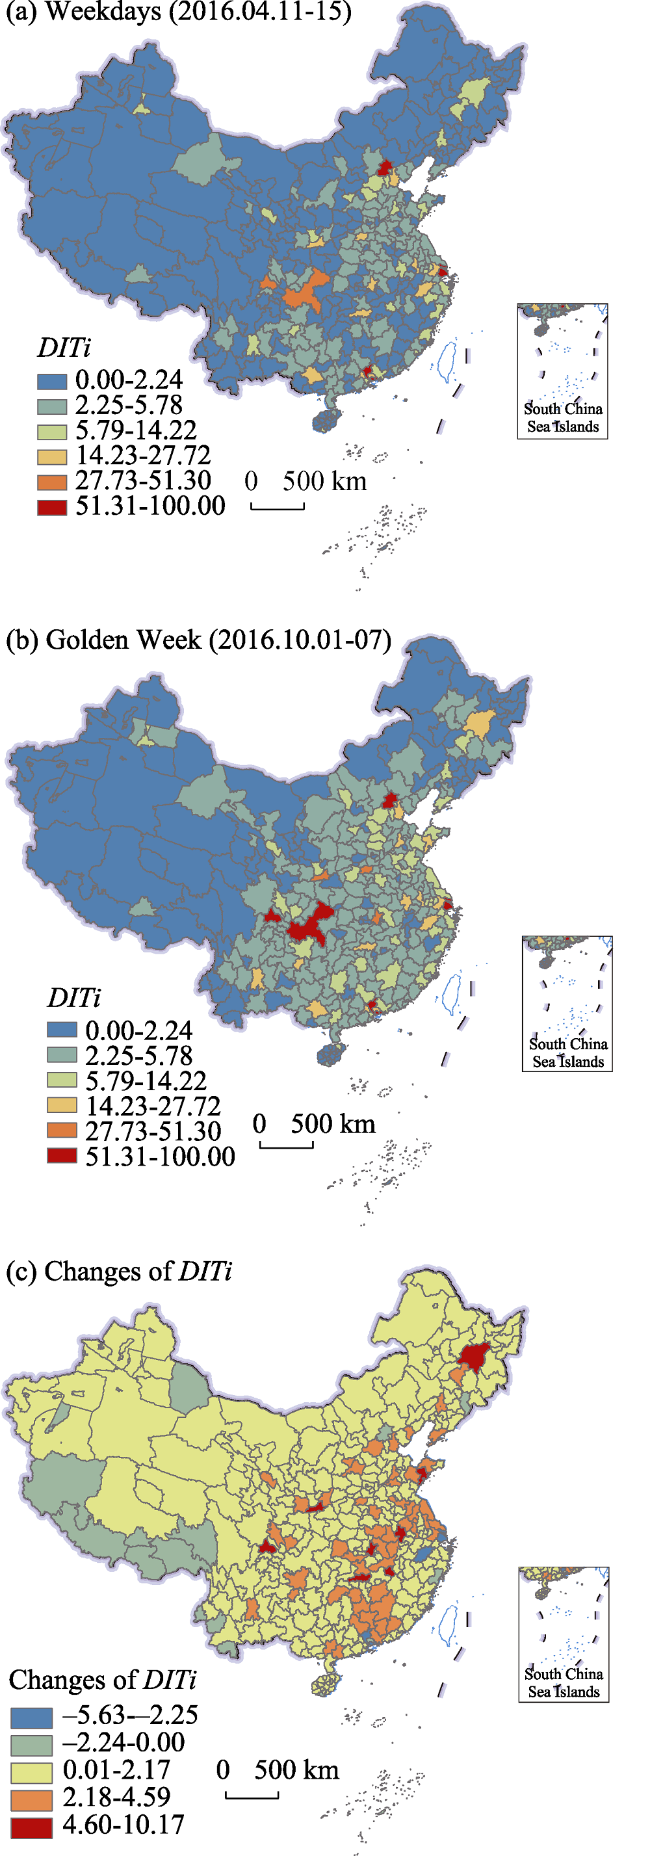
Figure 4 Spatial distribution of DITi and its absolute changes for weekdays and Golden Week |
Table 3 Statistical characteristics of the DITi values and their absolute changes for the two periods |
| Rank | DITi | Absolute change | ||||
|---|---|---|---|---|---|---|
| Weekdays | DITi | Golden Week | DITi | Golden Week-Weekdays | ||
| 1 | Beijing | 100.00 | Beijing | 100.00 | Wuhan | 10.17 |
| 2 | Shanghai | 78.19 | Shanghai | 75.13 | Chengdu | 10.06 |
| 3 | Shenzhen | 66.88 | Shenzhen | 61.44 | Xi’an | 8.57 |
| 4 | Guangzhou | 66.65 | Guangzhou | 61.02 | Changsha | 5.44 |
| 5 | Chongqing | 51.30 | Chengdu | 54.94 | Qingdao | 5.42 |
| 6 | Chengdu | 44.88 | Chongqing | 52.50 | Harbin | 5.31 |
| 7 | Dongguan | 27.72 | Hangzhou | 35.20 | Hefei | 5.27 |
| 8 | Hangzhou | 25.82 | Xi’an | 29.75 | Nanchang | 5.22 |
| 9 | Zhengzhou | 25.10 | Zhengzhou | 28.85 | Suzhou | 4.59 |
| 10 | Wuhan | 25.03 | Wuhan | 26.78 | Nanjing | 4.35 |
| 11 | Nanjing | 22.43 | Dongguan | 26.39 | Ganzhou | 4.11 |
| 12 | Xi’an | 21.18 | Suzhou | 25.36 | Huizhou | 4.07 |
| 13 | Suzhou | 20.77 | Changsha | 23.94 | Dalian | 3.98 |
| 14 | Changsha | 18.50 | Nanjing | 23.57 | Zhengzhou | 3.75 |
| 15 | Foshan | 15.91 | Tianjin | 18.52 | Hengyang | 3.68 |
| 16 | Nanning | 15.24 | Foshan | 17.87 | Shenyang | 3.64 |
| 17 | Tianjin | 15.20 | Kunming | 16.60 | Yantai | 3.53 |
| 18 | Jinan | 14.22 | Jinan | 16.59 | Yancheng | 3.44 |
| 19 | Kunming | 13.86 | Hefei | 16.44 | Qingyuan | 3.39 |
| 20 | Guiyang | 12.56 | Nanning | 16.30 | Tianjin | 3.32 |
Figure 5 Division of city roles on weekdays and during Golden Week |
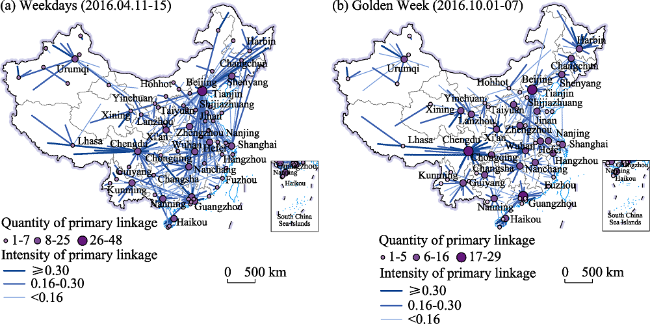
Figure 6 Spatial distribution of the dominant flows of the intercity travel network on weekdays and during Golden Week |
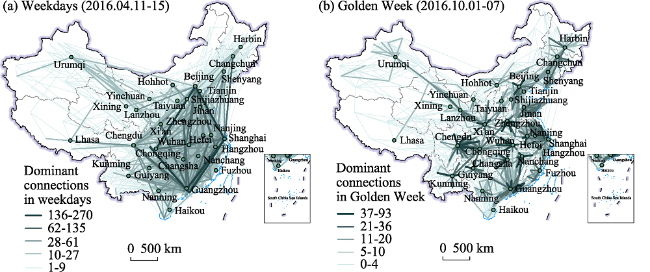
Figure 7 Comparison of spatial patterns of the intercity travel network for weekdays and Golden Week |
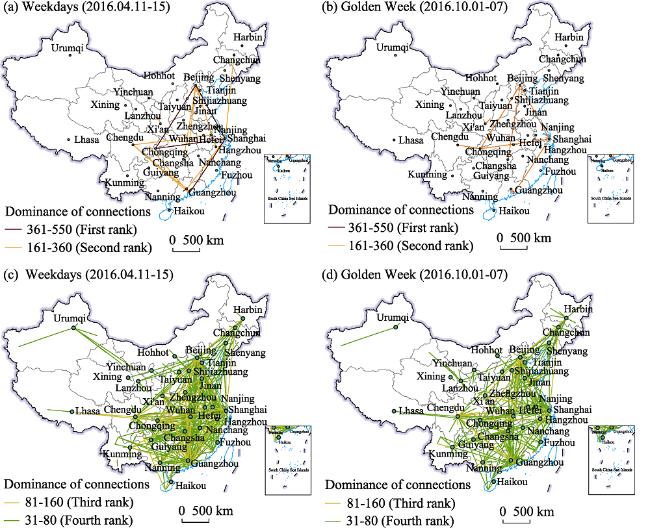
Figure 8 City links with an advantageous connectivity index (RSL) in the intercity travel network for weekdays and Golden Week |
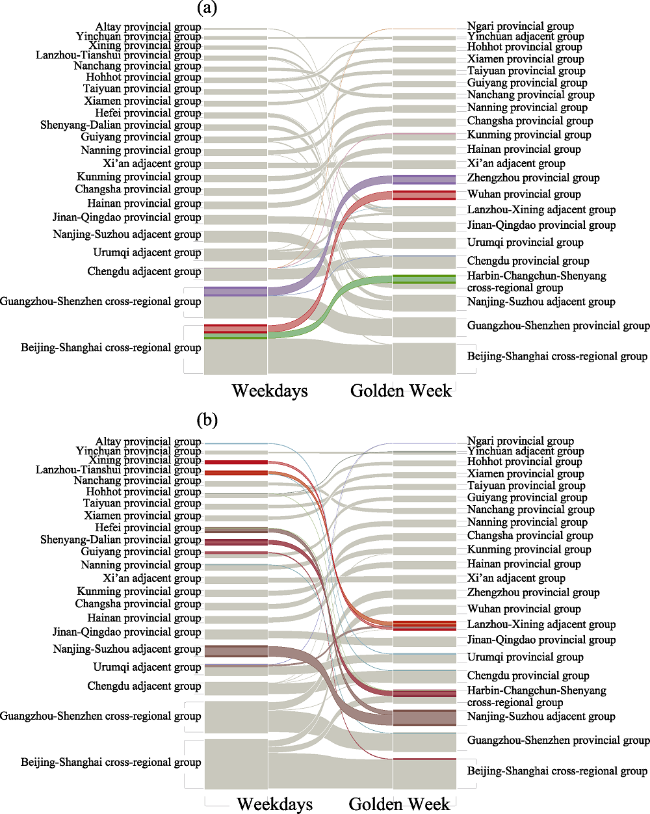
Figure 9 Divisions and changes of community structure for weekdays and Golden WeekNotes: (1) Different bars represent different communities and are arranged according to the PageRank value of the community city. The higher the PageRank value, the lower the position and the higher the importance and status of the community in the network. (2) The horizontal streamlines connecting different communities in the two periods indicate the changes of cities in each community between weekdays and Golden Week, and their width is directly proportional to the number of cities in each community. (3) To clearly show the changes in the communities between the two periods, the left panel highlights the changes between weekdays and Golden Week of the Beijing-Shanghai community and the Guangzhou-Shenzhen community, while the right panel highlights the changes in the other communities. |
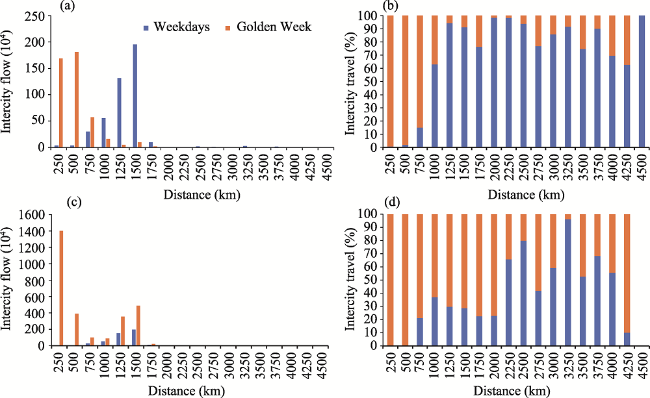
Figure 10 Comparison of intercity travel distance between weekdays and Golden Week |
| [1] |
|
| [2] |
|
| [3] |
|
| [4] |
|
| [5] |
|
| [6] |
|
| [7] |
|
| [8] |
|
| [9] |
|
| [10] |
|
| [11] |
|
| [12] |
|
| [13] |
|
| [14] |
|
| [15] |
|
| [16] |
|
| [17] |
|
| [18] |
|
| [19] |
|
| [20] |
|
| [21] |
|
| [22] |
|
| [23] |
|
| [24] |
|
| [25] |
|
| [26] |
|
| [27] |
|
| [28] |
|
| [29] |
|
| [30] |
|
| [31] |
|
| [32] |
|
| [33] |
|
| [34] |
|
| [35] |
|
| [36] |
|
| [37] |
|
/
| 〈 |
|
〉 |