
Journal of Geographical Sciences >
The cooperative and conflictual interactions between the United States, Russia, and China: A quantitative analysis of event data
|
Yuan Lihua (1988-), PhD Candidate, specialized in trade relationships and regional studies. E-mail: geobnuer@mail.bnu.edu.cn |
Accepted date: 2020-06-02
Online published: 2020-10-27
Supported by
The Second Tibetan Plateau Scientific Expedition and Research (STEP) program, No(2019QZKK0608)
Talent Start Project of Beijing Normal University
Copyright
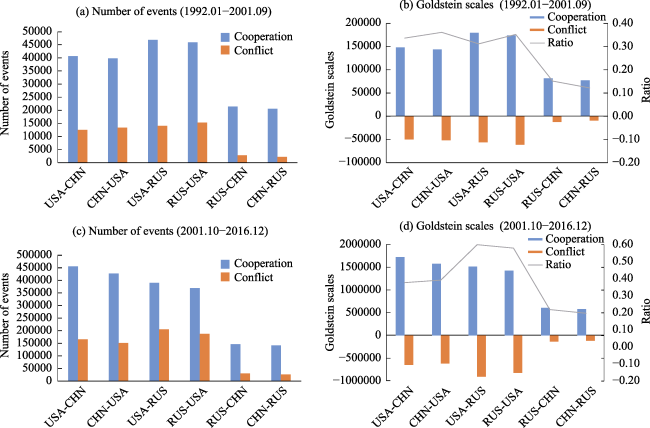
The United States, Russia and China are militarily and economically among the most powerful countries in the post-Cold War period, and the interactions between the three powers heavily influence the international system. However, different conclusions about this question are generally made by researchers through qualitative analysis, and it is necessary to objectively and quantitatively investigate their interactions. Monthly-aggregated event data from the Global Data on Events, Location and Tone (GDELT) to measure cooperative and conflictual interactions between the three powers, and the complementary cumulative distribution function (CCDF) and the vector autoregression (VAR) method are utilized to investigate their interactions in two periods: January, 1991 to September, 2001, and October, 2001 to December, 2016. The results of frequencies and strengths analysis showed that: the frequencies and strengths of USA-China interactions slightly exceeded those of USA-Russia interactions and became the dominant interactions in the second period. Although that cooperation prevailed in the three dyads in two periods, the conflictual interactions between the USA and Russia tended to be more intense in the second period, mainly related to the strategic contradiction between the USA and Russia, especially in Georgia, Ukraine and Syria. The results of CCDF indicated that similar probabilities in the cooperative behaviors between the three dyads, but the differences in the probabilities of conflictual behaviors in the USA-Russia dyad showed complicated characteristic, and those between Russia and China indicated that Russia had been consistently giving China a hard time in both periods when dealing with conflict. The USA was always an essential factor in affecting the interactions between Russia and China in both periods, but China’s behavior only played a limited role in influencing the interactions between the USA-Russia dyad. Our study provides quantitative insight into the direct cooperative and conflictual interactions between the three dyads since the end of the Cold War and helps to understand their interactions better.
YUAN Lihua , SONG Changqing , CHENG Changxiu , SHEN Shi , CHEN Xiaoqiang , WANG Yuanhui . The cooperative and conflictual interactions between the United States, Russia, and China: A quantitative analysis of event data[J]. Journal of Geographical Sciences, 2020 , 30(10) : 1702 -1720 . DOI: 10.1007/s11442-020-1808-6
Table 1 Descriptions of the monthly time-series variables |
| Dyads | Direction | Variables | Descriptions of variables |
|---|---|---|---|
| USA-CHN dyad | USA-CHN | UCp, UCf | Scales of cooperative/conflictual behavior from the USA toward China |
| CHN-USA | CUp, CUf | Scales of cooperative/conflictual behavior from China toward the USA | |
| USA-RUS dyad | USA-RUS | URp, URf | Scales of cooperative/conflictual behavior from the USA toward Russia |
| RUS-USA | RUp, RUf | Scales of cooperative/conflictual behavior from Russia toward the USA | |
| RUS-CHN dyad | RUS-CHN | RCp, RCf | Scales of cooperative/conflictual behavior from Russia toward China |
| RUS-CHN | CRp, CRf | Scales of cooperative/conflictual behavior from China toward Russia |
Figure 1 Numbers and scales of cooperation and conflict between the three dyads in two periods(Note: The ratio in Figures 1b and 1d denotes the ratio of absolute scales of conflict to cooperation between dyad countries.) |
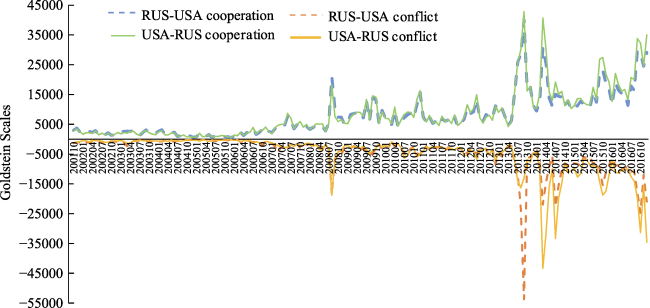
Figure 2 Goldstein scales of conflict and cooperation between the USA and Russia in 2001.10-2016.12 period |
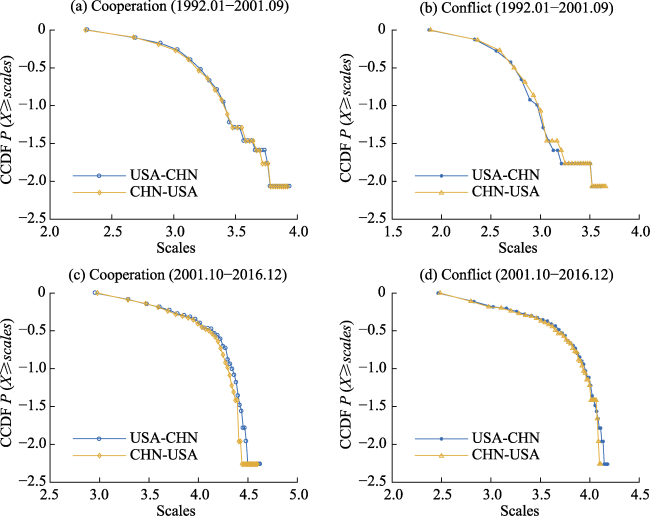
Figure 3 The log-log plot of CCDF of the absolute cooperative and conflictual scales between the USA and China(Note: USA-CHN and CHN-USA mean the scales sent from the USA to China and those from China to the USA, respectively.) |
Figure 4 The log-log plot of CCDF of the absolute cooperative and conflictual scales between the USA and Russia(Note: USA-RUS and RUS-USA mean the scales sent from the USA to Russia and those from Russia to the USA, respectively.) |
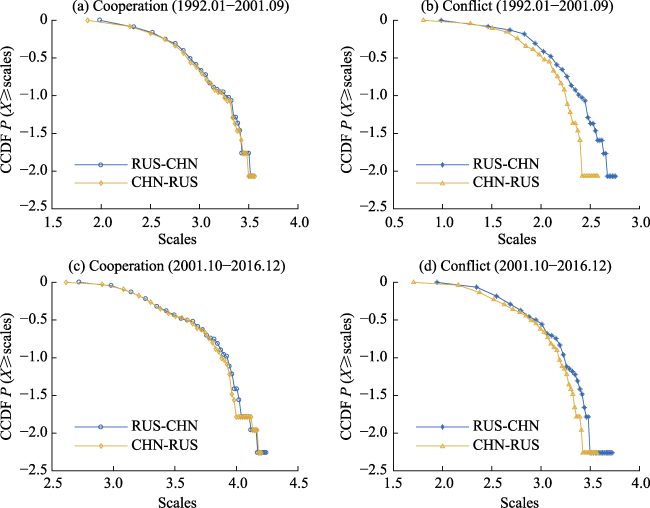
Figure 5 The log-log plot of CCDF of the absolute cooperative and conflictual scales between Russia and China(Note: RUS-CHN and CHN-RUS mean the scales sent from Russia to China and those from China to Russia, respectively.) |
Table 2 The significance level of the Granger/Wald test of the USA-China dyad in both periods |
| Independent variables | 1992.01-2001.09 period | 2001.10-2016.12 period | ||||||
|---|---|---|---|---|---|---|---|---|
| Dependent variable | Dependent variable | |||||||
| UCp | CUp | UCf | CUf | UCp | CUp | UCf | CUf | |
| UCp(-1) | - | 0.038*** | 0.091** | 0.159* | - | 0.767 | 0.681 | 0.615 |
| CUp(-1) | 0.649 | - | 0.090** | 0.389 | 0.572 | - | 0.306 | 0.234 |
| URp(-1) | 0.296 | 0.460 | 0.161* | 0.543 | 0.052** | 0.033*** | 0.054** | 0.571 |
| RUp(-1) | 0.264 | 0.383 | 0.208 | 0.849 | 0.156* | 0.146* | 0.224 | 0.633 |
| RCp(-1) | 0.007*** | 0.019*** | 0.328 | 0.024*** | 0.444 | 0.342 | 0.503 | 0.619 |
| CRp(-1) | 0.007*** | 0.018*** | 0.382 | 0.018*** | 0.432 | 0.331 | 0.319 | 0.646 |
| UCf(-1) | 0.866 | 0.754 | - | 0.149* | 0.027*** | 0.031* | - | 0.010*** |
| CUf(-1) | 0.295 | 0.537 | 0.042*** | - | 0.760 | 0.698 | 0.269 | - |
| URf(-1) | 0.143* | 0.210 | 0.146* | 0.012*** | 0.833 | 0.836 | 0.083** | 0.078** |
| RUf(-1) | 0.872 | 0.873 | 0.933 | 0.867 | 0.856 | 0.979 | 0.101* | 0.550 |
| RCf(-1) | 0.223 | 0.485 | 0.357 | 0.880 | 0.127* | 0.055** | 0.283 | 0.671 |
| CRf(-1) | 0.473 | 0.561 | 0.496 | 0.669 | 0.557 | 0.253 | 0.829 | 0.731 |
| R2 | 0.726 | 0.713 | 0.558 | 0.570 | 0.892 | 0.897 | 0.912 | 0.914 |
| Adjusted R2 | 0.694 | 0.680 | 0.506 | 0.519 | 0.884 | 0.890 | 0.905 | 0.908 |
| F-statistic | 22.741 | 21.320 | 10.826 | 11.356 | 115.926 | 122.708 | 145.113 | 149.057 |
Note: The variables were both transformed by natural log transformation before VAR model implementation. Because of the zero value in the time-series of the conflictual variables with a negative value, one was added before taking the absolute value, and the following log transformation was computed. Freeman et al. (1989) confirmed that logarithm transformations of the data preserve the causal relations. It should be noted that we logarithmized the absolute value of the conflictual scales, and then made the value negative. The notations of ***, **, and * indicate that the variables were significant at 5%, 10%, and 20%, respectively. The notation of “- ” denotes no value in that cell. |
Table 3 The significance level of the Granger/Wald test of the USA-Russia dyad in both periods |
| Independent variables | 1992.01-2001.09 period | 2001.10-2016.12 period | ||||||
|---|---|---|---|---|---|---|---|---|
| Dependent variable | Dependent variable | |||||||
| URp | RUp | URf | RUf | URp | RUp | URf | RUf | |
| UCp(-1) | 0.759 | 0.642 | 0.431 | 0.190* | 0.097 | 0.060** | 0.678 | 0.720 |
| CUp(-1) | 0.842 | 0.719 | 0.568 | 0.273 | 0.055** | 0.032*** | 0.642 | 0.840 |
| URp(-1) | - | 0.579 | 0.304 | 0.123* | - | 0.827 | 0.762 | 0.900 |
| RUp(-1) | 0.112* | - | 0.163* | 0.113* | 0.856 | - | 0.805 | 0.766 |
| RCp(-1) | 0.518 | 0.388 | 0.504 | 0.753 | 0.930 | 0.862 | 0.887 | 0.916 |
| CRp(-1) | 0.250 | 0.166* | 0.338 | 0.535 | 0.944 | 0.878 | 0.927 | 0.938 |
| UCf(-1) | 0.832 | 0.770 | 0.656 | 0.919 | 0.057** | 0.049*** | 0.308 | 0.208 |
| CUf(-1) | 0.651 | 0.387 | 0.796 | 0.878 | 0.937 | 0.720 | 0.460 | 0.644 |
| URf(-1) | 0.391 | 0.626 | - | 0.332 | 0.123* | 0.159* | - | 0.003*** |
| RUf(-1) | 0.863 | 0.559 | 0.511 | - | 0.430 | 0.287 | 0.787 | - |
| RCf(-1) | 0.969 | 0.958 | 0.723 | 0.585 | 0.416 | 0.470 | 0.346 | 0.675 |
| CRf(-1) | 0.978 | 0.941 | 0.542 | 0.605 | 0.604 | 0.428 | 0.886 | 0.535 |
| R2 | 0.553 | 0.540 | 0.597 | 0.604 | 0.869 | 0.869 | 0.880 | 0.849 |
| Adjusted R2 | 0.501 | 0.486 | 0.550 | 0.558 | 0.860 | 0.860 | 0.872 | 0.839 |
| F-statistic | 10.628 | 10.075 | 12.707 | 13.093 | 93.769 | 93.501 | 103.572 | 79.374 |
Note: Same as the notes below Table 2. |
Table 4 The significance level of the Granger/Wald test of China-Russia dyad in both periods |
| Independent variables | 1992.01-2001.09 period | 2001.10-2016.12 period | ||||||
|---|---|---|---|---|---|---|---|---|
| Dependent variable | Dependent variable | |||||||
| RCp | CRp | RCf | CRf | RCp | CRp | RCf | CRf | |
| UCp(-1) | 0.919 | 0.795 | 0.950 | 0.553 | 0.445 | 0.446 | 0.613 | 0.339 |
| CUp(-1) | 0.673 | 0.807 | 0.626 | 0.728 | 0.236 | 0.263 | 0.856 | 0.538 |
| URp(-1) | 0.627 | 0.502 | 0.598 | 0.091 | 0.011*** | 0.011*** | 0.312 | 0.172* |
| RUp(-1) | 0.732 | 0.681 | 0.914 | 0.044*** | 0.007*** | 0.009*** | 0.277 | 0.163* |
| RCp(-1) | - | 0.601 | 0.911 | 0.119* | - | 0.845 | 0.745 | 0.799 |
| CRp(-1) | 0.480 | - | 0.971 | 0.415 | 0.696 | - | 0.851 | 0.603 |
| UCf(-1) | 0.006*** | 0.001*** | 0.973 | 0.608 | 0.514 | 0.661 | 0.581 | 0.777 |
| CUf(-1) | 0.004*** | 0.001*** | 0.614 | 0.602 | 0.303 | 0.398 | 0.359 | 0.195* |
| URf(-1) | 0.965 | 0.453 | 0.131* | 0.048*** | 0.062** | 0.153* | 0.028*** | 0.195* |
| RUf(-1) | 0.745 | 0.670 | 0.187* | 0.905 | 0.566 | 0.833 | 0.181* | 0.360 |
| RCf(-1) | 0.000*** | 0.000*** | - | 0.887 | 0.272 | 0.214 | - | 0.198* |
| CRf(-1) | 0.001*** | 0.000*** | 0.054** | - | 0.184* | 0.202 | 0.917 | - |
| R2 | 0.539 | 0.561 | 0.444 | 0.454 | 0.692 | 0.684 | 0.682 | 0.695 |
| Adj. R2 | 0.485 | 0.509 | 0.379 | 0.391 | 0.670 | 0.662 | 0.659 | 0.673 |
| F-statistic | 10.024 | 10.947 | 6.845 | 7.145 | 31.616 | 30.524 | 30.180 | 32.109 |
Note: Same as the notes below Table 2. |
| 1 |
|
| 2 |
|
| 3 |
|
| 4 |
|
| 5 |
|
| 6 |
|
| 7 |
|
| 8 |
|
| 9 |
|
| 10 |
|
| 11 |
|
| 12 |
|
| 13 |
|
| 14 |
|
| 15 |
|
| 16 |
|
| 17 |
|
| 18 |
|
| 19 |
|
| 20 |
|
| 21 |
|
| 22 |
|
| 23 |
|
| 24 |
|
| 25 |
|
| 26 |
|
| 27 |
|
| 28 |
|
| 29 |
|
| 30 |
|
| 31 |
|
| 32 |
|
| 33 |
|
| 34 |
|
| 35 |
|
| 36 |
|
| 37 |
|
| 38 |
|
| 39 |
|
| 40 |
|
| 41 |
|
| 42 |
|
| 43 |
|
| 44 |
|
| 45 |
|
| 46 |
|
| 47 |
|
| 48 |
|
| 49 |
|
| 50 |
|
| 51 |
|
| 52 |
|
| 53 |
|
| 54 |
|
| 55 |
|
| 56 |
|
| 57 |
|
/
| 〈 |
|
〉 |
