
Journal of Geographical Sciences >
Temperature variations evidenced by records on the latest spring snowing dates in Hangzhou of eastern China during 1131-1270AD
|
Liu Haolong (1976–), PhD and Associate Professor, specialized in historical geography and global change. E-mail: liuhl@igsnrr.ac.cn |
Received date: 2020-03-22
Accepted date: 2020-06-12
Online published: 2020-10-27
Supported by
National Key R&D Program of China, No(2017YFA0603300)
Strategic Priority Research Program of the Chinese Academy of Sciences, No(XDA19040101)
Copyright
We collected and verified documentary records of the latest spring snowing dates (LSSD) in Hangzhou during Southern Song Dynasty. Furtherly, the statistical correlation between this proxy and February-April mean temperature in Hangzhou was examined, and samples later than the perennial mean of the LSSD during Southern Song Dynasty were transformed into the decadal mean of LSSD by means of Boltzmann function. General characteristics of this reconstructed LSSD series with a 10-year temporal resolution was analyzed, and it was also compared with other documentary evidences and reconstructed climate series in China for the period 1131-1270. The results and discussion suggested that: (1) Records of the LSSD in Hangzhou during Southern Song Dynasty did not refer to ice pellets and graupels, which had an explicit climate significance (-0.34ºC/10d, R 2=0.37, p<0.001). However, when this proxy is used to reconstruct temperature changes, all dates should be converted into proleptic Gregorian style and meet the same criterion of “true Qi” as the Chinese traditional calendar after 1929. (2) The decadal mean of LSSD can be effectively estimated by using the forefront of LSSD in the decade on the basis of Boltzmann function, whose extrapolation has a lesser uncertainty than those on the basis of linear models or polynomial models. (3) The spring climate in Hangzhou during 1131-1270 was almost as warm as the period 1951-1980. At the centennial scale, this period can be divided into two phases: the cold 1131-1170 and the warm 1171-1270. In the latter, 1181-1200 and 1221-1240 were two cold intervals at the multi-decadal scale. (4) The reconstructed LSSD series was consistent well with other documentary evidences and reconstructed climate series in China for 1131-1270, which may reflect the influence on the climate over most regions of China imposed by the Pacific Decadal Oscillation (PDO).
LIU Haolong , DAI Junhu , YAN Junhui , HE Fanneng , GE Quansheng , MU Chongxing . Temperature variations evidenced by records on the latest spring snowing dates in Hangzhou of eastern China during 1131-1270AD[J]. Journal of Geographical Sciences, 2020 , 30(10) : 1664 -1680 . DOI: 10.1007/s11442-020-1806-8
Table 1 Records of the LSSDs in Hangzhou during Southern Song Dynasty |
| Year | JC date* | GC date** | Record sources |
|---|---|---|---|
| 1131 | 3-30 | 4-6 | Records of Wuxing Zhi in the History of Song Dynasty11 |
| 1133 | 3-4 | 3-11 | Volume 62 from the Major Events Records from 1127 to 1162 |
| 1135 | 3-20 | 3-27 | Biography of “Gao Zong” from the History of Song Dynasty |
| 1136 | 3-9 | 3-16 | Records of Wuxing Zhi in the History of Song Dynasty |
| 1137 | 3-14 | 3-21 | Records of Wuxing Zhi in the History of Song Dynasty |
| 1143 | 4-12 | 4-19 | Records of Wuxing Zhi in the History of Song Dynasty |
| 1147 | 3-5 | 3-12 | Records of Wuxing Zhi in the History of Song Dynasty |
| 1148 | 3-6 | 3-13 | Records of Wuxing Zhi in the History of Song Dynasty |
| 1155 | 3-2 | 3-9 | Volume 168 from the Major Events Records from 1127 to 1162 |
| 1158 | 4-6 | 4-13 | Records of Wuxing Zhi in the History of Song Dynasty |
| 1159 | 3-4 | 3-11 | Records of Wuxing Zhi in the History of Song Dynasty |
| 1160 | 3-15 | 3-22 | Volume 183 from the Major Events Records from 1127 to 1162 |
| 1162 | 3-12 | 3-19 | Volume 197 from the Major Events Records from 1127 to 1162 |
| 1163 | 3-3 | 3-10 | The Abnormal Phenomena part from the Song Huiyao Jigao |
| 1164 | 3-16 | 3-23 | The Abnormal Phenomena part from the Song Huiyao Jigao |
| 1165 | 3-30 | 4-6 | The Abnormal Phenomena part from the Song Huiyao Jigao |
| 1166 | 3-25 | 4-1 | Records of Wuxing Zhi in the History of Song Dynasty |
| 1167 | 3-6 | 3-13 | Records of Wuxing Zhi in the History of Song Dynasty |
| 1168 | 4-2 | 4-9 | Volume 25 from the Complete Literature of the Song History |
| 1169 | 3-1 | 3-8 | Records of Wuxing Zhi in the History of Song Dynasty |
| 1171 | 3-19 | 3-26 | Records of Wuxing Zhi in the History of Song Dynasty |
| 1173 | 3-2 | 3-9 | The Shihuo Zhi part from the Song Huiyao Jigao |
| 1186 | 3-8 | 3-15 | Records of Wuxing Zhi in the History of Song Dynasty |
| 1188 | 3-20 | 3-27 | Records of Wuxing Zhi in the History of Song Dynasty |
| 1189 | 3-1 | 3-8 | The Abnormal Phenomena part from the Song Huiyao Jigao |
| 1190 | 3-19 | 3-26 | Records of Wuxing Zhi in the History of Song Dynasty |
| 1191 | 3-10 | 3-17 | The Abnormal Phenomena part from the Song Huiyao Jigao |
| 1193 | 3-26 | 4-2 | The Abnormal Phenomena part from the Song Huiyao Jigao |
| 1197 | 3-14 | 3-21 | Records of Wuxing Zhi in the History of Song Dynasty |
| 1199 | 3-6 | 3-13 | Records of Wuxing Zhi in the History of Song Dynasty |
| 1200 | 3-15 | 3-22 | Records of Wuxing Zhi in the History of Song Dynasty |
| 1204 | 3-1 | 3-8 | Records of Wuxing Zhi in the History of Song Dynasty |
| 1205 | 3-19 | 3-26 | Volume 29 from the Complete Literature of the Song History |
| 1207 | 3-2 | 3-9 | Records of Wuxing Zhi in the History of Song Dynasty |
| 1208 | 3-2 | 3-9 | Records of Wuxing Zhi in the History of Song Dynasty |
| 1211 | 3-9 | 3-16 | Records of Wuxing Zhi in the History of Song Dynasty |
| 1213 | 3-9 | 3-16 | Records of Wuxing Zhi in the History of Song Dynasty |
| 1216 | 3-2 | 3-9 | Records of Wuxing Zhi in the History of Song Dynasty |
| 1217 | 3-23 | 3-30 | Records of Wuxing Zhi in the History of Song Dynasty |
| 1223 | 4-12 | 4-19 | The Abnormal Phenomena part from the Song Huiyao Jigao |
Table 1 (Continued) |
| Year | JC date* | GC date** | Record sources |
|---|---|---|---|
| 1224 | 4-6 | 4-13 | Records of Wuxing Zhi in the History of Song Dynasty |
| 1225 | 5-9 | 5-16 | Records of Wuxing Zhi in the History of Song Dynasty |
| 1226 | 4-26 | 5-3 | Poem entitled “A journey on a thundering day in winter” by Hong Kuizhi |
| 1231 | 3-17 | 3-23 | Records of Wuxing Zhi in the History of Song Dynasty |
| 1233 | 4-18 | 4-25 | Records of Wuxing Zhi in the History of Song Dynasty |
| 1234 | 3-5 | 3-12 | Records of Wuxing Zhi in the History of Song Dynasty |
| 1235 | 3-22 | 3-29 | Records of Wuxing Zhi in the History of Song Dynasty |
| 1238 | 3-6 | 3-13 | Records of Wuxing Zhi in the History of Song Dynasty |
| 1243 | 3-1 | 3-8 | Volume 33 from the Complete Literature of the History of Song Dynasty |
| 1244 | 3-11 | 3-18*** | Poem entitled “Snowing in later spring in 1244” by Zhu Nanjie |
| 1246 | 3-1 | 3-8 | Records of Wuxing Zhi in the History of Song Dynasty |
| 1250 | 3-5 | 3-12 | Volume 33 from the Complete Literature of the History of Song Dynasty |
| 1253 | 3-4 | 3-11 | Records of Wuxing Zhi in the History of Song Dynasty |
| 1254 | 4-4 | 4-11 | Records of Wuxing Zhi in the History of Song Dynasty |
| 1258 | 3-7 | 3-14**** | The Abnormal Phenomena part from the Song Huiyao Jigao |
| 1259 | 3-1 | 3-8 | Records of Wuxing Zhi in the History of Song Dynasty |
| 1264 | 3-5 | 3-12 | Records of Wuxing Zhi in the History of Song Dynasty |
*, **: JC and GC are the abbreviation of the Julian calendar and the proleptic Gregorian calendar, respectively. Their date formats are both set as month-day in this paper. ***, ****: The two dates’ conversion was both based on the conservative estimation that the later spring snowing occurred on February 1 of the Chinese lunisolar calendar. |
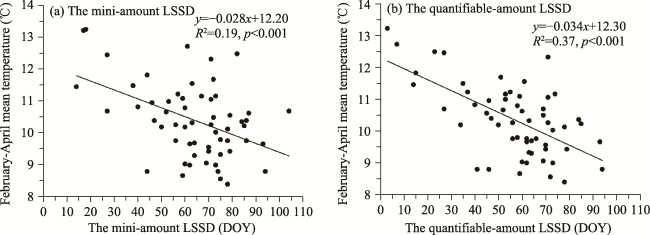
Figure 1 The statistical relationships between the LSSD and February-April mean temperature in Hangzhou during 1951-2010 ( ·: Annual samples; —: Linear fit line; DOY: Day of the year, also called Ordinal date (e.g., 2 represents January 2)) |
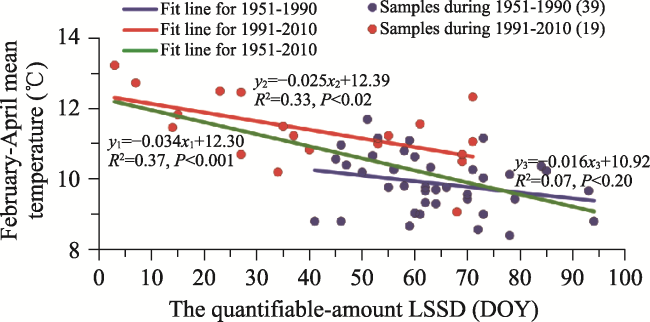
Figure 2 The climatic significances of Hangzhou’s quantifiable-amount LSSD during different time spans |
Table 2 Different fitting results of three functions on the 10-year mean LSSD in Hangzhou |
| Independent variable | Residual sum of squares | Adjusted R2 | ||||
|---|---|---|---|---|---|---|
| Linear fitting | Quadratic fitting | Boltzmann fitting | Linear fitting | Quadratic fitting | Boltzmann fitting | |
| The latest of decadal LSSDs | 413.99 | 371.33 | 357.66 | 0.77 | 0.79 | 0.79 |
| The intra-decadal averages of the top 2 LSSD sorted in the order of latest to earliest | 428.61 | 211.31 | 197.17 | 0.77 | 0.88 | 0.88 |
| The intra-decadal averages of the top 3 LSSD sorted in the order of latest to earliest | 252.35 | 94.22 | 86.43 | 0.86 | 0.95 | 0.95 |
| The intra-decadal averages of the top 4 LSSD sorted in the order of latest to earliest | 204.76 | 67.21 | 61.62 | 0.89 | 0.96 | 0.96 |
| The intra-decadal averages of the top 5 LSSD sorted in the order of latest to earliest | 105.59 | 46.83 | 44.98 | 0.94 | 0.97 | 0.97 |
| The intra-decadal averages of the top 8 LSSD sorted in the order of latest to earliest | 15.98 | 15.55 | 14.80 | 0.99 | 0.99 | 0.99 |
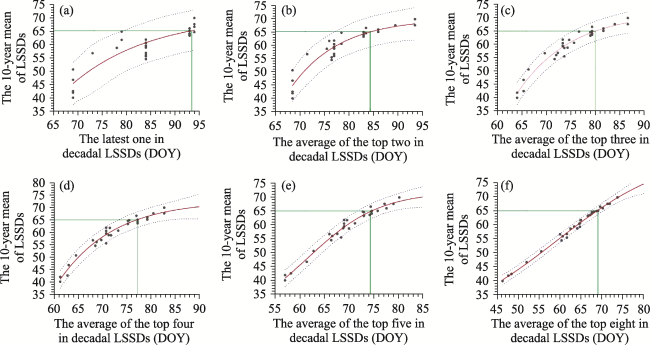
Figure 3 The relationships between the 10-year mean LSSD and 6 statistic indexes in Hangzhou. The dots are samples; the red solid lines are nonlinear trend lines fitted by the Boltzmann function; the blue dotted lines are prediction bands at the 95% confidence level; the green beelines refer to the six corresponding statistic values for the LSSDs in the decade when the 10-year mean LSSD is March 6. |
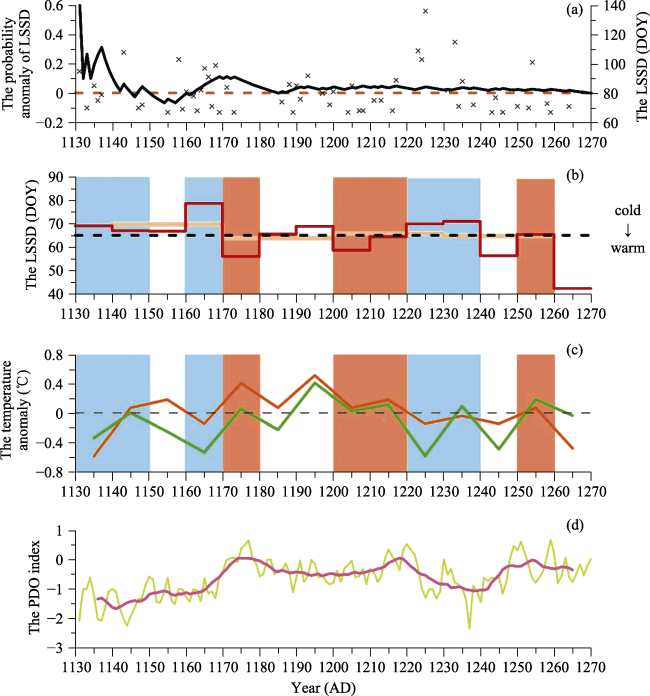
Figure 4 Comparison of reconstructed climatic series for 1131-1270. (a) The inter-annual variations in the LSSD in Hangzhou and its abrupt change detection result of probability anomaly, ´ refer to 57 samples later than the perennial mean of the LSSDs, black line refers to the curve of probability distribution, and Southern Song Dynasty is taken as the reference period; (b) Reconstructed series of the LSSDs in Hangzhou with different temporal resolutions, the red step line refers to a 10-year temporal resolution, the sand-yellow step line refers to a 30-year temporal resolution, and the black Zero Anomaly line is the mean LSSD (March 6) during the reference period 1951-1980. (c) Decadal-scale variations in temperature at two other regions in 1131-1270, the orange line refers to the result revealed by historical documents in Central China (Wang et al., 2007), the green line refers to the result revealed by tree rings in Animaqin Mountains (Chen et al., 2016), the black Zero Anomaly line refers to the corresponding means in different reference periods (the past millennia for the former, and the past two millennia for the latter), the blue area indicates relatively cold periods, and the red area relatively warm periods. (d) Variations in the PDO index (Macdonald and Case, 2005) in 1131-1270, the yellow line refers to annual values, and the rose line refers to 11-point running averages. |
| 1 |
|
| 2 |
Central Weather Bureau (CWB), 1975. Daily precipitation data in China during 1951 to 1970. Beijing: Central Weather Bureau, 1-681. (in Chinese)
|
| 3 |
Central Weather Bureau(CWB), 1978. Weather days’ data in China during 1961 to 1970. Beijing: Central Weather Bureau, 1-741. (in Chinese)
|
| 4 |
|
| 5 |
|
| 6 |
|
| 7 |
|
| 8 |
|
| 9 |
|
| 10 |
|
| 11 |
|
| 12 |
|
| 13 |
|
| 14 |
|
| 15 |
|
| 16 |
|
| 17 |
|
| 18 |
|
| 19 |
|
| 20 |
|
| 21 |
|
| 22 |
|
| 23 |
|
| 24 |
|
| 25 |
|
| 26 |
|
| 27 |
|
| 28 |
|
| 29 |
|
| 30 |
|
| 31 |
National Research Council(NRC), 2006. Surface Temperature Reconstructions for the Last 2,000 Years. Washington D C: The National Academies Press, 1-24.
|
| 32 |
PAGES, 2009. Science Plan and Implementation Strategy. IGBP Report No.57. IGBP Secretariat, Stockholm. 67pp.
|
| 33 |
|
| 34 |
|
| 35 |
|
| 36 |
|
| 37 |
|
| 38 |
|
| 39 |
|
| 40 |
|
| 41 |
|
| 42 |
|
| 43 |
|
| 44 |
|
| 45 |
|
| 46 |
|
| 47 |
|
| 48 |
|
/
| 〈 |
|
〉 |