
Journal of Geographical Sciences >
Impact of cultivated land fragmentation on spatial heterogeneity of agricultural agglomeration in China
|
Xu Weiyi (1992–), PhD Candidate, specialized in land use change process and its effects. E-mail: xuwy@smail.nju.edu.cn |
Received date: 2020-06-23
Accepted date: 2020-08-20
Online published: 2020-10-27
Supported by
National Natural Science Foundation of China, No(41971234)
National Natural Science Foundation of China, No(41971235)
Project of Graduate Student Innovative and Practical Research in Jiangsu Province, No(KYCX20-0028)
Major Program of National Social Science Foundation of China, No(19ZDA096)
Copyright
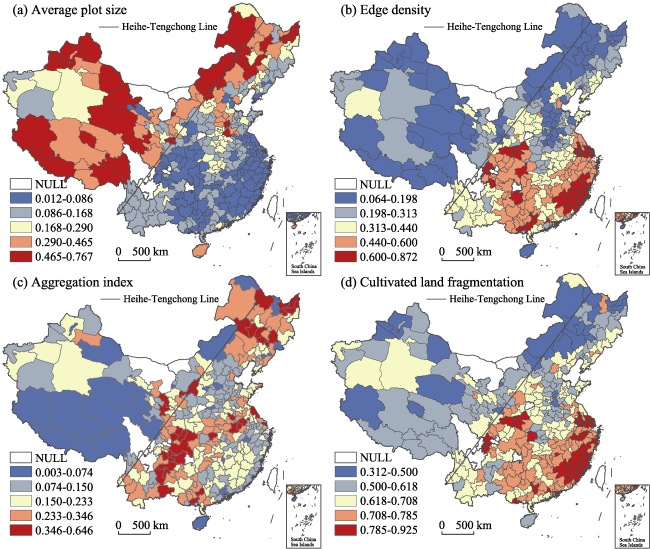
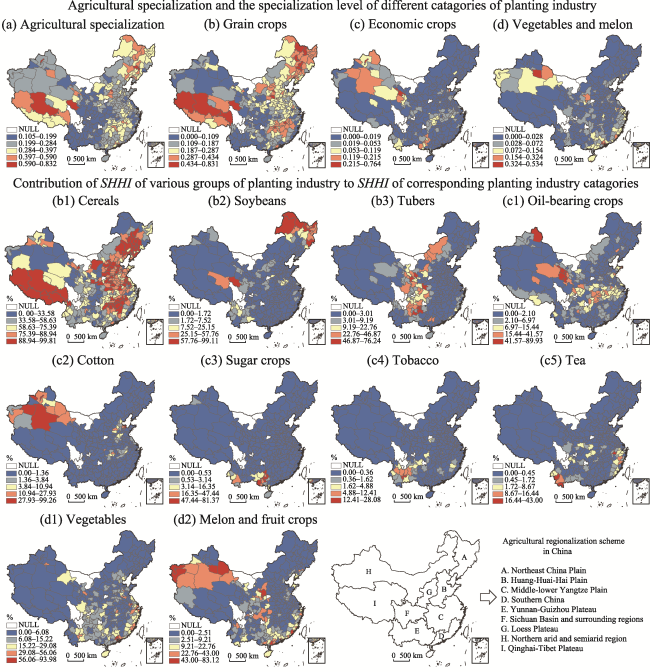
Systematically revealing the impact of cultivated land fragmentation (CLF) on the geographical agglomeration pattern of agricultural specialization (AS) has positive significance for national agricultural production management. Based on the data of the second national land survey and agricultural production, this study has explored the impact of CLF on spatial heterogeneity of agricultural agglomeration in China by comprehensively using the Theil index, ordinary least square model and geographically weighted regression. Results showed that: (1) the regional differentiation of the CLF in China is obvious, and the cultivated land fragmentation index is generally characterized by increasing pattern from northwest to southeast. (2) Spatially, the development level of AS in China has formed three high-value clusters in the Northeast China Plain, the Qinghai-Tibet Plateau, and the middle of the Middle-lower Yangtze Plain; and the low-value contiguous areas centered on the Yunnan-Guizhou Plateau and the Sichuan Basin and surrounding regions, with significant spatial differences. The contribution of grain crops, economic crops, and vegetables and melon to the level of AS was 74.63%, 9.09%, and 16.28%, respectively, and the pattern of agricultural geographical aggregation dominated by grain crops has primarily taken in shape. (3) CLF is significantly negatively correlated with AS, and every 1% increase in the degree of CLF will result in a decrease of about 0.2% in AS. However, the impact of CLF on the geographic agglomeration of different crop categories or groups varies significantly. Among them, CLF has a prominent impact on the specialization level of grain crops and vegetables and melon. Each 1% increase in the CLF will reduce the specialization level of grain crops by 0.38%, and increase the level of vegetables and melon by about 0.22%. (4) According to the landscape characteristics of cultivated land, the degree of spatial division and agglomeration of cultivated land patches have a significant impact on the formation of geographical agglomeration pattern of AS, and the intensity and direction of influence show significant regional differentiation, while the patch size has no significant impact.
XU Weiyi , JIN Xiaobin , LIU Jing , ZHOU Yinkang . Impact of cultivated land fragmentation on spatial heterogeneity of agricultural agglomeration in China[J]. Journal of Geographical Sciences, 2020 , 30(10) : 1571 -1589 . DOI: 10.1007/s11442-020-1800-1
Table 1 Classification of planting industry in China |
| Division (1) | Category (3) | Group (10) | Type (13) |
|---|---|---|---|
| Planting industry | Grain crops, economic crops, vegetables and melon | Cereal, soybeans, tubers, oil-bearing crops, cotton, sugar crops, tobacco, tea, vegetables, melon and fruit crops | Rice, wheat, corn, sonja, potato, peanuts, rapeseeds, cotton, sugarcane, tea, flue-cured tobacco, vegetables, orchards |
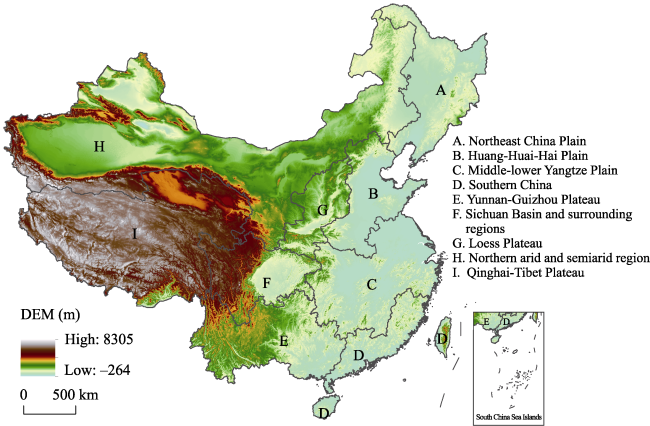
Figure 1 Agricultural regionalization scheme in China |
Figure 2 Spatial differentiation of cultivated land fragmentation in China |
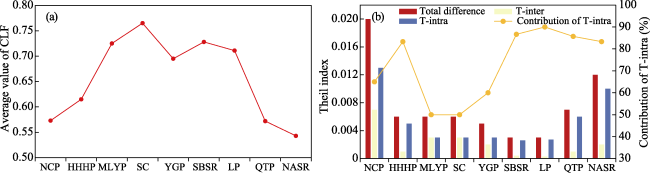
Figure 3 The difference of cultivated land fragmentation in various agricultural regions of China |
Figure 4 Spatial differentiation characteristics of agricultural specialization in China |
Table 2 Estimation and diagnosis results of ordinary least square model |
| Dependent variable | CLF | Landscape characteristics of cultivated land | ||||||
|---|---|---|---|---|---|---|---|---|
| APS | ED | AI | ||||||
| Regression coefficient | t | Regression coefficient | t | Regression coefficient | t | Regression coefficient | t | |
| SHHI | -0.208*** | -3.702 | 0.104* | 1.667 | -0.077 | -1.37 | -0.168*** | -3.123 |
| SHHI of grain crops | -0.382*** | -6.078 | 0.057 | 0.793 | -0.199*** | -3.056 | 0.065 | 1.054 |
| Cereal | -0.259*** | -4.070 | 0.033 | -0.463 | -0.207*** | -3.164 | 0.057 | -0.114 |
| Soybeans | -0.120*** | -3.838 | 0.057 | 1.597 | -0.039*** | -3.151 | 0.030*** | 2.649 |
| Tubers | -0.003 | -0.275 | 0.033** | 2.346 | 0.026 | 1.095 | 0.034 | 1.095 |
| SHHI of economic crops | -0.044 | -1.429 | 0.017** | 0.497 | -0.025 | -0.79 | -0.06** | -1.995 |
| Oil-bearing crops | -0.013 | 0.873 | 0.004 | 0.251 | -0.010 | -0.623 | -0.023 | -1.612 |
| Cotton | -0.050 | -1.876 | 0.019 | 0.636 | -0.025 | -0.93 | -0.044* | -1.692 |
| Sugar crops | 0.009 | 1.036 | -0.003 | -0.300 | 0.006 | 0.7 | 0.009 | 1.037 |
| Tobacco | 0.001 | 0.840 | -0.002 | -1.613 | -0.001 | -0.957 | 0.000 | 0.372 |
| Tea | 0.009 | 2.646 | -0.001 | -0.189 | 0.005 | 1.451 | -0.002 | -0.646 |
| SHHI of vegetables and melon | 0.218*** | 7.120 | 0.030 | 0.879 | 0.147*** | 4.778 | -0.174*** | -5.983 |
| Vegetables | 0.166*** | 7.425 | 0.022 | 0.882 | 0.115*** | 5.099 | -0.111*** | -5.143 |
| Melon and fruit crops | 0.052* | 2.799 | 0.008 | 0.371 | 0.031* | 1.653 | -0.063** | -3.477 |
Note: ***, **, * denotes significance level at 1%, 5%, and 10%, respectively. |
Table 3 Regression results of geographically weighted regression |
| Dependent variable | Cultivated land fragmentation | Landscape characteristics of cultivated land | ||||||
|---|---|---|---|---|---|---|---|---|
| Bandwidth | Sigma | AICc | R2 | Bandwidth | Sigma | AICc | R2 | |
| SHHI | 5.223 | 0.09 | -624.568 | 0.426 | 6.598 | 0.09 | -639.02 | 0.473 |
| SHHI of grain crops | 5.223 | 0.10 | -554.977 | 0.470 | 6.598 | 0.10 | -551.917 | 0.486 |
| Cereals | 5.223 | 0.10 | -539.595 | 0.424 | 6.598 | 0.10 | -525.532 | 0.423 |
| Soybeans | 5.223 | 0.05 | -1004.853 | 0.416 | 6.598 | 0.05 | -970.156 | 0.378 |
| SHHI of vegetables and melon | 5.223 | 0.05 | -993.151 | 0.432 | 6.598 | 0.05 | -1009.978 | 0.482 |
| Vegetables | 5.223 | 0.04 | -1163.867 | 0.375 | 6.598 | 0.04 | -1195.699 | 0.455 |
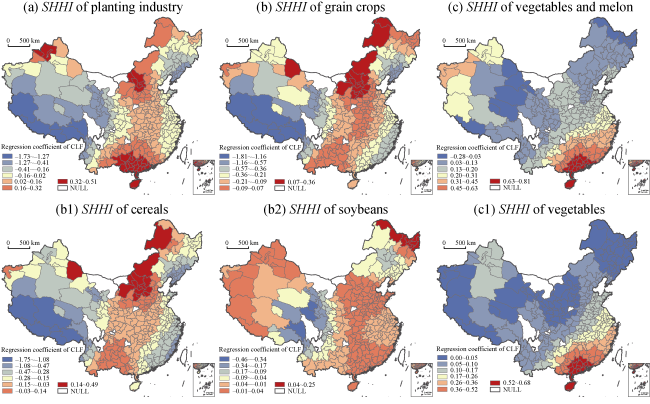
Figure 5 Distribution of regression coefficients of the impact of cultivated land fragmentation on planting specialization in China |
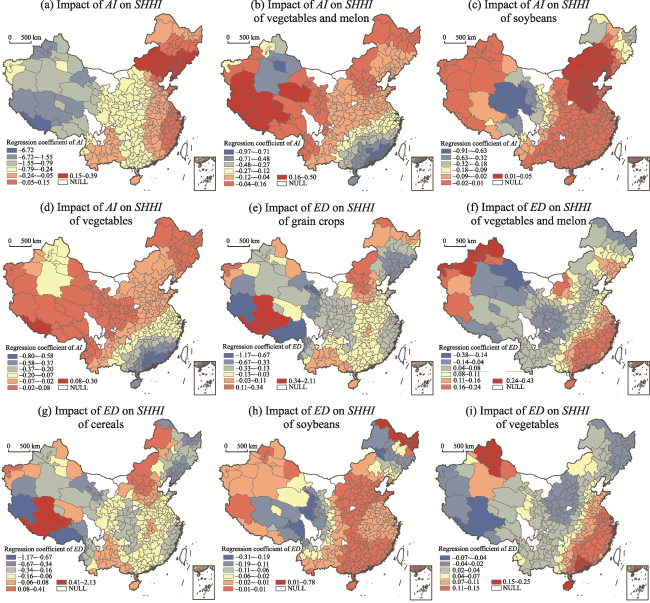
Figure 6 Spatial distribution of regression coefficients of the impact of cultivated land landscape characteristics on planting specialization in China |
| 1 |
|
| 2 |
|
| 3 |
|
| 4 |
|
| 5 |
|
| 6 |
|
| 7 |
|
| 8 |
|
| 9 |
|
| 10 |
|
| 11 |
|
| 12 |
|
| 13 |
|
| 14 |
|
| 15 |
|
| 16 |
|
| 17 |
|
| 18 |
|
| 19 |
|
| 20 |
|
| 21 |
|
| 22 |
|
| 23 |
|
| 24 |
|
| 25 |
|
| 26 |
|
| 27 |
|
| 28 |
|
/
| 〈 |
|
〉 |