
Journal of Geographical Sciences >
Exploring the spatio-temporal impacts of farmland reforestation on ecological connectivity using circuit theory: A case study in the agro-pastoral ecotone of North China
|
Liu Xiaojing (1996–), specialized in land use change and landscape connectivity. E-mail: Lxiaojing@whu.edu.cn |
Received date: 2020-03-15
Accepted date: 2020-06-18
Online published: 2020-11-25
Supported by
National Natural Science Foundation of China(41771429)
National Key Research and Development Project(2017YFB0503505)
Copyright
Farmland reforestation can contribute substantially to ecological restoration. Previous studies have extensively examined the ecological effects of farmland reforestation, but few of them have investigated the spatiotemporal responses of broad-scale landscape connectivity to reforestation. By using a typical agro-pastoral ecotone in northern China as a case study, we addressed this issue based on an innovative integration of circuit theory approach and counterfactual analysis. The forest connectivity through multiple dispersal pathways was measured using the circuit theory approach, and its spatiotemporal changes after reforestation were evaluated by counterfactual analysis. The results showed that from 2000-2015, the reforested farmland occupied 2095 km2, and 12.5% was on steeply sloped land. Farmland reforestation caused a greater increase in ecological connectivity by adding new ecological corridors and stepping stones in scattered forest areas rather than in areas with dense forest distributions. The newly added corridors and stepping stones were fragmented, short and narrow and thus deserve powerful protection. Future reforestation to improve landscape connectivity should highlight pinch point protection and obstacle removal as well as the tradeoff between farmland loss and farmer survival. Our findings are expected to inform the optimization of the Grain for Green policy from the perspective of broad-scale biodiversity conservation.
LIU Xiaojing , LIU Dianfeng , ZHAO Hongzhuo , HE Jianhua , LIU Yaolin . Exploring the spatio-temporal impacts of farmland reforestation on ecological connectivity using circuit theory: A case study in the agro-pastoral ecotone of North China[J]. Journal of Geographical Sciences, 2020 , 30(9) : 1419 -1435 . DOI: 10.1007/s11442-020-1790-z
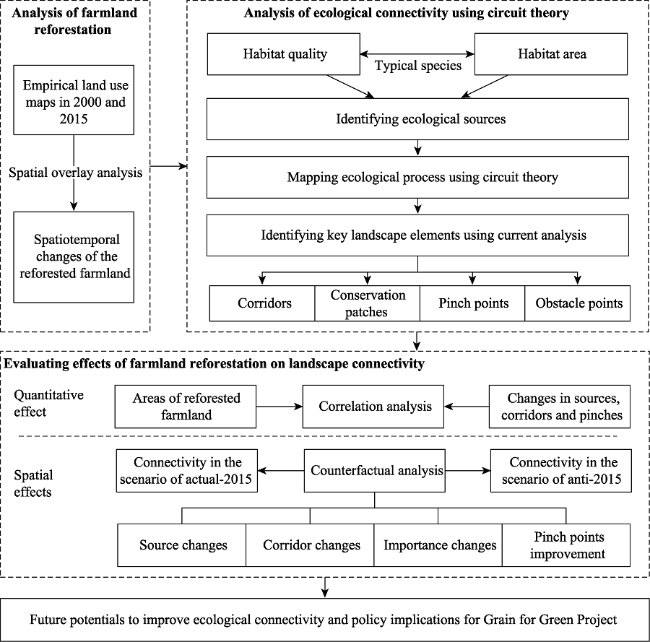
Figure 1 Analysis framework for evaluating the effect of farmland reforestation on ecological connectivity |
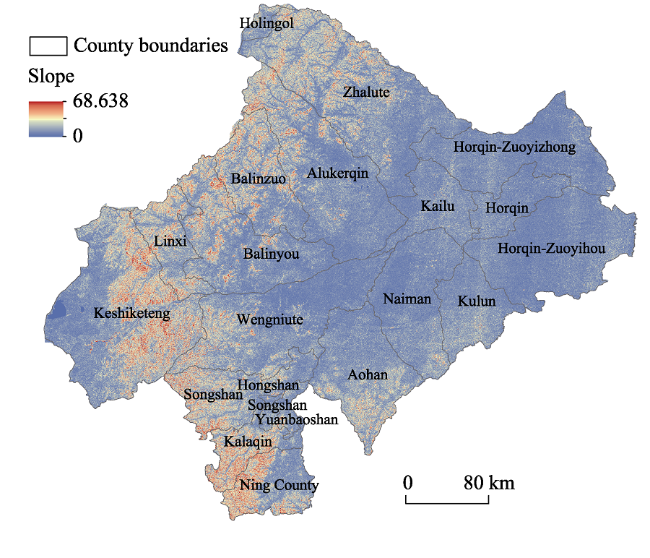
Figure 2 Location of the agro-pastoral ecotone of northern China |
Table 1 Ecological threat factors |
| Threats | Max distance/km | Weight | Decay function |
|---|---|---|---|
| Cultivated land | 8 | 0.7 | Linear |
| Water | 7 | 0.5 | Exponential |
| Built-up land | 12 | 1.0 | Exponential |
| Unused land | 8 | 0.8 | Linear |
Table 2 Sensitivity of land use types to threat factors |
| Land use type | Habitat | Cultivated land | Water | Built-up land | Unused land |
|---|---|---|---|---|---|
| Cultivated land | No | 0 | 0 | 0 | 0 |
| Forestland | Yes | 0.70 | 0.30 | 0.80 | 0.70 |
| Shrubland | Yes | 0.60 | 0.40 | 0.70 | 0.65 |
| Open forestland* | Yes | 0.60 | 0.40 | 0.60 | 0.70 |
| Grass land | No | 0 | 0 | 0 | 0 |
| Water areas | No | 0 | 0 | 0 | 0 |
| Built-up land | No | 0 | 0 | 0 | 0 |
| Barren areas | No | 0 | 0 | 0 | 0 |
* Open forestland refers to forestland with a canopy density of 10%-30%. |
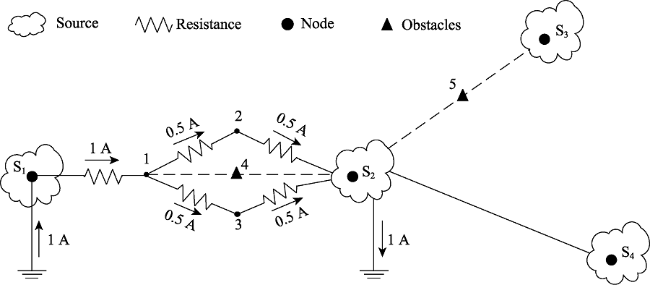
Figure 3 A diagram showing circuit theory for landscape connectivity |
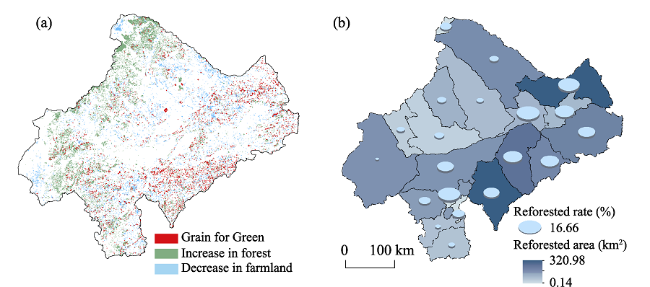
Figure 4 Reforested farmland during the period 2000-2015 (a. spatial pattern; b. reforested area and reforestation rate in each county) |
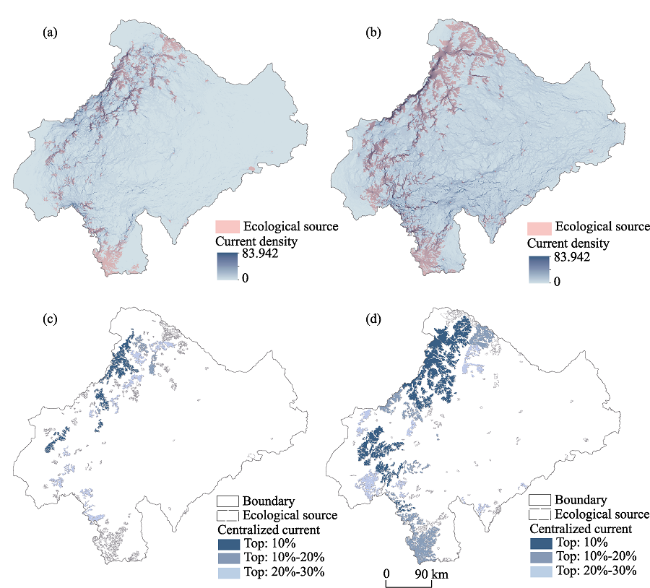
Figure 5 Spatial distribution of ecological sources and key conservation areas (a and b. sources in 2000 and 2015; c and d. key areas in 2000 and 2015) |
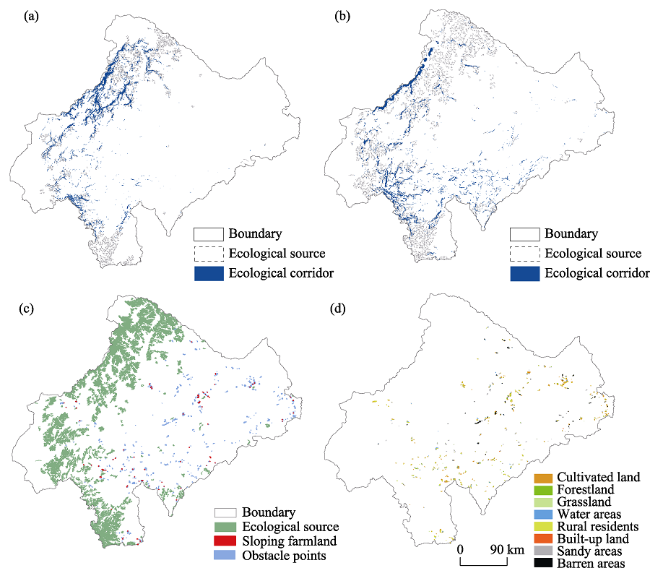
Figure 6 Spatial pattern of ecological corridors and obstacles (a and b. corridors in 2000 and 2015; c and d. obstacles and the occupation of land use types in 2015) |
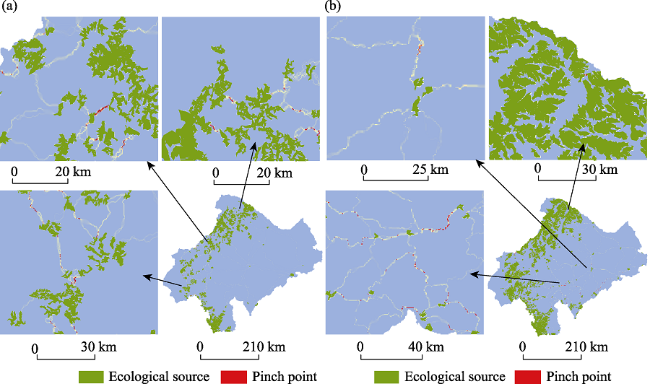
Figure 7 Spatial distribution of pinch points (a. 2000; b. 2015) |
Table 3 Changes in ecological connectivity after reforestation in different counties (km2) |
| Counties | Reforested area | Source increase | Corridor increase | Pinch increase |
|---|---|---|---|---|
| Aohan | 320.98 | 23.91 | 29.71 | 1.65 |
| Horqin-Zuoyizhong | 225.45 | 0.00 | 0.64 | 0.00 |
| Naiman | 187.31 | 5.36 | 4.09 | 0.14 |
| Horqin-Zuoyihou | 157.29 | 0.01 | 0.66 | 0.09 |
| Kulun | 153.14 | 0.00 | 4.43 | 0.72 |
| Zhalute | 141.31 | 72.13 | 1.05 | 0.14 |
| Keshiketeng | 132.20 | 70.88 | 8.50 | 0.01 |
| Wengniute | 131.33 | 18.84 | 17.02 | 0.46 |
| Songshan | 117.12 | 28.49 | 16.04 | 1.17 |
| Balinzuo | 83.49 | 30.20 | 1.61 | 0.00 |
| Kailu | 78.92 | 4.12 | 0.27 | 0.26 |
| Horqin | 72.94 | 0.00 | 0.36 | 0.00 |
| Alukerqin | 68.38 | 18.32 | 2.30 | 0.01 |
| Kalaqin | 59.64 | 27.59 | 1.56 | 0.06 |
| Ning County | 57.91 | 6.00 | 1.01 | 0.07 |
| Linxi | 41.29 | 20.58 | 7.02 | 0.02 |
| Balinyou | 40.44 | 13.66 | 1.44 | 0.00 |
| Yuanbaoshan | 17.66 | 1.46 | 1.59 | 0.21 |
| Hongshan | 7.46 | 0.00 | 0.13 | 0.00 |
| Holingol | 0.14 | 0.00 | 0.00 | 0.00 |
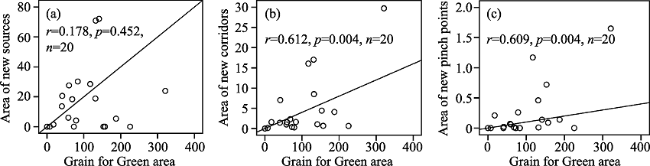
Figure 8 Correlations of farmland reforestation and ecological connectivity |
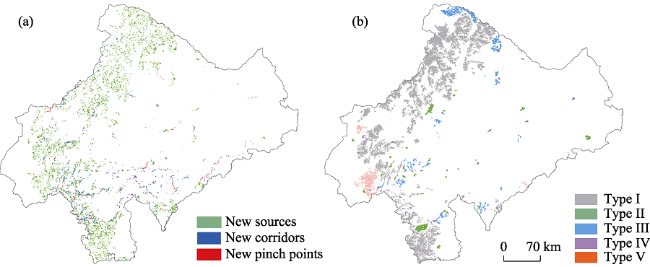
Figure 9 Comparison of the actual and counterfactual scenarios in terms of ecological sources, corridors, pinch points and patch importance (Type I: unchanged importance; Type II: upgraded importance; Type III: downgraded importance; Type IV: gain of important patches; and Type V: loss of important patches) |
| [1] |
|
| [2] |
|
| [3] |
|
| [4] |
|
| [5] |
|
| [6] |
|
| [7] |
|
| [8] |
|
| [9] |
|
| [10] |
|
| [11] |
|
| [12] |
|
| [13] |
|
| [14] |
|
| [15] |
|
| [16] |
|
| [17] |
|
| [18] |
|
| [19] |
|
| [20] |
|
| [21] |
|
| [22] |
|
| [23] |
|
| [24] |
|
| [25] |
|
| [26] |
|
| [27] |
|
| [28] |
|
| [29] |
|
| [30] |
|
| [31] |
|
| [32] |
|
| [33] |
|
| [34] |
|
| [35] |
|
| [36] |
|
| [37] |
|
| [38] |
|
| [39] |
|
| [40] |
|
| [41] |
|
| [42] |
|
| [43] |
|
| [44] |
|
| [45] |
|
| [46] |
|
| [47] |
|
| [48] |
|
| [49] |
|
| [50] |
|
| [51] |
|
| [52] |
|
| [53] |
|
| [54] |
|
| [55] |
|
| [56] |
|
/
| 〈 |
|
〉 |