
Journal of Geographical Sciences >
Spatio-temporal variation in China’s climatic seasons from 1951 to 2017
|
Ma Bin (1990–), PhD, specialized in environmental change and resource assessment. E-mail: ma-bin0937@163.com |
Received date: 2019-12-17
Accepted date: 2020-06-02
Online published: 2020-11-25
Supported by
National Natural Science Foundation of China(41561024)
National Natural Science Foundation of China(31760241)
National Natural Science Foundation of China(41801054)
Copyright
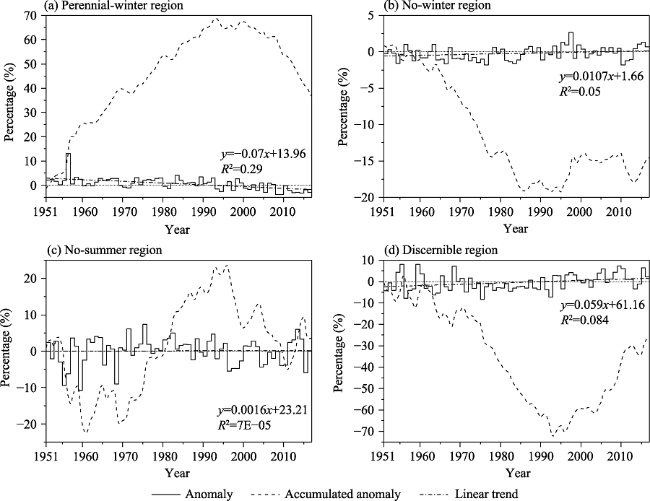
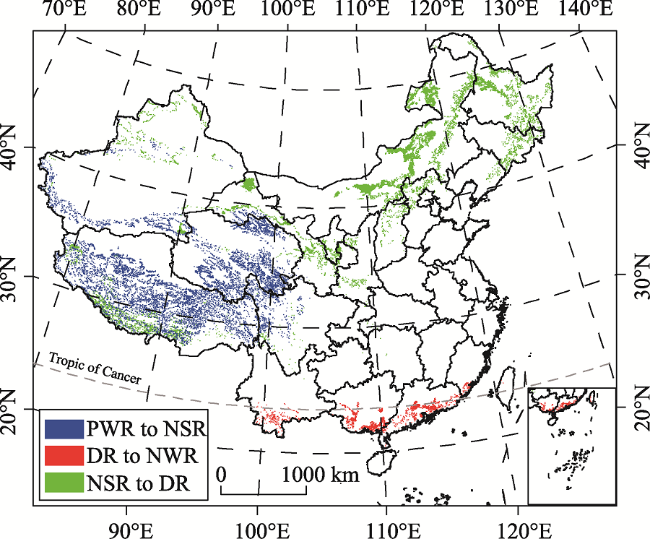
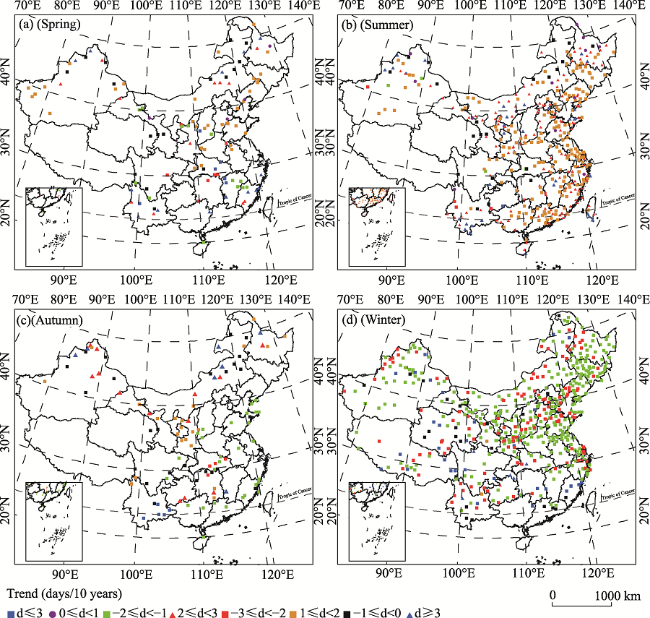
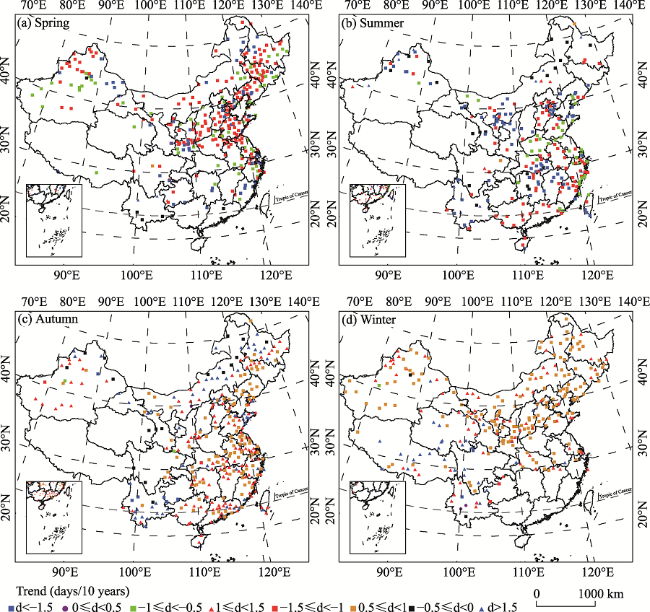
In this paper, meteorological industry standard, daily mean temperature, and an improved multiple regression model are used to calculate China’s climatic seasons, not only to help understand their spatio-temporal distribution, but also to provide a reference for China’s climatic regionalization and crop production. It is found that the improved multiple regression model can accurately show the spatial distribution of climatic seasons. The main results are as follows. There are four climatic seasonal regions in China, namely, the perennial-winter, no-winter, no-summer and discernible regions, and their ranges basically remained stable from 1951 to 2017. The cumulative anomaly curve of the four climatic seasonal regions clarifies that the trend of China’s climatic seasonal regions turned in 1994, after which the area of the perennial-winter and no-summer regions narrowed and the no-winter and discernible regions expanded. The number of sites with significantly reduced winter duration is the largest, followed by the number of sites with increased summer duration, and the number of sites with large changes in spring and autumn is the least. Spring advances and autumn is postponed due to the shortened winter and lengthened summer durations. Sites with significant change in seasonal duration are mainly distributed in Northwest China, the Sichuan Basin, the Huanghe-Huaihe-Haihe (Huang-Huai-Hai) Plain, the Northeast China Plain, and the Southeast Coast.
MA Bin , ZHANG Bo , JIA Lige . Spatio-temporal variation in China’s climatic seasons from 1951 to 2017[J]. Journal of Geographical Sciences, 2020 , 30(9) : 1387 -1400 . DOI: 10.1007/s11442-020-1788-6
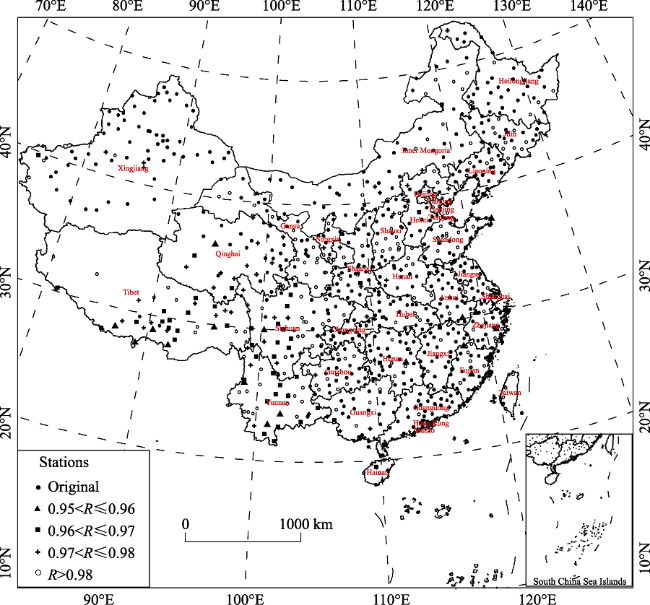
Figure 1 Location of the meteorological stations. R is the goodness of fit between missing data and completion data in China |
Table 1 Threshold temperatures for different climatic seasons |
| Seasons | Spring | Summer | Autumn | Winter |
|---|---|---|---|---|
| Threshold | $10\ \le T{{\overline{M}}_{j}}<22\ $℃ | $T{{\overline{M}}_{j}}\ge 22\ $℃ | $10\ \le T{{\overline{M}}_{j}}<22\ $℃ | $T{{\overline{M}}_{j}}<10\ $℃ |
Table 2 Definition of normal climatic seasonal regions |
| Climatic seasons regions | Abbreviation | Threshold for the temperature of tenderness |
|---|---|---|
| Perennial-winter region | PWR | $T{{\overline{M}}_{j}}<10$℃ |
| Perennial-summer region | PSuR | $T{{\overline{M}}_{j}}\ge 22$℃ |
| Perennial-spring region | PSpR | $10\le T{{\overline{M}}_{j}}<22$℃ |
| No-winter region | NWR | $T{{\overline{M}}_{j}}\ge 10$℃ |
| No-summer region | NSR | $T{{\overline{M}}_{j}}<22$℃ |
| Discernible region | DR | Except the above five cases |
Table 3 Multiple regression models for climatic seasonal length simulation in China for different Climate Normals |
| Climate Normal | Threshold | Multiple regression model | R2 | Significance level |
|---|---|---|---|---|
| 1951-1980 | 10 ℃ | $\begin{align} & Y=4014.82\text{+}41.71\times \theta \text{+}0.003\times {{\theta }^{3}}-4.32\times \text{sin}\theta -1280.2\times \\ & \ \ \ \ \ \ \text{ln}\theta -119.38\times \text{ln}\varphi -0.02\times h \\ \end{align}$ | 0.97 | 0.001 |
| 22 ℃ | $\begin{align} & Y=3461.58+93.51\times \theta -0.65\times {{\theta }^{2}}\text{+}2.42\times \text{sin}\theta -1759.02\times \\ & \ \ \ \ \ \ \text{ln}\theta -121.4\times \text{ln}\varphi -0.09\times h \\ \end{align}$ | 0.958 | 0.001 | |
| 1961-1990 | 10 ℃ | $\begin{align} & Y=4025.87\text{+}41.94\times \theta -0.003\times {{\theta }^{3}}-4.28\times \text{sin}\theta -1285.43\times \\ & \ \ \ \ \ \ \text{ln}\theta -119.33\times \text{ln}\varphi -0.02\times h \\ \end{align}$ | 0.97 | 0.001 |
| 22 ℃ | $\begin{align} & Y=3461.57\text{+}93.51\times \theta -0.65\times {{\theta }^{2}}\text{+}2.42\times \text{sin}\theta -1759.02\times \\ & \ \ \ \ \ \ \text{ln}\theta -121.4\times \text{ln}\varphi -0.09\times h \\ \end{align}$ | 0.958 | 0.001 | |
| 1971-2000 | 10 ℃ | $\begin{align} & Y=4009.6\text{+}41.7\times \theta -0.003\times {{\theta }^{3}}-5.39\times \text{sin}\theta -1280.05\times \\ & \ \ \ \ \ \ \text{ln}\theta -118.44\times \text{ln}\varphi -0.02\times h \\ \end{align}$ | 0.97 | 0.001 |
| 22 ℃ | $\begin{align} & Y=3682.63\text{+}105.4\times \theta -0.74\times {{\theta }^{2}}\text{+}1.75\times \text{sin}\theta -1964.13\times \\ & \ \ \ \ \ \ \text{ln}\theta -165.82\times \text{ln}\varphi -0.1\times h \\ \end{align}$ | 0.958 | 0.001 | |
| 1981-2010 | 10 ℃ | $\begin{align} & Y=3801.72\text{+}38.03\times \theta -0.003\times {{\theta }^{3}}-5.44\times \text{sin}\theta -1193.74\times \\ & \ \ \ \ \ \ \text{ln}\theta -114.2\times \text{ln}\varphi -0.02\times h \\ \end{align}$ | 0.97 | 0.001 |
| 22 ℃ | $\begin{align} & Y=3395.83\text{+}67.93\times \theta -0.006\times {{\theta }^{3}}\text{+}2.1\times \text{sin}\theta -1671.14\times \\ & \ \ \ \ \ \ \text{ln}\theta -147\times \text{ln}\varphi -0.1\times h \\ \end{align}$ | 0.959 | 0.001 |
Table 4 The R, S and RMSE between measured and simulated values of the validation site |
| Station | R | S | RSME | Station | R | S | RSME |
|---|---|---|---|---|---|---|---|
| Hailar | 0.99 | 61.21 | 5.05 | Dardo | 0.99 | 79.33 | 22.77 |
| Karamay | 0.98 | 47.87 | 23.47 | Yanyuan | 0.99 | 109.76 | 17.15 |
| Korla | 0.99 | 56.08 | 19.86 | Zhanyi | 0.99 | 124.65 | 24.16 |
| Yarkant | 0.99 | 62.22 | 5.61 | Gaoping | 0.99 | 77.55 | 4.40 |
| Naomaohu | 0.98 | 44.79 | 17.10 | Shuangfeng | 0.99 | 63.33 | 4.76 |
| Jiuquan | 0.99 | 72.03 | 15.55 | Xuzhou | 0.99 | 57.50 | 3.45 |
| Gonghe | 0.99 | 61.20 | 10.06 | Anqing | 0.99 | 62.44 | 3.26 |
| Urad Zhongqi | 0.99 | 68.65 | 6.08 | Wenzhou | 0.99 | 77.66 | 6.83 |
| Houma | 0.99 | 58.18 | 3.94 | Du’an | 0.99 | 88.15 | 3.00 |
| Changchun | 0.99 | 56.58 | 4.68 | Meixian | 0.99 | 87.59 | 6.98 |
| Qinglong | 0.99 | 60.40 | 4.03 | Tainan | 0.99 | 76.59 | 48.13 |
| Sog | 0.98 | 35.70 | 8.39 | Qionghai | 0.99 | 60.24 | 16.26 |
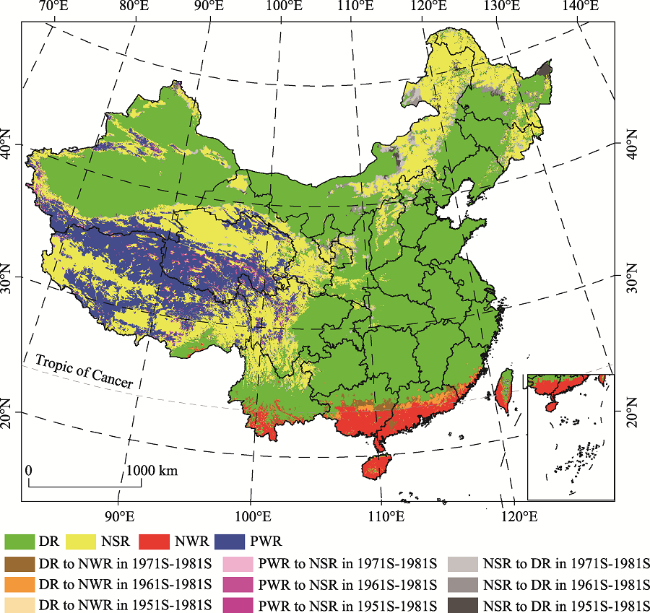
Figure 2 Spatial distribution of climatic seasonal regions in different Climate Normals in China |
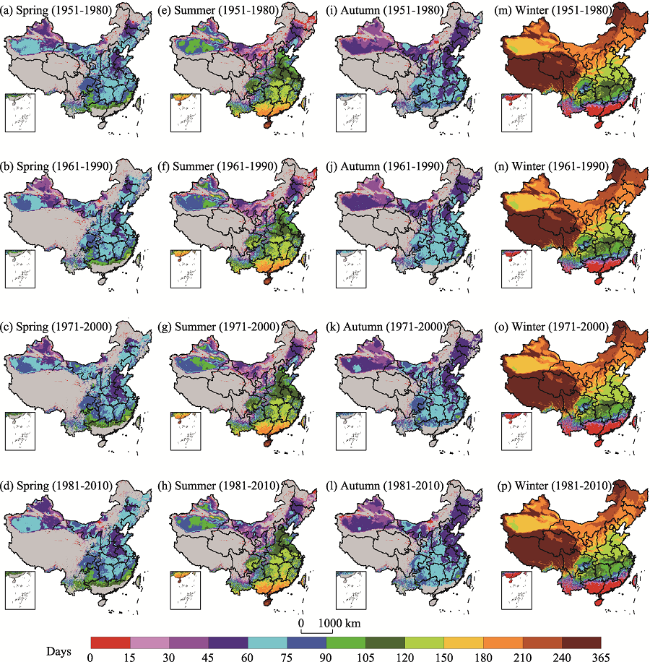
Figure 3 Spatial distribution of spring, summer, autumn and winter duration in different Climate Normals in China |
Figure 4 Linear trends and cumulative anomaly curves in different climatic seasonal regions from 1951 to 2017 |
Figure 5 Spatial distribution of expanded area for climatic seasonal regions in China after 1994 |
Figure 6 Trends of spring, summer, autumn and winter durations from 1951 to 2017 |
Figure 7 Trends of the spring, summer, autumn and winter starting dates in China from 1951 to 2017 |
We are very grateful to the three anonymous reviewers for their suggestions on this manuscript. We also thank Nanjing Hurricane Translation for reviewing the English language quality of our manuscript.
| [1] |
|
| [2] |
|
| [3] |
|
| [4] |
|
| [5] |
|
| [6] |
|
| [7] |
|
| [8] |
|
| [9] |
|
| [10] |
|
| [11] |
|
| [12] |
|
| [13] |
|
| [14] |
|
| [15] |
|
| [16] |
|
| [17] |
|
| [18] |
|
| [19] |
|
| [20] |
|
| [21] |
|
| [22] |
|
| [23] |
|
| [24] |
PCNARCC, 2015. China’s National Assessment Report on Climate Change. Beijing: Science Press.
|
| [25] |
|
| [26] |
|
| [27] |
|
| [28] |
|
| [29] |
|
| [30] |
|
| [31] |
|
| [32] |
|
| [33] |
|
| [34] |
|
| [35] |
|
/
| 〈 |
|
〉 |