
Journal of Geographical Sciences >
Reconstruction of cropland area in the European part of Tsarist Russia from 1696 to 1914 based on historical documents
|
Zhao Zhilong (1988-), PhD, specialized in historical land use and cover change reconstruction. E-mail: zhaozl.14b@igsnrr.ac.cn; zhaozhilong@bnu.edu.cn |
Received date: 2019-12-28
Accepted date: 2020-04-30
Online published: 2020-10-25
Supported by
National Key R&D Program of China(2017YFA0603304)
Copyright
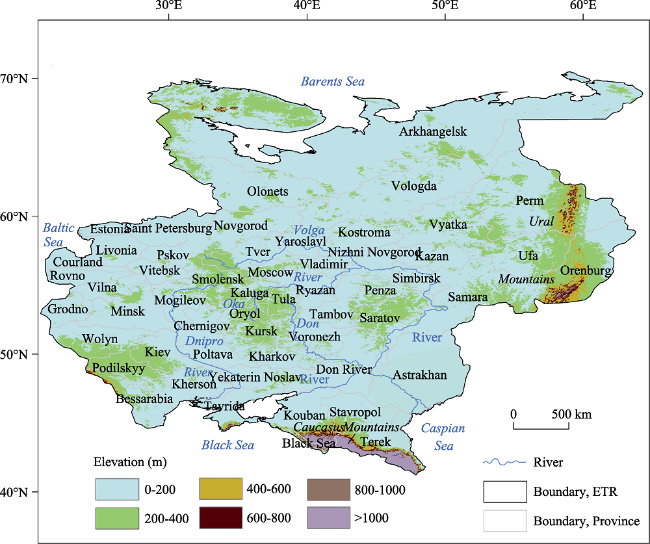
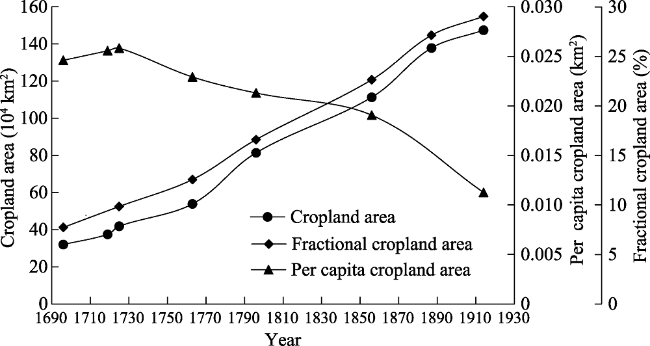
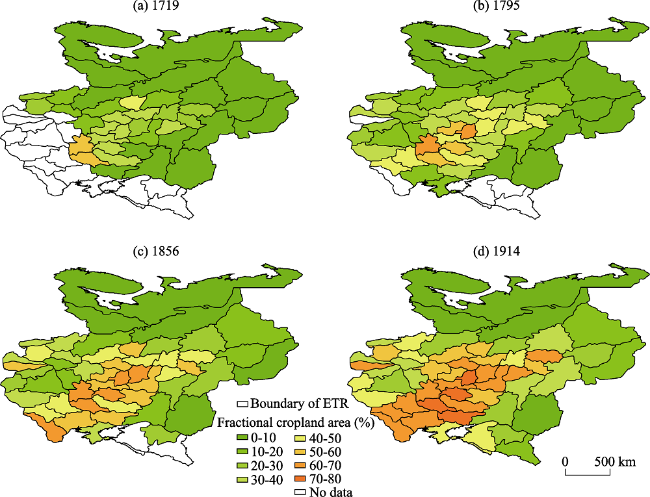
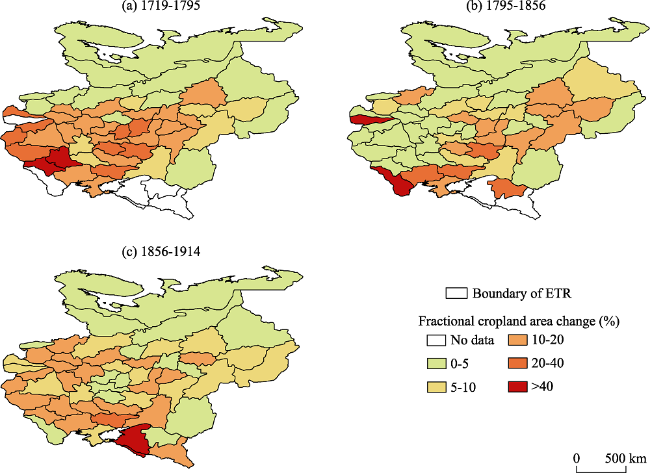
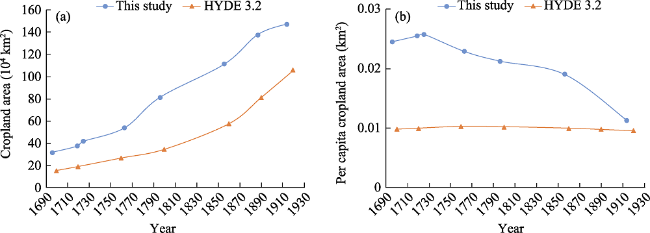
To evaluate the climatic and ecological impacts of anthropogenic activities in global change research, it is essential to reconstruct historical land use and land cover change on regional and global scales. In this study, we reconstructed cropland areas for 54 provinces within the European part of Tsarist Russia (ETR) over the periods of 1696-1914 using historical data, including cropland area, population, grain consumption, and grain yield per unit area. The main results are as follows. (1) Total cropland areas and fractional cropland areas of ETR for 8 time sections during 1696-1914 were reconstructed, the former increased from 31.98×10⁴ km2 to 147.40×10⁴ km2, and the latter increased from 7.89% to 29.20%. The per capita cropland area decreased from 0.0246 km2 to 0.0113 km2 during 1696-1914. (2) Cropland expanded from the central and southwestern ETR to the black soil region, surrounding area of the Volga River, Ukraine region, the new Russia region, the vicinity of Ural, and north Caucasus region. (3) The expansion of territory, increase and migration of population, policies related to agricultural development and foreign trade, and the impacts of climate change were the reasons for the changes in cropland within ETR from 1696 to 1914. (4) In 1914, the cropland area and fractional cropland area of each province varied from 0.16×10⁴ km2 and 0.76% to 5.65×10⁴ km2 and 76.68%, respectively. (5) The comparisons show that the cropland areas of ETR in this study for 1696-1914 are higher than those in the HYDE 3.2 dataset. The main reason for this finding might be the underestimation of per capita cropland areas in the HYDE 3.2 dataset, which values remained at approximately 0.01 km2 from 1700 to 1920.
ZHAO Zhilong , FANG Xiuqi , YE Yu , ZHANG Chengpeng , ZHANG Diyang . Reconstruction of cropland area in the European part of Tsarist Russia from 1696 to 1914 based on historical documents[J]. Journal of Geographical Sciences, 2020 , 30(8) : 1307 -1324 . DOI: 10.1007/s11442-020-1783-y
Figure 1 Location of the study area and the provincial-level units of ETR in 1900. The provincial boundary of ETR is cited from Gilbert (2012). |
Table 1 The data of ETR used in this study |
| Time period | Data content |
|---|---|
| 1696, 1725, 1763, 1796, 1856 | Total cropland area, total land area, total population |
| 1795 | Total land area |
| 1887, 1914 | Fractional cropland area, total land area |
| 1719, 1795, 1856, 1914 | Provincial population, sub-regional grain yield per unit area, provincial land area |
| 1711-1735, 1801-1810, 1851-1860, 1909-1913 | Total population |
| Rural food and feed consumption, urban food and feed consumption, food exports, military food and feed consumption, food consumption in wine-making industry, seed consumption |
The data source is cited from Mironov (2012). |
Figure 2 Changes in cropland area, fractional cropland area and per capita cropland area of ETR during 1696-1914 |
Figure 3 Distribution of the provincial fractional cropland area in ETR during 1719-1914 |
Figure 4 Changes of the provincial fractional cropland area in ETR during 1719-1914 |
Table 2 The number of migrants to different regions in ETR from 1678 to 1915 (104 people) |
| Region | |||||
|---|---|---|---|---|---|
| Time | the black soil region in the central ETR | surrounding area of the Volga River and the vicinity of Ural | new Russia region | north Caucasus region | |
| 1678-1782 | 63 | 27 | |||
| 1782-1858 | 96.8 | 151 | |||
| 1870-1915 | 43.8 | 137.8 | 198.3 | ||
The data source is cited from Mironov (2012). |
Table 3 Differences of fractional cropland area, per capita food and feed consumption, and cropland area in ETR from 1696 to 1914 between this study and other studies |
| Index | Time | Region | Values in this study (Vs) | Values in other literature (Vl) | Difference (Di) |
|---|---|---|---|---|---|
| Fractional cropland area | 1696 | ETR | 7.80% | 7.90% (Tsvetkov, 1957) | 0.10 percentiles |
| 18th century | Nizhni Novgorod | 32.41% | 32.30% (Kukushkina et al., 2018) | -0.11 percentiles | |
| 18th century | Tver | 16.79% | 15% (Karimov and Nosova, 1999) | -1.79 percentiles | |
| 18th century | Ryazan | 27.93% | 29.65% (Matasov, 2016) | 1.72 percentiles | |
| 1795 | Yaroslavl, Vladimir and Ryazan | 42.73% (Yaroslavl) 37.00% (Vladimir) 42.47% (Ryazan) | 20%-75% (Alyabina et al., 2015) | - | |
| 1795 | Chernigov | 61.28% | 60% -75% (James and French, 1983) | - | |
| 1796 | ETR | 16.80% | 16.70% (Tsvetkov, 1957) | -0.10 percentiles | |
| 1914 | Estonia | 26.26% | 25% (Tomson et al., 2015) - 31% (Poska et al., 2014) | - | |
| Lithuania | 49.54% | 43.62% (Li, 1981) | -5.92 percentiles | ||
| Latvia | 34.46% | 32.31% (Li, 1981) | -2.15 percentiles | ||
| Per capita food and feed consumption | 1856 | ETR | 345.15 kg | 349.88kg (Mironov, 2012) | 1.37% |
| Cropland area | 1914 | Kherson | 48889.10 km2 | 46684.70 km2 (Kondratieff, 2017) | -4.51% |
| Saratov | 29348.85 km2 | 28229.00 km2 (Mironov, 2012) | -3.82% | ||
| European Russia | 97.62 (104 km2) | 69.80-104.70 (104 km2) * (Li, 1981) | - | ||
| Ukraine | 32.23 (104 km2) | 27.95-41.93 (104 km2) * (Li, 1981) | - | ||
| Moldova | 2.90 (104 km2) | 2.07-3.11 (104 km2) * (Li, 1981) | - | ||
| Belarus | 5.55 (104 km2) | 4.54-6.81(104 km2) * (Li, 1981) | - | ||
| ETR | 1473955.78 km2 | 1449663.45 km2 (Kondratieff, 2017) | -1.65% |
*In 1914, the three-field system was widely used in ETR. We divided the total sown area of crops by two-thirds to calculate the cropland area in that year. For example, the total sown area of crops in European Russia is 69.8×10⁴ km2, divided by two-thirds, and the cropland area of European Russia in that year is 104.70×10⁴ km2. However, because the total sown area of crops is approximately two-thirds of the cropland area, the cropland area of European Russia in that year was regarded as between 69.8×10⁴ km2 and 104.70×10⁴ km2 in this study. |
Figure 5 Comparison of cropland area and per capita cropland area in ETR between this study and HYDE 3.2 from 1696 to 1914 |
| [1] |
|
| [2] |
|
| [3] |
|
| [4] |
|
| [5] |
|
| [6] |
|
| [7] |
|
| [8] |
|
| [9] |
|
| [10] |
|
| [11] |
|
| [12] |
International Geosphere-Biosphere Programme (IGBP). 2009. PAGES Science Plan and Implementation Strategy, Rep. 57. Stockholm, Sweden: IGBP Secr.
|
| [13] |
|
| [14] |
|
| [15] |
|
| [16] |
|
| [17] |
|
| [18] |
|
| [19] |
|
| [20] |
|
| [21] |
|
| [22] |
|
| [23] |
|
| [24] |
|
| [25] |
|
| [26] |
|
| [27] |
|
| [28] |
|
| [29] |
|
| [30] |
|
| [31] |
|
| [32] |
|
| [33] |
|
| [34] |
|
| [35] |
|
| [36] |
|
| [37] |
|
| [38] |
|
| [39] |
|
| [40] |
|
| [41] |
|
| [42] |
|
| [43] |
|
| [44] |
|
| [45] |
|
| [46] |
|
| [47] |
|
| [48] |
|
| [49] |
|
| [50] |
|
| [51] |
|
| [52] |
|
| [53] |
|
| [54] |
|
| [55] |
|
| [56] |
|
| [57] |
|
| [58] |
|
| [59] |
|
| [60] |
|
/
| 〈 |
|
〉 |