
Journal of Geographical Sciences >
Damage evaluation of soybean chilling injury based on Google Earth Engine (GEE) and crop modelling
|
Cao Juan, PhD Candidate, specialized in agricultural disaters and agricultural insurance |
Received date: 2020-03-10
Accepted date: 2020-05-12
Online published: 2020-10-25
Supported by
National Natural Science Foundation of China(41977405)
National Natural Science Foundation of China(41571493)
National Natural Science Foundation of China(31561143003)
National Natural Science Foundation of China(31761143006)
National Key Research & Development Program of China(2017YFA0604703)
National Key Research & Development Program of China(2019YFA0607401)
Copyright
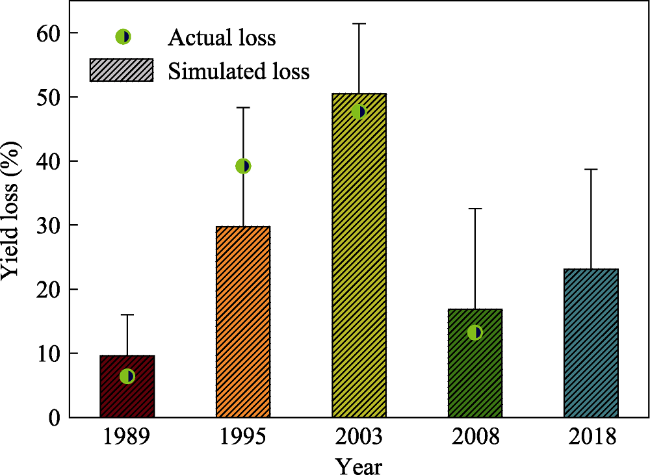
Frequent chilling injury has serious impacts on national food security and in northeastern China heavily affects grain yields. Timely and accurate measures are desirable for assessing associated large-scale impacts and are prerequisites to disaster reduction. Therefore, we propose a novel means to efficiently assess the impacts of chilling injury on soybean. Specific chilling injury events were diagnosed in 1989, 1995, 2003, 2009, and 2018 in Oroqen community. In total, 512 combinations scenarios were established using the localized CROPGRO-Soybean model. Furthermore, we determined the maximum wide dynamic vegetation index (WDRVI) and corresponding date of critical windows of the early and late growing seasons using the GEE (Google Earth Engine) platform, then constructed 1600 cold vulnerability models on CDD (Cold Degree Days), the simulated LAI (Leaf Area Index) and yields from the CROPGRO-Soybean model. Finally, we calculated pixel yields losses according to the corresponding vulnerability models. The findings show that simulated historical yield losses in 1989, 1995, 2003 and 2009 were measured at 9.6%, 29.8%, 50.5%, and 15.7%, respectively, closely (all errors are within one standard deviation) reflecting actual losses (6.4%, 39.2%, 47.7%, and 13.2%, respectively). The above proposed method was applied to evaluate the yield loss for 2018 at the pixel scale. Specifically, a sentinel-2A image was used for 10-m high precision yield mapping, and the estimated losses were found to characterize the actual yield losses from 2018 cold events. The results highlight that the proposed method can efficiently and accurately assess the effects of chilling injury on soybean crops.
CAO Juan , ZHANG Zhao , ZHANG Liangliang , LUO Yuchuan , LI Ziyue , TAO Fulu . Damage evaluation of soybean chilling injury based on Google Earth Engine (GEE) and crop modelling[J]. Journal of Geographical Sciences, 2020 , 30(8) : 1249 -1265 . DOI: 10.1007/s11442-020-1780-1
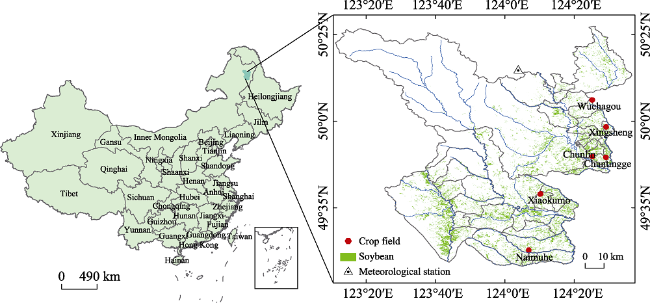
Figure 1 Overview of the study area |
Table 1 The observation information of key growth period, planting density and yield of crop fields |
| Year | Crop field | Wuchagou | Xingsheng | Chuntinge | Chunlin | Naimuhe | Xiaokumo |
|---|---|---|---|---|---|---|---|
| 2014 | Sowing date | 16 May. | 18 May. | 1 May. | 18 May. | 28 May. | 11 May. |
| Flowering date | 14 Jul. | 12 Jul. | 30 Jun. | 6 Jul. | 18 Jul. | 30 Jul. | |
| Maturity date | 26 Sept. | 28 Sept. | 18 Sept. | 28 Sept. | 28 Sept. | 24 Sept. | |
| Plant density (plants/m2) | 39.69 | 30.42 | 47.73 | 36.75 | 37.98 | 38.47 | |
| Yield(kg/ha) | 1160 | 1350 | 1650 | 1150 | 610 | 1050 | |
| 2015 | Sowing date | 16 May. | 16 May. | 28 May. | 8 May. | 17 May. | 18 May. |
| Flowering date | 16 Jul. | 10 Jul. | 2 Jul. | 12 Jul. | 16 Jul. | 8 Jul. | |
| Maturity date | 16 Sept. | 14 Sept. | 28 Sept. | 28 Sept. | 28 Sept. | 8 Sept. | |
| Plant density (plants/m2) | 47.94 | 35.6 | 38.18 | 26.24 | 25.84 | 28.58 | |
| Yield(kg/ha) | 980 | 1100 | 1410 | 1030 | 510 | 860 | |
| 2016 | Sowing date | 6 Jun. | 16 May. | 6 May. | 22 May. | 18 May. | 18 May. |
| Flowering date | 20 Jul. | 14 Jul. | 28 Jul. | 28 Jul. | 2 Jul. | 2 Jul. | |
| Maturity date | 30 Sept. | 26 Sept. | 18 Sept. | 30 Sept. | 18 Sept. | 14 Sept. | |
| Plant density (plants/m2) | 32.97 | 30.55 | 40.04 | 42.9 | 40.8 | 35.82 | |
| Yield(kg/ha) | 1280 | 1450 | 1850 | 1370 | 670 | 1110 | |
| 2017 | Sowing date | 24 May. | 23 May. | 21 May. | 18 May. | 24 May. | 2 Jun. |
| Flowering date | 8 Jul. | 12 Jul. | 22 Jul. | 8 Jul. | 1 Jul. | 14 Jul. | |
| Maturity date | 28 Sept. | 24 Sept. | 22 Sept. | 18 Sept. | 18 Sept. | 24 Sept. | |
| Plant density (plants/m2) | 43.5 | 35.76 | 27.56 | 36.9 | 40.6 | 52.36 | |
| Yield(kg/ha) | 1350 | 1500 | 1240 | 1500 | 750 | 1200 |
Table 2 The basic information of six crop fields |
| Crop field | Wuchagou | Xingsheng | Chuntinge | Chunlin | Naimuhe | Xiaokumo |
|---|---|---|---|---|---|---|
| Longitude (°) | 124.42 | 124.49 | 124.49 | 124.42 | 124.11 | 124.17 |
| Latitude (°) | 50.10 | 49.97 | 49.83 | 49.83 | 49.4 | 49.7 |
| Elevation (m) | 486 | 393 | 380 | 365 | 381 | 447 |
| Cultivar | Heihe 38 | Heilong 35 | Hefeng 50 | Hefeng 25 | Hefeng 39 | Heihe 18 |
| Maturity | Medium | Medium | Medium | Mid-late | Medium | Medium |
| Cultivation way | Drilling | Drilling | Drilling | Ridge tillage | Drilling | Drilling |
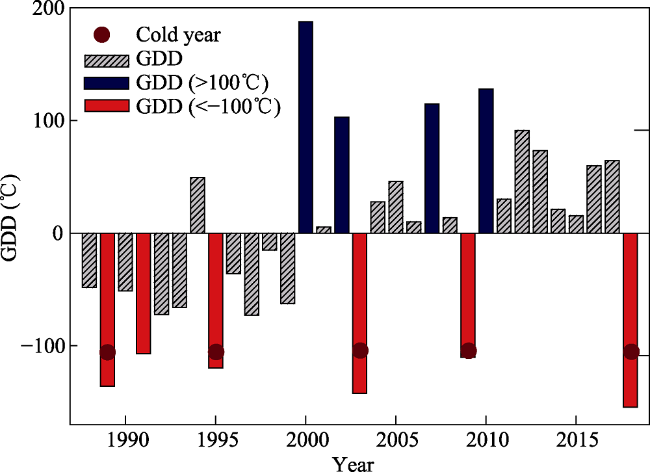
Figure 2 The cold years in Northeast China |
Table 3 CROPGRO-Soybean model parameters and the genetic coefficients of crop fields |
| Coefficient | Definition | Default value | Wuchagou | Xingsheng | Chuntinge | Chunlin | Naimuhe | Xiaokumo |
|---|---|---|---|---|---|---|---|---|
| CSDL | Critical short day length below which reproductive development progresses with no day length effects (h) | 12.15 | 14.03 | 12.23 | 13.06 | 14.58 | 11.9 | 14.03 |
| PPSEN | Slope of the relative response of development to photoperiod with time (1/h) | 0.2 | 0.235 | 0.294 | 0.287 | 0.229 | 0.146 | 0.304 |
| EM-FL | Time between plant emergence and flower appearance (day) | 21 | 13.09 | 18.33 | 15.46 | 16.53 | 26.14 | 22.74 |
| FL-SH | Time between first flower and first pod (day) | 6 | 6 | 6 | 6 | 6 | 6 | 6 |
| FL-SD | Time between first flower and first seed (day) | 12 | 19.82 | 21.06 | 18.42 | 18.39 | 11.26 | 12.06 |
| SD-PM | Time between first seed and physiological maturity (day) | 26 | 37.56 | 24.5 | 36.63 | 31.27 | 22.25 | 34.33 |
| FL-LF | Time between first flower and end of leaf expansion (day) | 20 | 20 | 20 | 20 | 20 | 20 | 20 |
| LFMAX | Maximum leaf photosynthesis rate at 30℃, 350 vpm CO2, and high light (mg CO2/m2 s) | 1.03 | 1.023 | 1.052 | 1.034 | 1.011 | 1.196 | 1.257 |
| SLAVR | Specific leaf area of cultivar under standard growth conditions (cm2/g) | 385 | 311.2 | 303.8 | 301 | 317.6 | 337.9 | 301.1 |
| SIZLF | Maximum size of full leaf (three leaflets (cm2) | 137 | 138.1 | 145.1 | 138 | 141.2 | 188.5 | 217.6 |
| XFRT | Maximum fraction of daily growth that is partitioned to seed+shell (-) | 1 | 1 | 1 | 1 | 1 | 1 | 1 |
| WTPSD | Maximum weight per seed (g) | 0.155 | 0.162 | 0.157 | 0.161 | 0.181 | 0.195 | 0.186 |
| SFDUR | Seed filling duration for pod cohort at standard growth conditions (day) | 22 | 25.42 | 24.88 | 24.22 | 25.36 | 21.62 | 21.94 |
| SDPDV | Average seed per pod under standard growing conditions (numbers per pod) | 2.2 | 2.415 | 2.276 | 2.09 | 2.24 | 2.397 | 1.794 |
| PODUR | Time required for cultivar to reach final pod load under optimal conditions (day) | 13 | 13 | 13 | 13 | 13 | 13 | 13 |
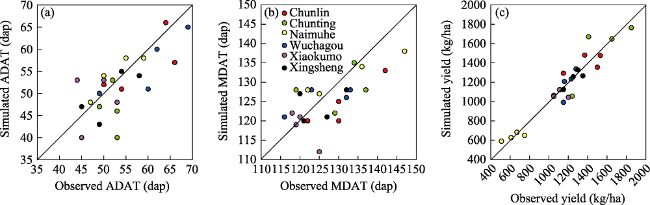
Figure 3 Comparison between simulated and observed variables of soybean |
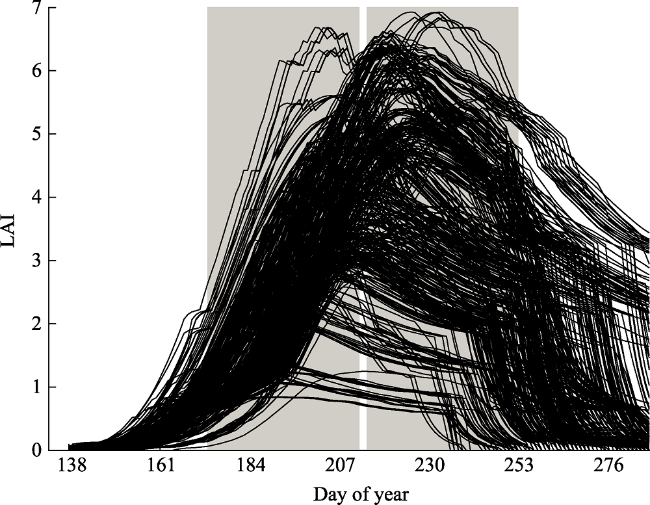
Figure 4 illustrates the simulated profiles of soybean LAIs determined from 512 simulations. The LAI values vary considerably from 2 to 7, which is largely due to the fact that soybean growth processes are variable under different weather conditions and farming management systems. Note that the early and late windows (denoted by shaded rectangles in the figure) basically cover the critical growth period of each simulation. These simulation results thus show a broad range of variability in training the regression model given in Eq. (1). |
Figure 4 Daily leaf area index outputs from 512 simulations of the CROPGRO-Soybean model (the shaded rectangles indicate the “early-season” and “late-season” windows used for image observations) |
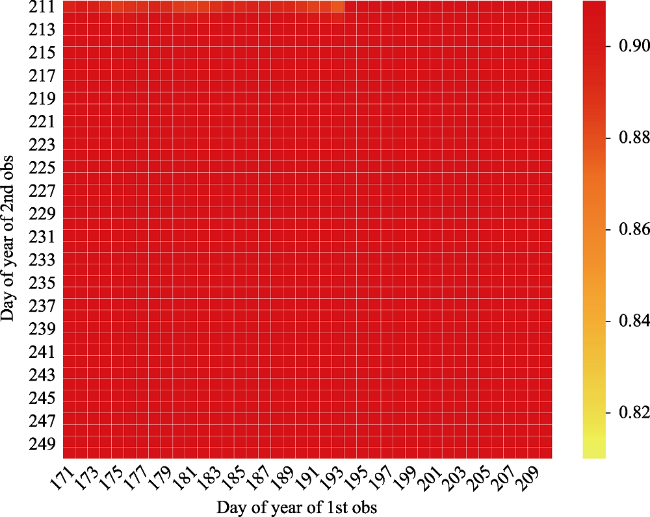
Figure 5 The coefficient of determination (R2) for the regression models |
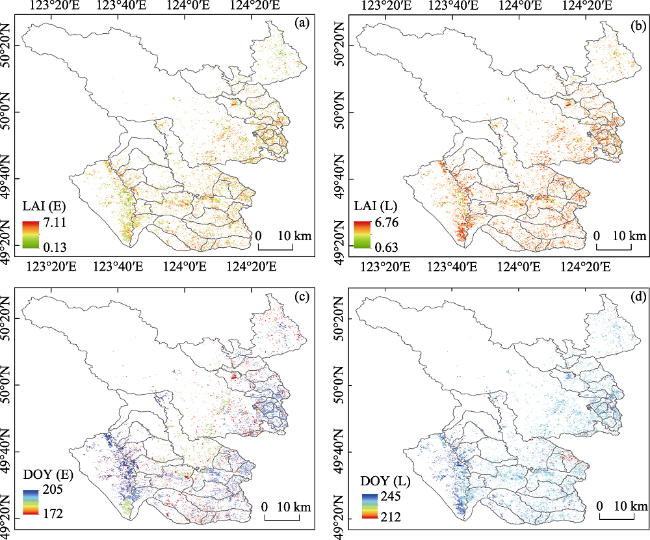
Figure 6 The maximum LAI and its specific observation dates of early and late growing season windows obtained from Sentinel-2 in 2018 (a and c represent the maximum LAI and its specific observation dates of early growing season windows; b and d for late growing season windows, respectively) |
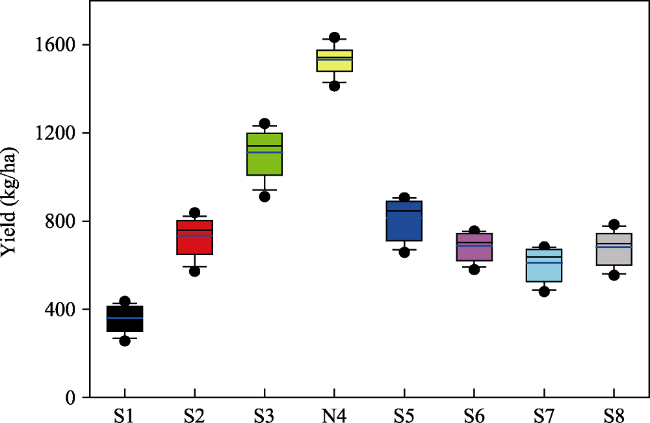
Figure 7 Estimated yields by calibrated CROPGRO-Soybean model under different cold injury scenarios (scenarios S1, S2 and S3 are set as reducing 3℃, 2℃ and 1℃ at the whole growth stages, respectively. Scenario N4 is set as actual weather. Scenarios S5, S6, S7 and S8 are set randomly as minimum temperature of 0℃ for 5 consecutive days during the periods from seedling emergence to flowering stage, flowering stage to pod bearing stage, and pod bearing stage to filling stage, and filling stage to maturity stage, respectively.) |
Figure 8 The comparison between actual and simulated yield losses |
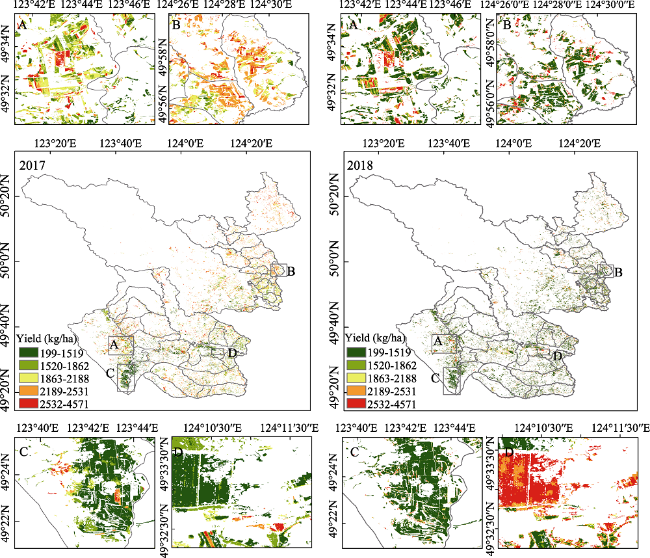
Figure 9 Spatial distribution of estimated yields in normal year (2017) and cold year (2018) |
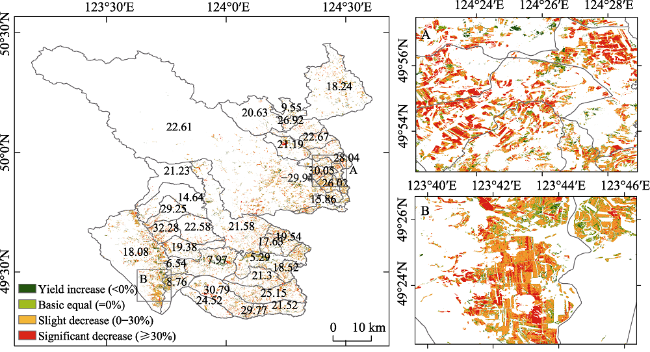
Figure 10 The spatial distribution of yield losses in 2018 relative to 2017 |
Table 4 The estimated yield losses of soybean at town level |
| Town | Yield loss (%) | Town | Yield loss (%) | Town | Yield loss (%) |
|---|---|---|---|---|---|
| Karichu | 21.23 | Wobei | 29.77 | Xiangyang | 24.35 |
| Lingnan | 14.64 | Zhaxi | 19.54 | Wuerqi | 31.14 |
| Neerkeqi | 22.61 | Wuchagou | 15.86 | Chaoyangliehu | 21.19 |
| Qingsonggou | 24.52 | Naimuhe | 25.15 | Shiliudongfang | 32.28 |
| Tuanjie | 19.38 | Maweishan | 18.34 | Nuominghe | 6.54 |
| Yuchang | 8.76 | Kuweidi | 22.58 | Xiaoerhong | 18.08 |
| Xinxing | 9.55 | Yuejing | 28.83 | Longtou | 29.25 |
| Oukenhe | 18.24 | Kuilehe | 5.29 | Xinfeng | 20.63 |
| Xingsheng | 28.04 | Dongsheng | 21.52 | Woluohe | 30.79 |
| Ershili | -29.94 | Xiaokumo | 17.63 | Tiedong | 30.05 |
| Wulubutie | 9.53 | Doushigou | 21.30 | Dakumo | 21.58 |
| Hongqi | 22.65 | Chaoyanggou | 22.67 | Ergenghe | 7.97 |
| Maanshan | 18.52 | Xinfa | 26.92 | Dongsheng | 21.52 |
| Chunlin | 26.02 | Chuntinge | 16.09 | Maojiapu | 18.77 |
| [1] |
|
| [2] |
|
| [3] |
|
| [4] |
|
| [5] |
|
| [6] |
|
| [7] |
|
| [8] |
|
| [9] |
|
| [10] |
|
| [11] |
|
| [12] |
|
| [13] |
|
| [14] |
|
| [15] |
|
| [16] |
|
| [17] |
|
| [18] |
|
| [19] |
|
| [20] |
|
| [21] |
|
| [22] |
|
| [23] |
|
| [24] |
|
| [25] |
|
| [26] |
|
| [27] |
|
| [28] |
|
| [29] |
|
| [30] |
|
| [31] |
|
/
| 〈 |
|
〉 |